. 2024 Feb 28;16(5):3022-3039.
doi: 10.14336/AD.2024.0228.

C. elegans Presenilin Mediates Inter-Organelle Contacts and Communication that Is Required for Lysosome Activity

Affiliations

C. elegans Presenilin Mediates Inter-Organelle Contacts and Communication that Is Required for Lysosome Activity

Kerry C Ryan et al. Aging Dis. .

Abstract

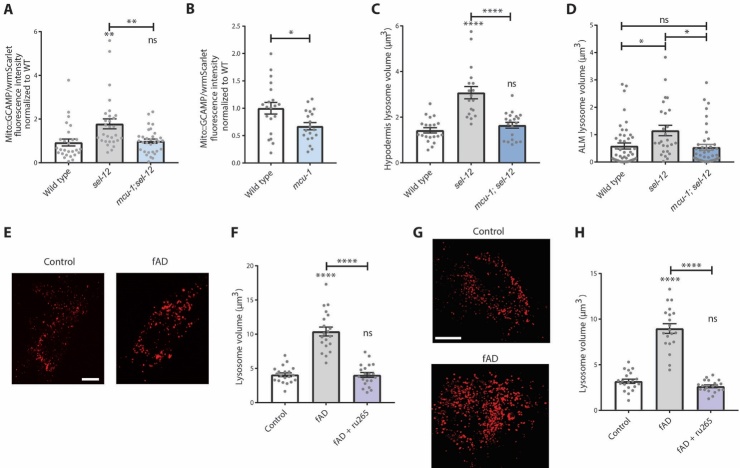
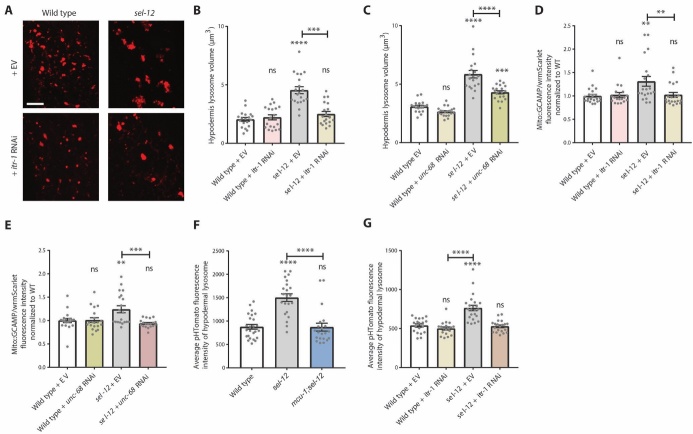
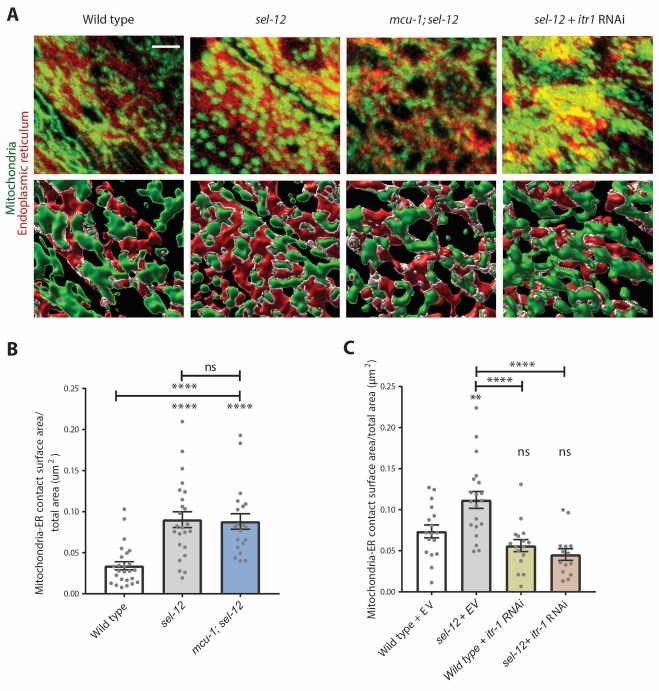
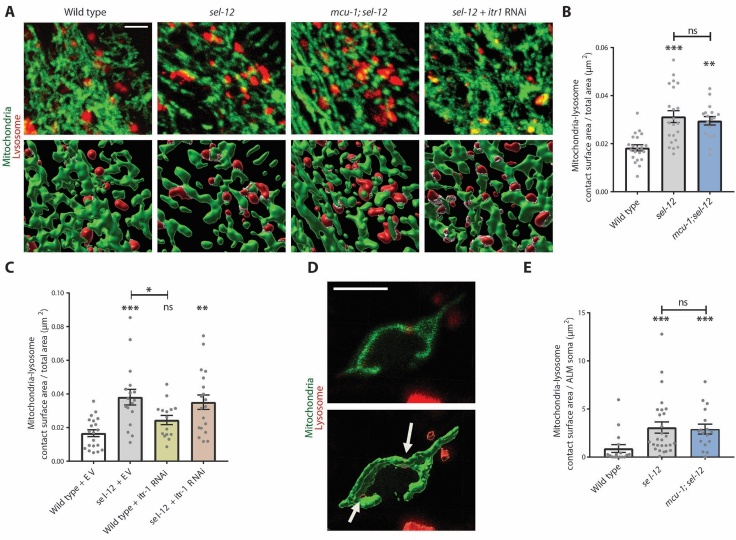
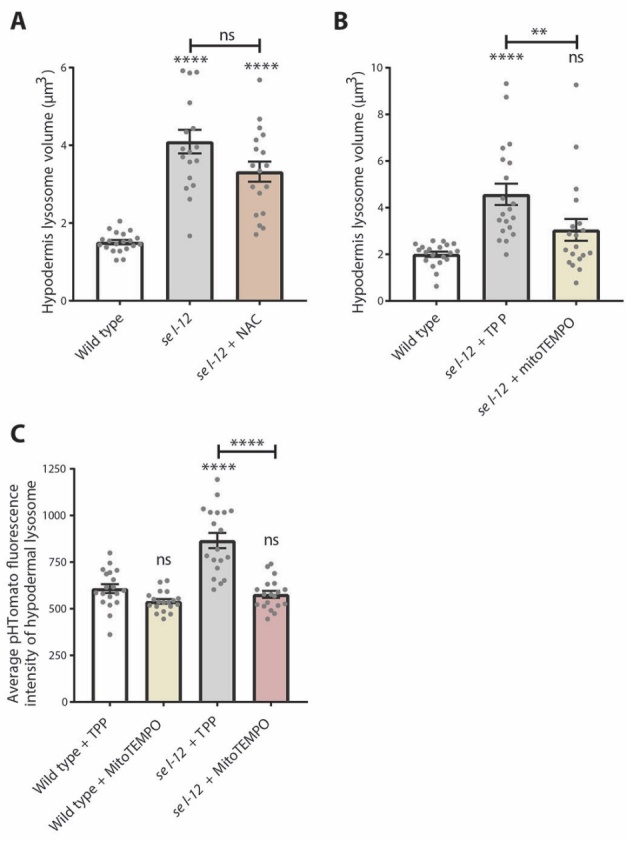
Compromised lysosome function is implicated in the pathology of many neurodegenerative diseases, including Alzheimer's disease (AD). Familial Alzheimer's disease (fAD) is caused primarily by mutations in the presenilin encoding genes, but the underlying mechanism remains obscure. Loss of the conserved C. elegans presenilin orthologue SEL-12 results in increased mitochondrial calcium, which promotes neurodegeneration. Here, we find that sel-12 mutant lysosomes, independent of SEL-12 proteolytic activity, are significantly enlarged and more alkaline due to increased ER-to-mitochondrial calcium signaling and concomitant mitochondrial oxidative stress. These defects and their dependence on mitochondrial calcium are recapitulated in human fAD fibroblasts, demonstrating a conserved role for mitochondrial calcium in presenilin-mediated lysosome dysfunction. sel-12 mutants also have increased contact surface area between the ER, mitochondria, and lysosomes, suggesting sel-12 has an additional role in modulating organelle contact and communication. Overall, we demonstrate that SEL-12 maintains lysosome acidity and lysosome health by controlling ER-to-mitochondrial calcium signaling.


Figures

Figure 1.
Figure 1.
sel-12 mutant lysosomes are enlarged and more alkaline. (A) Representative images of wild type and sel-12(ty11) lysosomes within the ALM soma in animals co-expressing nuc-1::mCherry as a marker for lysosomes (arrows) and mec-4p::GFP to mark the TRNs (scale bar = 5 µm). (B) Quantification of average lysosome volume within the ALM TRN soma in wild type and sel-12 animals (n ≥ 18 animals). (C and D) Representative images of wild type and sel-12(ty11) lysosomes in the ALM soma in animals expressing mec-7p::lmp-1::wrmScarlet (C) (scale bar = 5 µm), and quantification of average lysosome volume (D) (n ≥ 18 animals). (E) Quantification of the number of lysosomes per soma in animals expressing mec-7p::lmp-1::wrmScarlet (n ≥ 14 animals). (F and G) Representative images of wild type and sel-12 lysosomes (arrows) in the axons of animals expressing mec-7p::lmp-1::wrmScarlet (scale bar = 5 µm) (F) and quantification of the number of lmp-1::wrmScarlet puncta per ALM axon (G) (n ≥ 13). (H and I) Representative images of hypodermal lysosomes in animals expressing nuc-1::mCherry as a marker for the lysosomal lumen (scale bar = 10 µm) (H) and quantification of average hypodermal lysosome volume (I) (n ≥ 18 animals). (J) Lysosome volume (nuc-1::mCherry) in L4 wild type and sel-12 animals (n ≥ 19 animals). (K and L) Representative images (K) and quantification of the average pHTomato fluorescence intensity per lysosome in animals expressing nuc-1::pHTomato controlled by the heat-shock promoter (L) (scale bar = 10 µm) (n ≥ 21 animals). Increased pHTomato fluorescence intensity indicates increased pH. (M) Linear regression for pHTomato fluorescence volume and intensity in sel-12(ty11) mutants (p < 0.001). ns p > 0.05, * p < 0.05, ** p < 0.01, *** p < 0.001, **** p < 0.0001. For D, G, I, J, and L, a two-tailed Student’s t test was used. For B and E, Kruskal-Wallis test was used. Error bars indicate mean ± SEM.
Figure 2.
Figure 2.
sel-12-mediated lysosome dysfunction is ameliorated by blocking mitochondrial calcium uptake. (A and B) Fluorescence intensity of mitochondrial-targeted GCaMP6, a genetically encoded calcium indicator, in the hypodermis of animals also expressing cytosolic wrmScarlet as an internal expression control (semo-1p::2xMLS::GCaMP6f::SL2::wrmScarlet). (C) Quantification of hypodermal lysosome volume in wild type, sel-12, and mcu-1; sel-12 animals expressing nuc-1::mCherry as a marker for the lysosomal lumen (n ≥ 18 animals). (D) Lysosome volume within the ALM soma in animals co-expressing nuc-1::mCherry to mark the lysosomes and mec-4p::GFP to mark the TRNs (n ≥ 18 animals). (E and F) Representative images of lysotracker-labeled lysosomes in fibroblasts isolated from control and fAD patients (scale bar = 15 µm) and (F) quantification of lysosome volume (+/- ru265) (n = 20 cells). (G and H) Representative images of lysosomes in control and fAD patient fibroblasts transfected with Lamp1-RFP (Celllight BacMam 2.0, Invitrogen) (scale bar = 20 µm), and (H) quantification of lysosome volume (+/- ru265) (n = 20 animals). ns p > 0.05, * p < 0.05, ** p < 0.01, *** p < 0.001, **** p < 0.0001. For B, C, F, and H, one-way ANOVA with Tukey’s multiple comparisons test was used. For A and D, Kruskal-Wallis test with Dunn’s multiple comparison test was used. Error bars indicate mean ± SEM. Comparisons are made to wild type unless otherwise indicated.
Figure 3.
Figure 3.
Aberrant ER-to-mitochondrial calcium transfer results in enlarged, more alkaline lysosomes. (A and B) Representative images of lysosomes (nuc-1::mCherry) in wild type and sel-12(ty11) animals grown on either control empty vector (EV) or itr-1 RNAi (A) (scale bar = 10 µm), and quantification of lysosome volume (B) (n ≥ 19 animals). (C) Quantification of lysosome volume (nuc-1::mCherry) in animals grown on either EV or unc-68 RNAi (n ≥ 18 animals). (D and E) Fluorescence intensity of hypodermal mitochondrial-targeted GCaMP6, a genetically encoded calcium indicator, normalized to cytosolic wrmScarlet, used as an internal expression control (n ≥ 19 animals). (F) Quantification of the average pHTomato fluorescence intensity per lysosome in animals expressing nuc-1::pHTomato controlled by the heat-shock promoter, with increased pHTomato fluorescence intensity indicating increased pH (n ≥ 21 animals). (G) nuc-1::pHTomato fluorescence in wild type and sel-12(ty11) animals grown on either EV or itr-1 RNAi (n ≥ 19 animals). ns p > 0.05, * p < 0.05, *** p < 0.001, **** p < 0.0001. For C and G, one-way ANOVA with Tukey’s multiple comparisons test was used. For B, D, E, and F, Kruskal-Wallis test with Dunn’s multiple comparison test was used. Error bars indicate mean ± SEM. Comparisons are made to wild type unless otherwise indicated.
Figure 4.
Figure 4.
sel-12 mutants have increased mitochondria and endoplasmic reticulum contact points dependent upon itr-1 function but not mcu-1. (A) Representative confocal z-stack images of hypodermal mitochondria (green) and endoplasmic reticulum (red) and rendering of 3D images (bottom panels) with white indicating ER-mitochondrial contact points (scale bar = 4 µm). (B) Quantification of the ratio of mitochondria-ER contact surface area to total area of visible hypodermis in wild type, sel-12(ty11), and mcu-1; sel-12(ty11) animals (n ≥ 20 animals). (C) Mitochondrial-ER contact surface to total surface area ratio in animals treated with either empty vector (EV) or itr-1 RNAi (n ≥ 15 animals). ns p > 0.05, *p < 0.05, ****p < 0.0001 using Kruskal-Wallis with Dunn’s post-hoc test. Error bars indicate mean ± SEM. Comparisons are made to wild type unless otherwise indicated.
Figure 5.
Figure 5.
sel-12 mutants have increased mitochondria and lysosome contact points. (A) Representative confocal z-stack images of hypodermal mitochondria (green) and lysosomes (red) (scale bar = 4 µm) and rendering of 3D images (bottom panels) with white indicating mitochondria-lysosome contact points (scale bar = 4 µm). (B) Quantification of the ratio of mitochondria-lysosome contact surface area to total area of visible hypodermis in wild type, sel-12(ty11), and mcu-1; sel-12(ty11) animals (n ≥ 17 animals). (C) Mitochondrial-lysosome contact surface to total surface area ratio in animals treated with either empty vector or itr-1 RNAi (n ≥ 15 animals). (D) Representative images of confocal z-stack (upper panel) and 3D rendered (lower panel) images of ALM soma in animals co-expressing a mitochondrial marker driven under a TRN-specific promoter and a lysosome marker, with arrows indicating contact sites between lysosomes and neuronal mitochondria (scale bar = 5 µm). (E) Quantification of mitochondria-lysosome contact surface area per ALM soma (n ≥ 16 animals). ns p > 0.05, *p < 0.05, ** p < 0.01, ***p < 0.001. For B and C, one-way ANOVA with Tukey’s multiple comparisons test was used. For E, Kruskal-Wallis test with Dunn’s multiple comparison test was used. Comparisons are to wild type unless otherwise indicated. Error bars indicate mean ± SEM.
Figure 6.
Figure 6.
sel-12 mutants have increased endoplasmic reticulum and lysosome contact points dependent upon ER-to-mitochondria calcium signaling. (A) Representative confocal z-stack images of hypodermal endoplasmic reticulum (green) and lysosomes (red) and rendering of 3D images (bottom panels) with white indicating ER-lysosome contact points (scale bar = 4 µm). (B) Quantification of the ratio of mitochondria-ER contact surface area to total area of visible hypodermis in wild type, sel-12(ty11), and mcu-1; sel-12(ty11) animals (n ≥ 17 animals). (C) Mitochondrial-ER contact surface to total surface area ratio in animals treated with either empty vector or itr-1 RNAi (n ≥ 15 animals). ns p > 0.05, *p < 0.05, **p < 0.01 using one-way ANOVA with Tukey’s multiple comparison test. Comparisons are made to wild type unless otherwise indicated. Error bars indicate mean ± SEM.
Figure 7.
Figure 7.
Lysosome defects are alleviated by mitochondrial-targeted antioxidant treatment. (A) Lysosome volume (nuc-1::mCherry) in wild type, sel-12(ty11), and sel-12(ty11) animals grown with N-acetylcysteine (NAC) (n ≥ 18 animals). (B) Lysosome volume (nuc-1::mCherry) in wild type and sel-12 animals treated with either the antioxidant MitoTEMPO or vehicle (TPP) (n ≥ 19 animals). (C) Quantification of the average pHTomato fluorescence intensity per lysosome in animals expressing nuc-1::pHTomato controlled by the heat-shock promoter, with increased pHTomato fluorescence intensity indicating increased pH (n ≥ 19 animals). ns p > 0.05, *p < 0.05, ****p < 0.0001. For A and C, one-way ANOVA with Tukey’s multiple comparisons test was used. For B, Kruskal-Wallis test with Dunn’s multiple comparison test was used. Error bars indicate mean ± SEM. Comparisons are made to wild type unless otherwise indicated.

Similar articles

Cited by

References

    1. Kaushik S, Cuervo AM (2015). Proteostasis and aging. Nat Med, 21: 1406-15. - PubMed
    1. Labbadia J, Morimoto RI (2015). The biology of proteostasis in aging and disease. Annu Rev Biochem, 84: 435-64. - PMC - PubMed
    1. Nixon, RA, Yang DS (2011). Autophagy failure in Alzheimer's disease--locating the primary defect. Neurobiol Dis, 43: 38-45. - PMC - PubMed
    1. Wolfe DM, Lee JH, Kumar A, Lee S, Orenstein SJ, Nixon RA (2013). Autophagy failure in Alzheimer's disease and the role of defective lysosomal acidification. Eur J Neurosci, 37: 1949-61. - PMC - PubMed
    1. Boland B, Kumar A, Lee S, Platt FM, Wegiel J, Yu WH, Nixon RA (2008). Autophagy induction and autophagosome clearance in neurons: relationship to autophagic pathology in Alzheimer's disease. J Neurosci, 28: 6926-37. - PMC - PubMed

LinkOut - more resources