Multicenter Study
. 2024 Nov 1;80(5):1196-1211.
doi: 10.1097/HEP.0000000000000883. Epub 2024 Apr 12.

An artificial intelligence-generated model predicts 90-day survival in alcohol-associated hepatitis: A global cohort study

Winston Dunn  1 Yanming Li  1 Ashwani K Singal  2 Douglas A Simonetto  3 Luis A Díaz  4 Francisco Idalsoaga  4 Gustavo Ayares  5 Jorge Arnold  4 María Ayala-Valverde  5 Diego Perez  5 Jaime Gomez  5 Rodrigo Escarate  5 Eduardo Fuentes-López  6 Carolina Ramirez-Cadiz  7 Dalia Morales-Arraez  8 Wei Zhang  9   10 Steve Qian  9 Joseph C Ahn  3 Seth Buryska  3 Heer Mehta  1 Nicholas Dunn  1 Muhammad Waleed  2 Horia Stefanescu  11 Andreea Bumbu  11 Adelina Horhat  12 Bashar Attar  13 Rohit Agrawal  14 Joaquín Cabezas  15   16 Victor Echavaría  15   16 Berta Cuyàs  17 Maria Poca  17 German Soriano  17 Shiv K Sarin  18 Rakhi Maiwall  18 Prasun K Jalal  19 Fátima Higuera-de-la-Tijera  20 Anand V Kulkarni  21 P Nagaraja Rao  21 Patricia Guerra-Salazar  22 Lubomir Skladaný  23 Natália Kubánek  23 Veronica Prado  24 Ana Clemente-Sanchez  8   25   26 Diego Rincon  25 Tehseen Haider  27 Kristina R Chacko  27 Gustavo A Romero  28 Florencia D Pollarsky  28 Juan C Restrepo  29 Luis G Toro  30 Pamela Yaquich  31 Manuel Mendizabal  32 Maria L Garrido  33 Sebastián Marciano  34 Melisa Dirchwolf  35 Victor Vargas  36 César Jiménez  36 David Hudson  37 Guadalupe García-Tsao  38 Guillermo Ortiz  38 Juan G Abraldes  39 Patrick S Kamath  3 Marco Arrese  4 Vijay H Shah  3 Ramon Bataller  40 Juan Pablo Arab  4   37   41
Affiliations
Multicenter Study

An artificial intelligence-generated model predicts 90-day survival in alcohol-associated hepatitis: A global cohort study

Winston Dunn et al. Hepatology. .

Abstract

Background and aims: Alcohol-associated hepatitis (AH) poses significant short-term mortality. Existing prognostic models lack precision for 90-day mortality. Utilizing artificial intelligence in a global cohort, we sought to derive and validate an enhanced prognostic model.

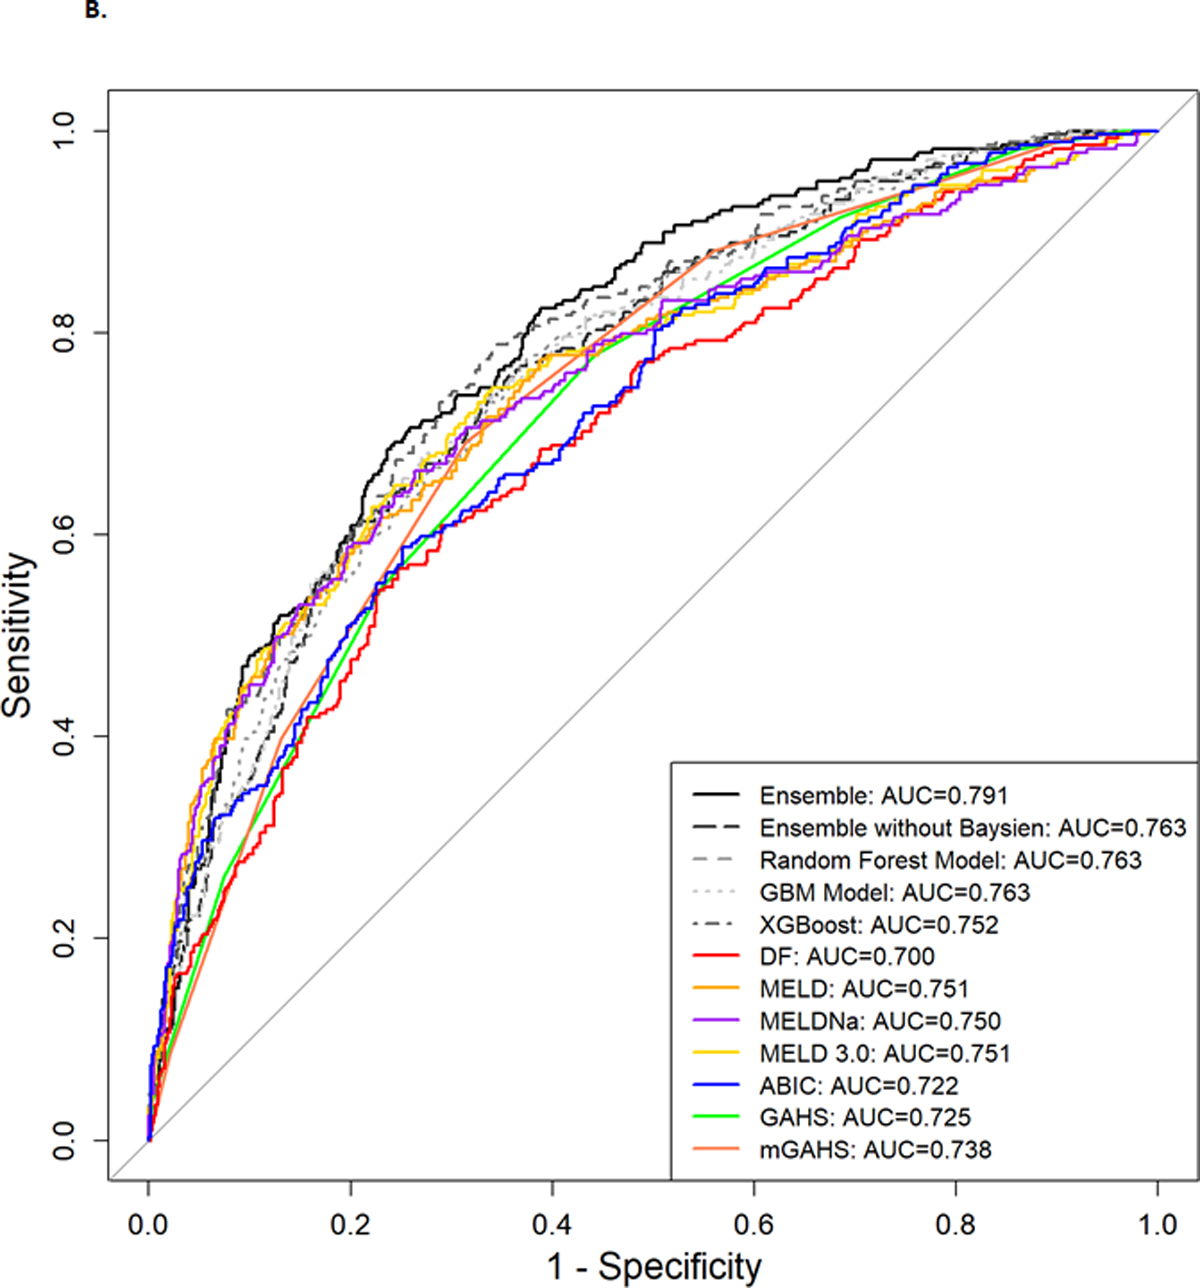
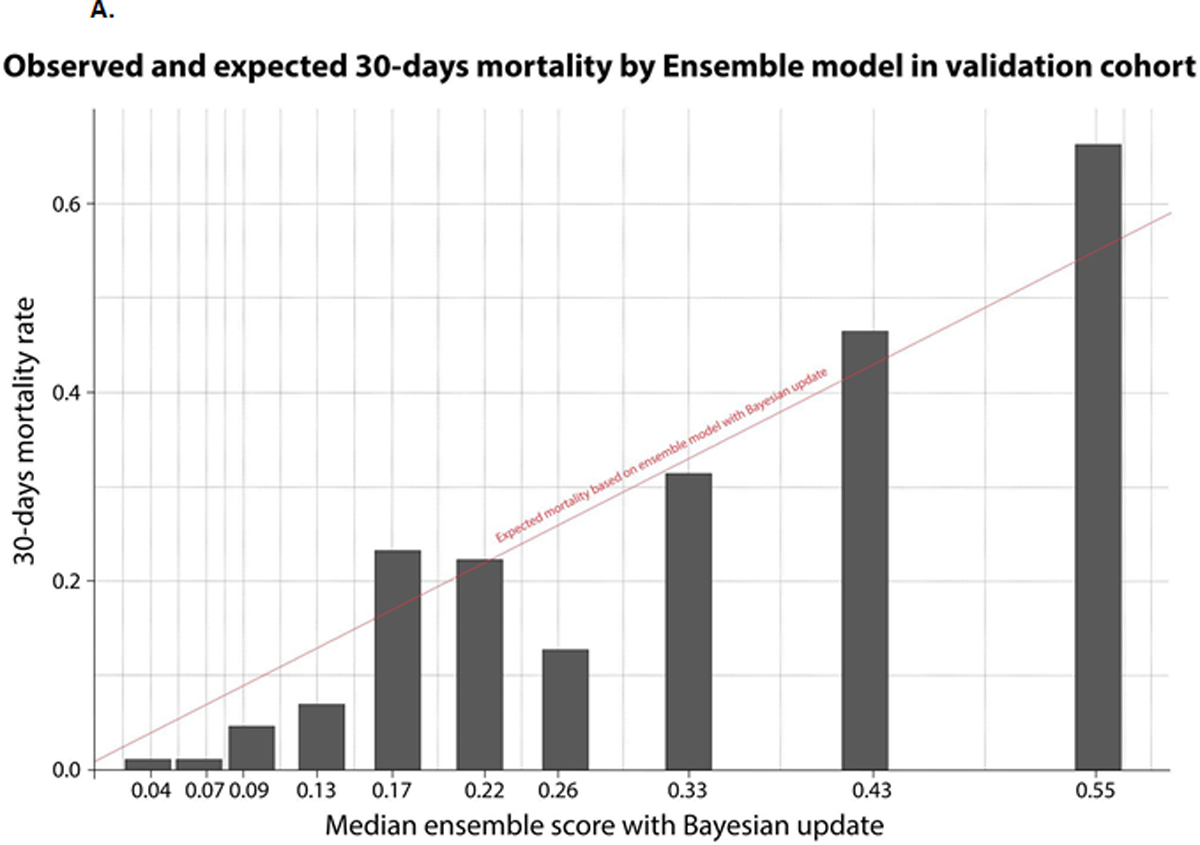
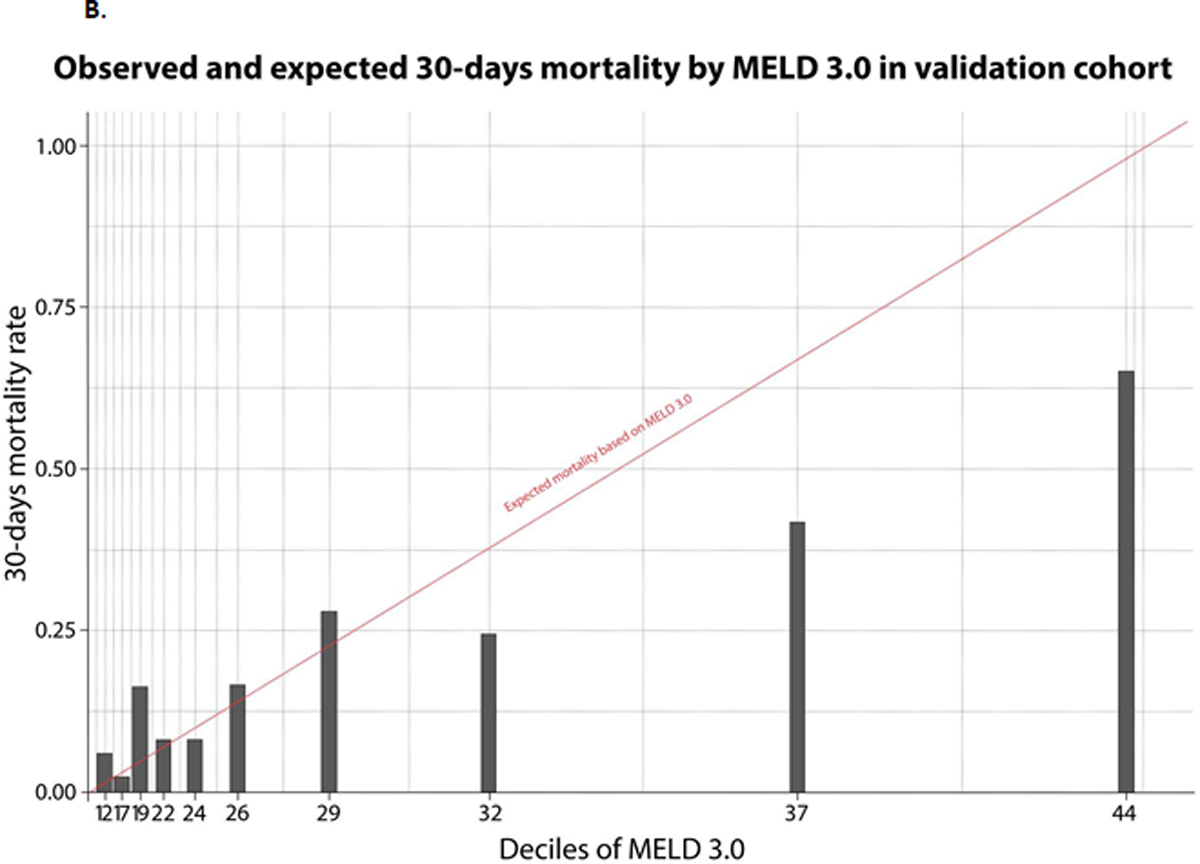
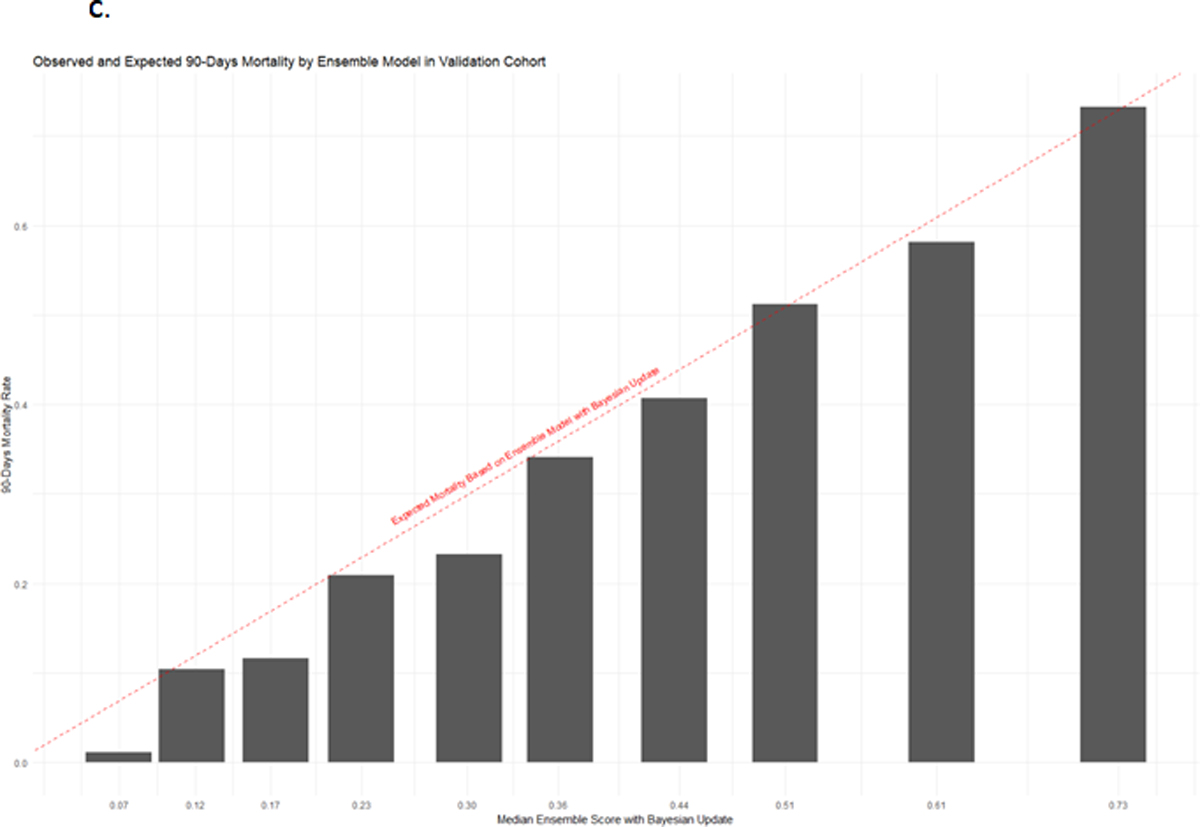
Approach and results: The Global AlcHep initiative, a retrospective study across 23 centers in 12 countries, enrolled patients with AH per National Institute for Alcohol Abuse and Alcoholism criteria. Centers were partitioned into derivation (11 centers, 860 patients) and validation cohorts (12 centers, 859 patients). Focusing on 30 and 90-day postadmission mortality, 3 artificial intelligence algorithms (Random Forest, Gradient Boosting Machines, and eXtreme Gradient Boosting) informed an ensemble model, subsequently refined through Bayesian updating, integrating the derivation cohort's average 90-day mortality with each center's approximate mortality rate to produce posttest probabilities. The ALCoholic Hepatitis Artificial INtelligence Ensemble score integrated age, gender, cirrhosis, and 9 laboratory values, with center-specific mortality rates. Mortality was 18.7% (30 d) and 27.9% (90 d) in the derivation cohort versus 21.7% and 32.5% in the validation cohort. Validation cohort 30 and 90-day AUCs were 0.811 (0.779-0.844) and 0.799 (0.769-0.830), significantly surpassing legacy models like Maddrey's Discriminant Function, Model for End-Stage Liver Disease variations, age-serum bilirubin-international normalized ratio-serum Creatinine score, Glasgow, and modified Glasgow Scores ( p < 0.001). ALCoholic Hepatitis Artificial INtelligence Ensemble score also showcased superior calibration against MELD and its variants. Steroid use improved 30-day survival for those with an ALCoholic Hepatitis Artificial INtelligence Ensemble score > 0.20 in both derivation and validation cohorts.

Conclusions: Harnessing artificial intelligence within a global consortium, we pioneered a scoring system excelling over traditional models for 30 and 90-day AH mortality predictions. Beneficial for clinical trials, steroid therapy, and transplant indications, it's accessible at: https://aihepatology.shinyapps.io/ALCHAIN/ .


Conflict of interest statement

Conflicts of Interest: Douglas A. Simonetto consults for BioVie, Evive, Mallinckrodt, and Resolution. Horia Stefanescu is on the speakers’ bureau and received grants from Echosens and General Electric. Joaquín Cabezas advises, is on the speakers’ bureau, and received grants from Gilead. He is on the speakers’ bureau and received grants from AbbVie. German Soriano received grants from Gore, Grifols, and Mendes. Fátima Higuera-de-la-Tijera is on the speakers’ bureau for Grünenthal. Lubomir Skladaný is on the speakers’ bureau and received grants from AbbVie, Gilead, and ProNed. He received grants from Alfasigma, Astellas, and Orphan. Victor Vargas consults for GENFIT. He advises Ipsen. He received grants from Intercept. Juan G. Abraldes consults for 89Bio, Advanz, AstraZeneca, Boehringer Ingelheim, Boston Pharmaceutical, and Novo Nordisk. He received grants from Cook and Gilead. Ramon Bataller consults for GlaxoSmithKline and Novo Nordisk. He is on the speakers’ bureau for AbbVie and Gilead. The remaining authors have no conflicts to report.

Figures

Figure 1A and B.
Figure 1A and B.. Comparing the 30- and 90-days ROC curves in the Validation Cohort, respectively.
The ROC curve of Ensemble and AUC compared to other previously published prognostic models in predicting 90-day mortality in the validation cohort. Abbreviations: mDF – Maddrey’s Discriminant Function, MELD – Model for End-Stage Liver Disease, ABIC – Age Bilirubin INR Creatinine Score for Alcoholic Hepatitis, GAHS – Glasgow Alcoholic Hepatitis Score, mGAHS – Modified Glasgow Alcoholic Hepatitis Score.
Figure 2.
Figure 2.. Comparison of Observed vs. Expected Mortality based on Different Models.
Scores are segregated into deciles with the X-axis representing the median of each decile. 2A: Observed and Expected 30-Days Mortality by Ensemble Model in Validation Cohort. The plot shows the 30-day observed mortality rate (bar graph) compared to the expected mortality based on the Ensemble Model with Bayesian Update (dashed red line). The Spiegelhalter’s Z-test score of –1.02 indicates an ideal calibration mortality. 2B: Observed and Expected 30-Days Mortality by MELD 3.0 in Validation Cohort. This graph depicts the 30-day observed mortality rate (bar graph) alongside its expected values based on MELD 3.0 (dashed red line). A Spiegelhalter’s Z-test score of –4.61 emphasizes the model’s overestimation. 2C: Observed and Expected 90-Days Mortality by Ensemble Model in Validation Cohort. The plot showcases the 90-day observed mortality rate (bar graph) vis-à-vis its predicted values based on the Ensemble Model with Bayesian Update (dashed red line). The Spiegelhalter’s Z-test score here is 2.25 indicating mild underestimation. 2D: Observed and Expected 90-Days Mortality by MELD 3.0 in Validation Cohort. Depicting the 90-day observed mortality (bar graph) in comparison to its predicted values based on MELD 3.0 (dashed red line), this graph’s Spiegelhalter’s Z-test score is 5.36, hinting at an underestimation. 2E: Observed and Expected 90-Days Mortality by traditional MELD in Validation Cohort. This representation focuses on the 90-day observed mortality rate (bar graph) juxtaposed with the expected values derived from the traditional MELD (dashed red line). A Spiegelhalter’s Z-test score of –3.76 emphasizes the model’s pronounced overestimation. In all figures, the red dashed line symbolizes expected mortality rates, and the bars represent observed mortality rates.
Figure 3.
Figure 3.
Influence of Corticosteroid Use on Projected Mortality. Figures 3A, B, and C display the importance rankings of variables within the Random Forest, GBM, and XGBoost models, respectively, with Corticosteroid Use ranked as the forth, second, and first most important variable. Figures 3D, and E illustrate the projected mortality difference attributable to steroid therapy in relation to Ensemble Score and MELD score. In the validation cohort, all patients were analyzed under two scenarios: with and without corticosteroid use. The difference in risk score between these scenarios represents the projected mortality difference, reflecting the change in Ensemble score if a patient not using corticosteroids were to use them. The median projected mortality difference was 3.5% (IQR 1.0% – 6.7%) in Ensemble score. Patients who actually had steroid therapy are marked with circles, while those who did not have steroid therapy are marked with crosses. Additionally, patients who survived beyond 30 days are indicated in blue, whereas those who died within or at 30 days are indicated in red. For every 0.1 unit increase in the ensemble score, there is an average decrease of 1.54% (SE 0.04%) in the projected mortality difference due to steroid therapy. Figure 3E further shows that for every 10 unit increase in the MELD, there is an average decrease of 2.8% (SE 0.1%) in the projected mortality difference due to steroid therapy. The most important factors influences the effect of steroid treatment include BUN (Figure 3F), Creatinine (Figure 3G), Bilirubin (Figure 3H) and INR (Figure 3I).

References

    1. Shirazi F, Singal AK, Wong RJ. Alcohol-associated Cirrhosis and Alcoholic Hepatitis Hospitalization Trends in the United States. J Clin Gastroenterol 2021;55:174–179. - PubMed
    1. Arab JP, Diaz LA, Baeza N, et al. Identification of optimal therapeutic window for steroid use in severe alcohol-associated hepatitis: A worldwide study. J Hepatol 2021;75:1026–1033. - PMC - PubMed
    1. Lee BP, Samur S, Dalgic OO, et al. Model to Calculate Harms and Benefits of Early vs Delayed Liver Transplantation for Patients With Alcohol-Associated Hepatitis. Gastroenterology 2019;157:472–480 e475. - PMC - PubMed
    1. Maddrey WC, Boitnott JK, Bedine MS, Weber FL Jr., Mezey E, White RI Jr. Corticosteroid therapy of alcoholic hepatitis. Gastroenterology 1978;75:193–199. - PubMed
    1. Dominguez M, Rincon D, Abraldes JG, et al. A new scoring system for prognostic stratification of patients with alcoholic hepatitis. Am J Gastroenterol 2008;103:2747–2756. - PubMed

Publication types

LinkOut - more resources