

A Spatio-temporal analysis of COVID-19 outbreak in Italy
- PMID: 38607811
- PMCID: PMC7753657
- DOI: 10.1111/rsp3.12376
A Spatio-temporal analysis of COVID-19 outbreak in Italy
Abstract
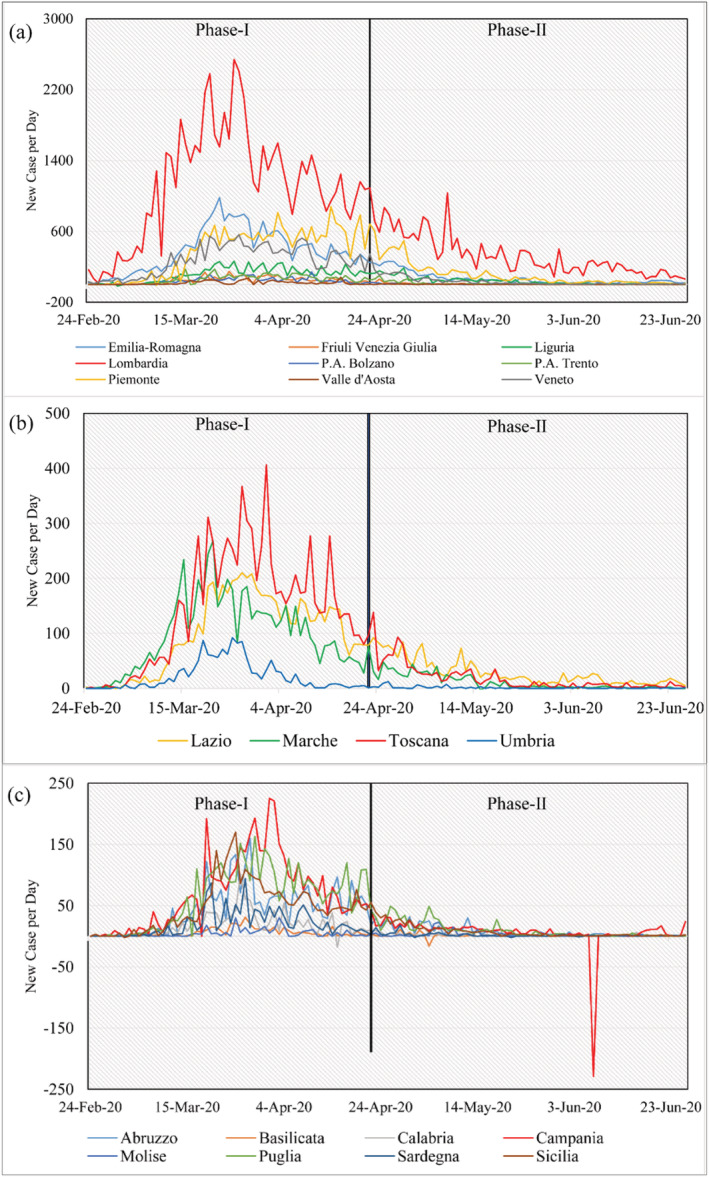
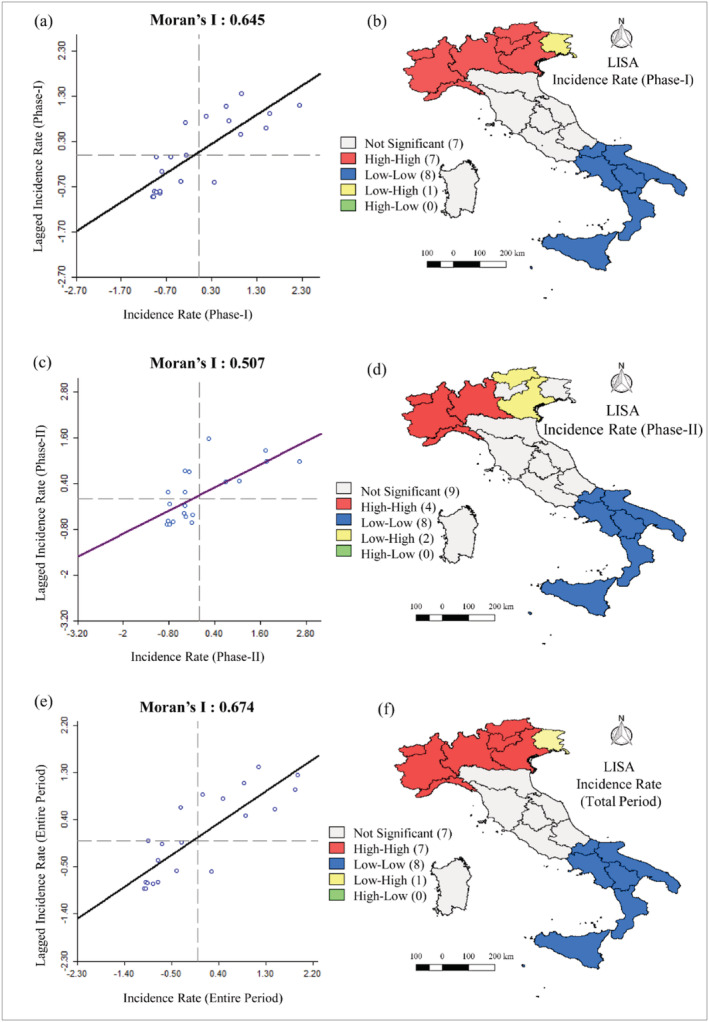
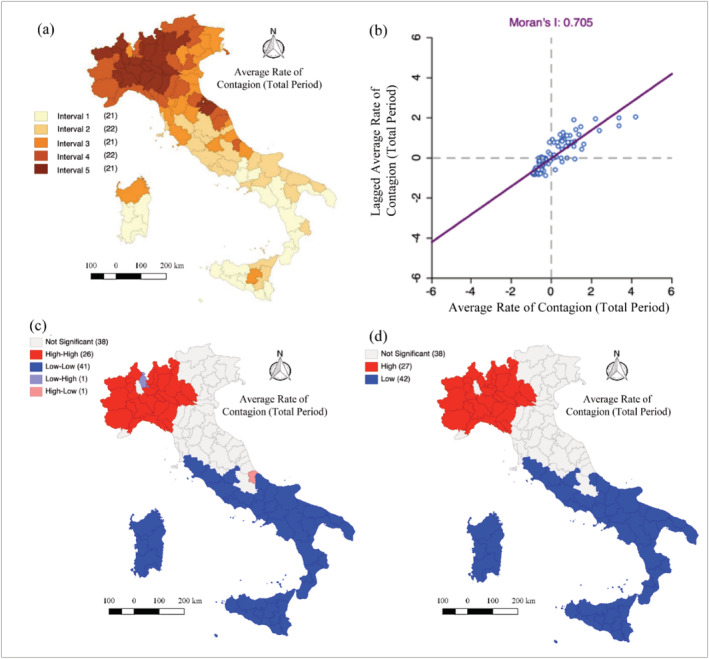
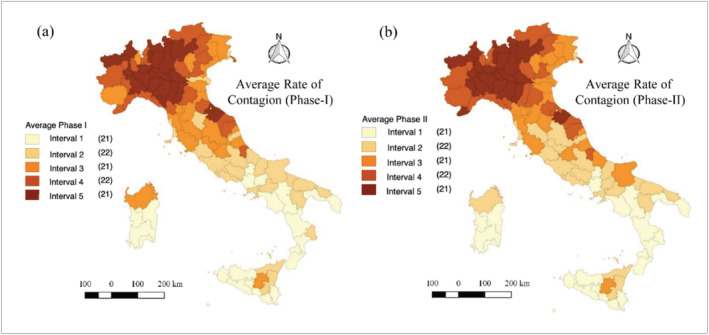
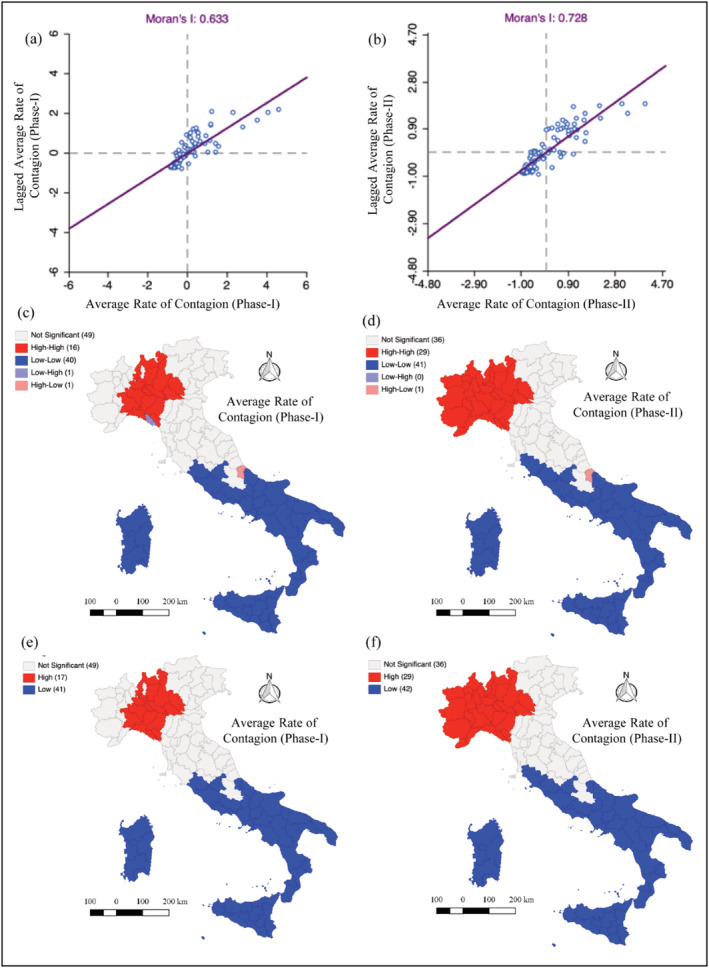
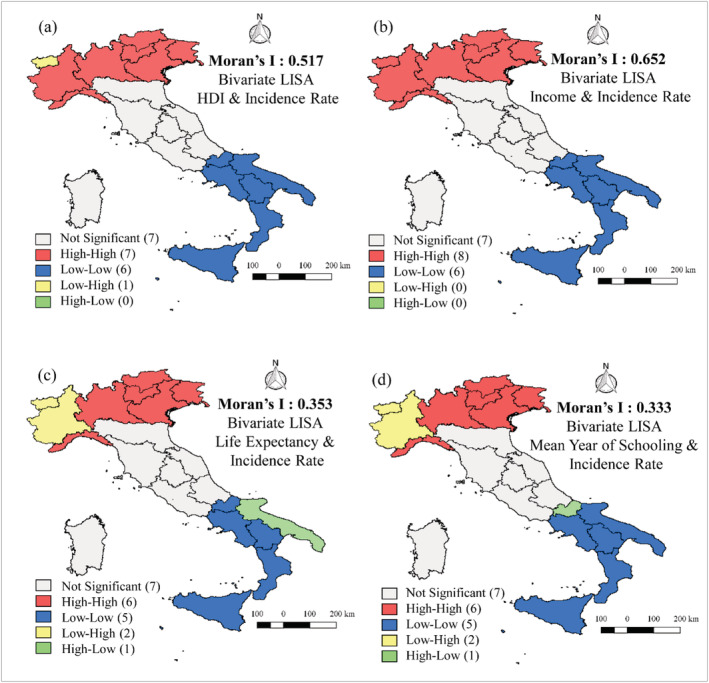
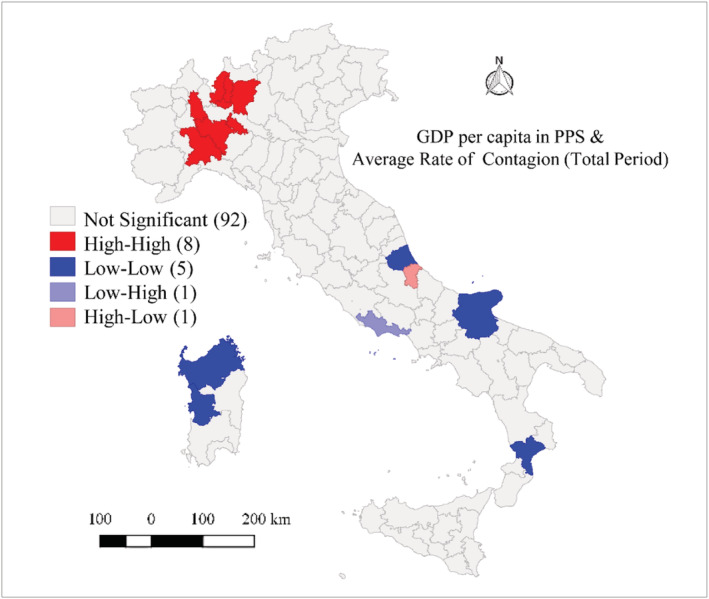
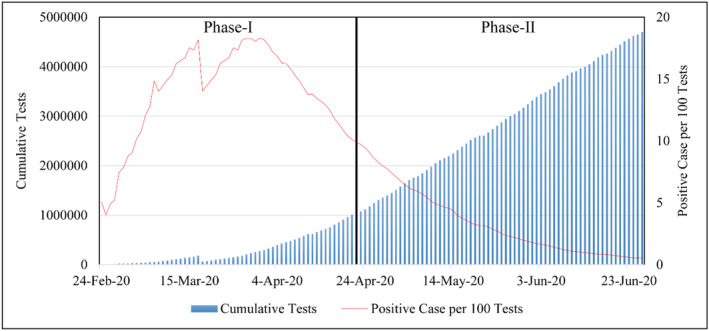
Within two weeks from the first detection of the SARS-CoV-2 positive patient on 21 February, from Lombardy the disease has spread over every region in Italy. The main objective of this study is to identify spatial effects and spatiotemporal patterns of the outbreak of COVID-19 in different regions of Italy. Spatial indicators for different periods, as Moran's I, local Moran, LISA clusters, Getis and Ord G, and scatterplots are used for this purpose. Results confirm the great presence of spatial effects as well as changes in spatial regimes between the quarantine and the easing phase. The evidence could be of help for policy-makers to a proper assessments of health strategies aware of local characteristics.
Keywords: Italian provinces; SARS‐CoV‐2; incidence rate; spatial effects; spatial statistics.
© 2020 The Authors. Regional Science Policy & Practice © 2020 Regional Science Association International.
Figures
Similar articles
-
Spatiotemporal clustering patterns and sociodemographic determinants of COVID-19 (SARS-CoV-2) infections in Helsinki, Finland.Spat Spatiotemporal Epidemiol. 2022 Jun;41:100493. doi: 10.1016/j.sste.2022.100493. Epub 2022 Feb 5. Spat Spatiotemporal Epidemiol. 2022. PMID: 35691637 Free PMC article.
-
Spatial statistical analysis of Coronavirus Disease 2019 (Covid-19) in China.Geospat Health. 2020 Jun 15;15(1). doi: 10.4081/gh.2020.867. Geospat Health. 2020. PMID: 32575956
-
Applying Spatio-temporal Scan Statistics and Spatial Autocorrelation Statistics to identify Covid-19 clusters in the world - A Vaccination Strategy?Spat Spatiotemporal Epidemiol. 2021 Nov;39:100461. doi: 10.1016/j.sste.2021.100461. Epub 2021 Oct 25. Spat Spatiotemporal Epidemiol. 2021. PMID: 34774258 Free PMC article.
-
Spatiotemporal analysis of the morbidity of global Omicron from November 2021 to February 2022.J Med Virol. 2022 Nov;94(11):5354-5362. doi: 10.1002/jmv.28013. Epub 2022 Jul 29. J Med Virol. 2022. PMID: 35864556 Free PMC article.
-
Exploring spatial autocorrelation of traffic crashes based on severity.Injury. 2017 Mar;48(3):637-647. doi: 10.1016/j.injury.2017.01.032. Epub 2017 Jan 19. Injury. 2017. PMID: 28126318 Review.
Cited by
-
The burden of big spaces: Russian regions and cities in the COVID-19 pandemic.Lett Spat Resour Sci. 2023;16(1):16. doi: 10.1007/s12076-023-00341-z. Epub 2023 Apr 12. Lett Spat Resour Sci. 2023. PMID: 37073269 Free PMC article. No abstract available.
-
Dynamic Patterns and Modeling of Early COVID-19 Transmission by Dynamic Mode Decomposition.Prev Chronic Dis. 2023 Oct 26;20:E95. doi: 10.5888/pcd20.230089. Prev Chronic Dis. 2023. PMID: 37884317 Free PMC article.
-
On the link between temperature and regional COVID-19 severity: Evidence from Italy.Reg Sci Policy Prac. 2021 Nov;13(Suppl 1):109-137. doi: 10.1111/rsp3.12472. Epub 2021 Oct 11. Reg Sci Policy Prac. 2021. PMID: 38607900 Free PMC article.
-
Spatial contagion during the first wave of the COVID-19 pandemic: Some lessons from the case of Madrid, Spain.Reg Sci Policy Prac. 2022 Mar 16:10.1111/rsp3.12522. doi: 10.1111/rsp3.12522. Online ahead of print. Reg Sci Policy Prac. 2022. PMID: 40479238 Free PMC article.
-
Spatial analysis of COVID-19 incidence and mortality rates in northwest iran for future epidemic preparedness.Sci Rep. 2025 Mar 3;15(1):7450. doi: 10.1038/s41598-025-91246-y. Sci Rep. 2025. PMID: 40032988 Free PMC article.
References
-
- Andreano, M. S. , Benedetti, R. , & Postiglione, P. (2017). Spatial regimes in regional European growth: An iterated spatially weighted regression approach. Quality and Quantity, 51(6), 2665–2684. 10.1007/s11135-016-0415-1 - DOI
-
- Anselin, L. (1988). Lagrange multiplier test diagnostics for spatial dependence and spatial heterogeneity. Geographical Analysis, 20, 1–17.
-
- Anselin, L. (1995). Local indicators of spatial association—LISA. Geographical Analysis, 27, 93–115.
-
- Anselin, L. (1996). The Moran scatterplot as an ESDA tool to assess local instability in spatial association. In Fischer M., Scholten H., & Unwin D. (Eds.), Spatial analytical perspectives on GIS in environmental and socio‐economic sciences (pp. 111–125). London: Taylor and Francis.
-
- Anselin, L. (2010). Thirty years of spatial econometrics. Papers in Regional Science, 89(1), 3–25. 10.1111/j.1435-5957.2010.00279.x - DOI
LinkOut - more resources
Full Text Sources
Miscellaneous