. 2022 Feb;55(Suppl 1):214-247.
doi: 10.1111/caje.12543. Epub 2022 Mar 24.

The short-term economic consequences of COVID-19: Occupation tasks and mental health in Canada

Affiliations

The short-term economic consequences of COVID-19: Occupation tasks and mental health in Canada

Louis-Philippe Beland et al. Can J Econ. 2022 Feb.

Abstract

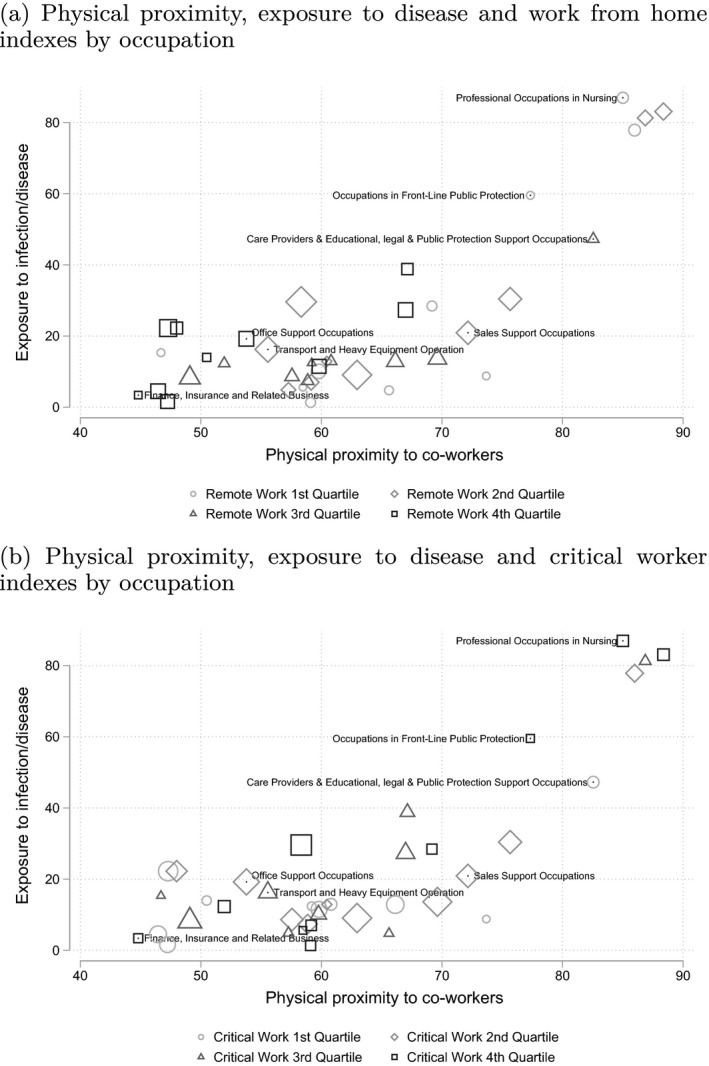
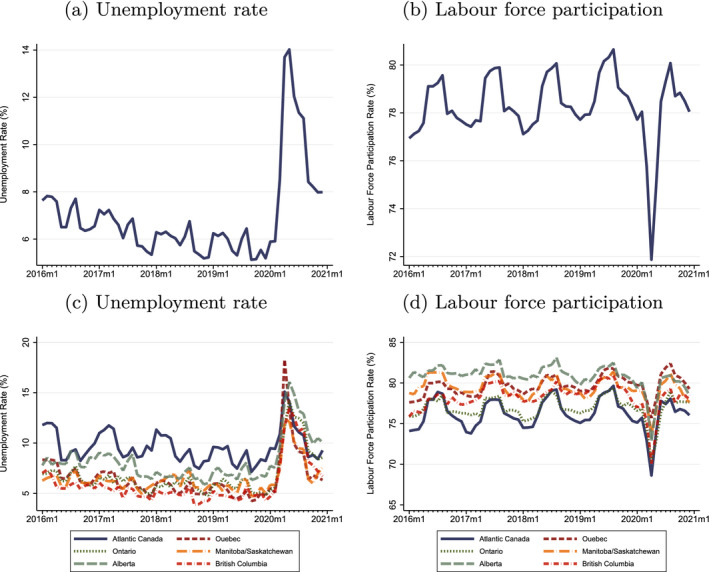
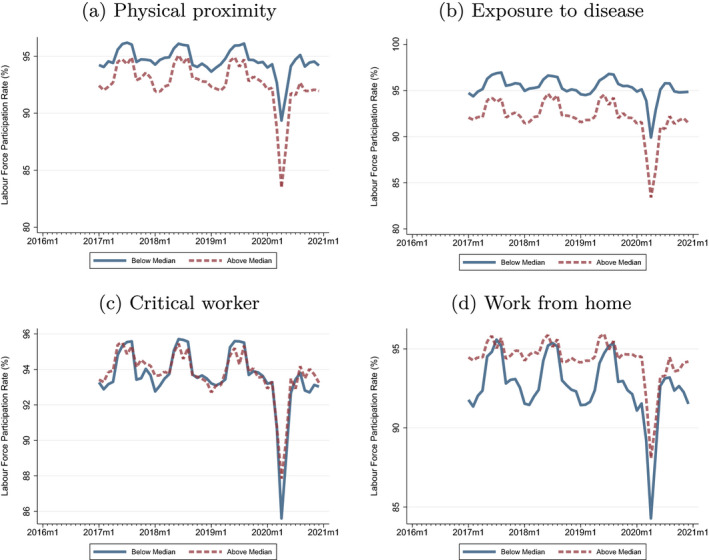
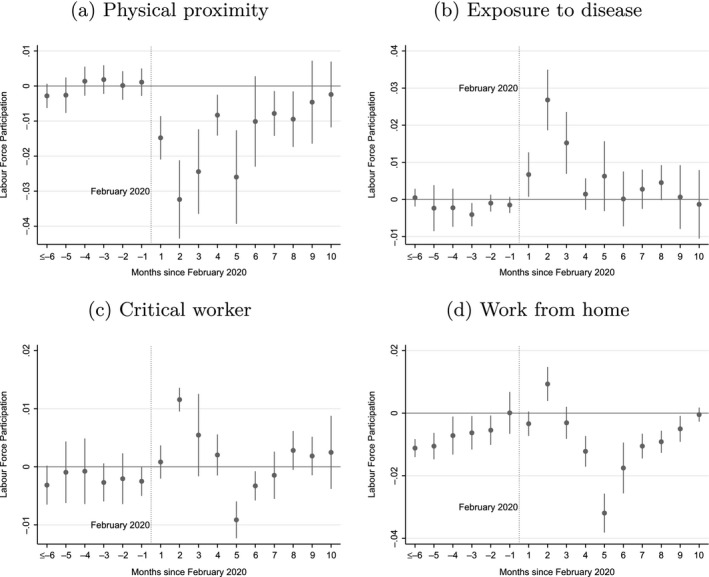
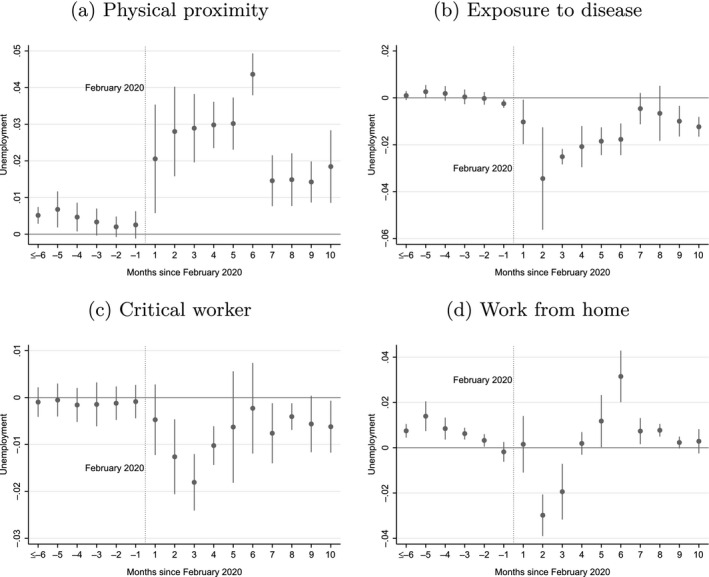
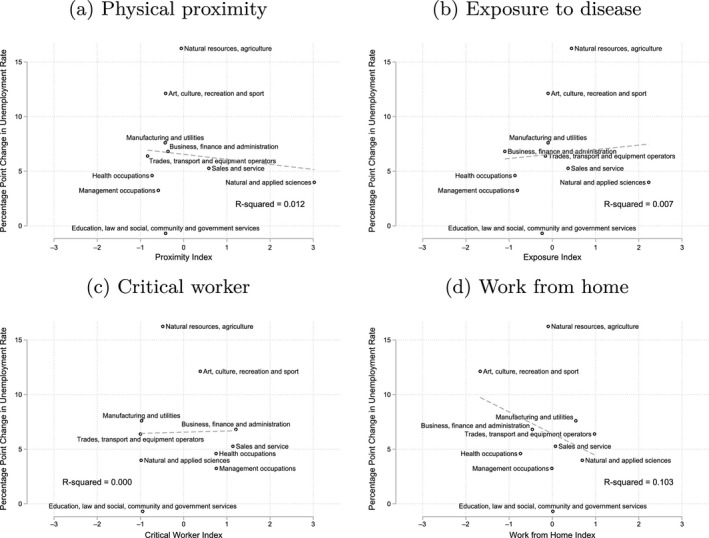
In this paper, we study the effect of COVID-19 on the labour market and reported mental health of Canadians. To better understand the effect of the pandemic on the labour market, we build indexes for whether workers: (i) are relatively more exposed to disease, (ii) work in proximity to co-workers, (iii) are essential workers and (iv) can easily work remotely. Our estimates suggest that the impact of COVID-19 was significantly more severe for workers that work in proximity to co-workers and those more exposed to disease who are not in the health sector, while the effects are less severe for essential workers and workers that can work remotely. Last, using the Canadian Perspective Survey Series, we observe that reported mental health is significantly lower among some of the most affected workers such as women and less-educated workers. We also document that those who were absent from work because of COVID-19 are more concerned with meeting their financial obligations and with losing their job than those who continue working outside their home.

Conséquences économiques de la COVID‐19 à court terme : tâches professionnelles et santé mentale au Canada. Dans cet article, nous étudions les répercussions de la COVID‐19 sur le marché de l'emploi et la santé mentale déclarée des Canadiens. Afin de mieux comprendre les effets de la pandémie sur le marché du travail, nous avons développé des indices permettant de déterminer si les travailleurs : 1) sont relativement plus exposés à la maladie; 2) exercent leur activité à proximité de leurs collègues; 3) sont essentiels; 4) peuvent facilement travailler à distance. D'après nos estimations, les conséquences de la COVID‐19 se sont avérées nettement plus sévères chez les travailleurs exerçant à proximité de leurs collègues ainsi que les professionnels (hors secteur médical) davantage exposés à la maladie, mais moins importantes chez les travailleurs essentiels et les télétravailleurs. Enfin, en nous appuyant sur l'une des enquêtes sur les perspectives canadiennes, nous observons que la santé mentale déclarée est nettement inférieure chez les travailleurs les plus touchés, notamment les femmes et les travailleurs moins instruits. Nous montrons également que les personnes écartées de leur travail en raison de la COVID‐19 se soucient davantage du respect de leurs obligations financières et de la perte de leur emploi par rapport à celles qui ont pu continuer à travailler hors de leur domicile.


Figures

FIGURE 1
FIGURE 1
Cases and deaths in largest four provinces, linear scale NOTES: Authors’ calculations. Data from Berry et al. (2020). From the start of the pandemic to December 31, 2020.
FIGURE 2
FIGURE 2
Physical proximity and exposure to disease indexes by NOC occupations NOTES: Each circle represents an occupation from the National Occupation Codes (2016). The size of each circle represents the number of LFS respondents employed in that occupation. The larger the shape, the greater the number of people employed in that occupation. Panels vary by index regarding the colour of the circle. In the top panel, the work from home index adopted from (Dingel and Neiman 2020) and applied to the LFS. The bottom panel adopts the critical worker index described by LMI Institute Index to the LFS. A detailed explanation can be found in our online appendix on indexes. The x‐axis plots each occupation's physical proximity to co‐workers, measured by O*NET's index. The further to the right, the closer in proximity employees in that occupation work with their co‐workers. The y‐axis plots each occupation's exposure to infection and disease, also measured by O*NET's index. The further upwards from 0, the more frequently employees in that occupation are exposed to infection and disease. The shape corresponds to the quartile of each occupation in the remote work index we constructed. Occupations in the first quartile are less commonly done from home, while those in the fourth quartile are more commonly done from home.
FIGURE 3
FIGURE 3
Unemployment rate and labour force participation for Canada and its regions NOTES: Authors’ calculations. Data from the Canadian Labour Force Survey with final weights applied to all subgraphs. The time period is January 2016 to December 2020. All individuals are aged 15–64. Panel (a) plots the unemployment rate for Canada. Panel (b) plots the labour force participation for Canada. Individuals in the labour force were employed at work, employed but absent from work or unemployed during the survey week. Panel (c) plots the unemployment rate for Canada's provinces and regions. Panel (d) plots the labour force participation for Canada's provinces and regions. Individuals in the labour force were employed at work, employed but absent from work or unemployed during the survey week.
FIGURE 4
FIGURE 4
Unemployment rate for all indexes by median value NOTES: Authors’ calculations. Data from the Canadian Labour Force Survey with final weights applied to all subgraphs. The time period is January 2017 to December 2020. All individuals are aged 15–64. All panels plot the unemployment rate. Each panel represents a different index and plots two lines that represent individuals who are above (below) the median index value. Panels (a), (b), (c) and (d) represent the indexes for physical proximity, exposure to disease, critical worker status and work from home status, respectively.
FIGURE 5
FIGURE 5
Labour force participation for all indexes by median value NOTES: Authors’ calculations. Data from the Canadian Labour Force Survey with final weights applied to all subgraphs. The time period is January 2017 to December 2020. All individuals are aged 15–64. All panels plot the labour force participation. Individuals in the labour force were employed at work, employed but absent from work or unemployed during the survey week. Each panel represents a different index and plots two lines that represent individuals who are above (below) the median index value. Panels (a), (b), (c) and (d) represent the indexes for physical proximity, exposure to disease, critical worker status and work from home status, respectively.
FIGURE 6
FIGURE 6
Event studies for labour force participation for each index NOTES: Authors’ calculations. Data from the Canadian Labour Force Survey with final weights applied to all subgraphs. The time period is January 2017 to December 2020. All panels plot the coefficient estimates for a single index from a linear specification that regresses labour force participation on various regressors that include all indexes, all indexes and their interactions with months, individual characteristics, highest educational attainment, province, year, month and year × province fixed effects. The dependent variable is a binary variable that equals 1 if an individual is in the labour force, and 0 otherwise. Individuals in the labour force were employed at work, employed but absent from work or unemployed during the survey week. Standard errors are clustered at the provincial level. Panels (a), (b), (c) and (d) represent the indexes for physical proximity, exposure to disease, critical worker status and work from home status, respectively.
FIGURE 7
FIGURE 7
Event studies for unemployment rate for each index NOTES: Authors’ calculations. Data from the Canadian Labour Force Survey with final weights applied to all subgraphs. The time period is January 2017 to December 2020. All panels plot the coefficient estimates for a single index from a linear specification that regresses unemployment on various regressors that include all indexes, all indexes and their interactions with months, individual characteristics, highest educational attainment, province, year, month and year × province fixed effects. The dependent variable is a binary variable that equals 1 if an individual is unemployed, and 0 otherwise. Standard errors are clustered at the provincial level. Panels (a), (b), (c) and (d) represent the indexes for physical proximity, exposure to disease, critical worker status and work from home status, respectively.
FIGURE 8
FIGURE 8
Percentage point change in unemployment (January 2020 to December 2020) by index and NOC broad categories NOTES: Authors’ calculations. Data from the Canadian Labour Force Survey with final weights applied to all subgraphs. All panels plot the unemployment rate. The x‐axis indicates the index value while the y‐axis indicates the change in unemployment rate from January 2020 to December 2020. Each dot represents an NOC broad category. Index values are normalized to a mean of 0 and a standard deviation of 1. Panels (a), (b), (c) and (d) represent the indexes for physical proximity, exposure to disease, critical worker status and work from home status, respectively.

Similar articles

Cited by

References

    1. Adams‐Prassl, A. , Boneva T., Golin M., and Rauh C. (2020) “Inequality in the impact of the coronavirus shock: Evidence from real time surveys,” Journal of Public Economics 189, 104245
    1. Alcaraz, K.I. , Eddens K. S., Blase J. L., Diver W. R., Patel A. V., Teras L. R., Stevens V. L., Jacobs E. J., and Gapstur S. M. (2019) “Social isolation and mortality in US black and white men and women,” American Journal of Epidemiology 188(1), 102–109 - PMC - PubMed
    1. Beland, L.‐P. , Brodeur A., Haddad J., and Mikola D. (2021) “Determinants of family stress and domestic violence: Lessons from the COVID‐19 outbreak,” Canadian Public Policy. 10.3138/cpp.2020-119 - DOI - PMC - PubMed
    1. Beland, L.‐P. , Brodeur A., and Wright T. (2020a) “The short‐term economic consequences of COVID‐19: Exposure to disease, remote work and government response,” IZA discussion paper no. 13159 - PMC - PubMed
    1. Beland, L.‐P. , Fakorede O., and Mikola D. (2020b) “The short‐term effect of COVID‐19 on self‐employed in Canada,” Canadian Public Policy 46(S1), S66–S81 - PMC - PubMed

LinkOut - more resources