. 2024 Apr 23;43(4):114047.
doi: 10.1016/j.celrep.2024.114047. Epub 2024 Apr 11.

LDHB contributes to the regulation of lactate levels and basal insulin secretion in human pancreatic β cells

Affiliations

LDHB contributes to the regulation of lactate levels and basal insulin secretion in human pancreatic β cells

Federica Cuozzo et al. Cell Rep. .

Abstract

Using 13C6 glucose labeling coupled to gas chromatography-mass spectrometry and 2D 1H-13C heteronuclear single quantum coherence NMR spectroscopy, we have obtained a comparative high-resolution map of glucose fate underpinning β cell function. In both mouse and human islets, the contribution of glucose to the tricarboxylic acid (TCA) cycle is similar. Pyruvate fueling of the TCA cycle is primarily mediated by the activity of pyruvate dehydrogenase, with lower flux through pyruvate carboxylase. While the conversion of pyruvate to lactate by lactate dehydrogenase (LDH) can be detected in islets of both species, lactate accumulation is 6-fold higher in human islets. Human islets express LDH, with low-moderate LDHA expression and β cell-specific LDHB expression. LDHB inhibition amplifies LDHA-dependent lactate generation in mouse and human β cells and increases basal insulin release. Lastly, cis-instrument Mendelian randomization shows that low LDHB expression levels correlate with elevated fasting insulin in humans. Thus, LDHB limits lactate generation in β cells to maintain appropriate insulin release.

Keywords: CP: Metabolism; GC-MS; LDH; NMR; glucose tracing; imaging; islet; lactate; metabolism; pyruvate; pyruvate dehydrogenase.


Conflict of interest statement

Declaration of interests G.A.R. has received grant funding from, and is a consultant for, Sun Pharmaceuticals Industries Ltd. D.J.H. receives licensing revenue from Celtarys Research for provision of chemical probes. D.J.H. has filed patents related to type 1 diabetes and type 2 diabetes therapy, unrelated to the present study.

Figures

Figure 1.
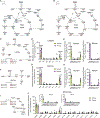
Figure 1.. MID analysis of glucose fate in human and mouse islets
(A) GC-MS and 1H-NMR-based 13C6 glucose tracing in primary islets. B) MID analysis of 13C6 glucose-tracing data. (C–E) MID analysis showing similar incorporation of 13C from 13C6 glucose into malate (C), alanine (D), and glutamate (E) in human and mouse islets. (F and G) MID analysis showing increased incorporation of 13C from 13C6 glucose into m + 2 and m + 3 aspartate (F), and m + 2 fumarate (G) in mouse compared to human islets. (H and I) Total amount of extracted aspartate (H) and alanine (I) is similar in human and mouse islets. (J–L) Total amount of extracted malate (J) and fumarate (K) is decreased in mouse relative to human islets, whereas glutamate (L) is increased. (M–O) MID analysis shows detectable glucose incorporation into m + 2 (TCA cycle) and m + 3 (pyruvate conversion) lactate, with more accumulation in human (M and N) versus mouse (M and O) islets (n = 18 independent replicates from nine human donors; n = 10 islet preparations from fifteen animals) (N and O show same data as M, but as separate graphs for clarity). (P) Total lactate generation is higher in human compared to mouse islets (n = 18 independent replicates from nine human donors; n = 10 islet preparations from fifteen animals). (C–G and M) Analyzed using two-way ANOVA and Sidak’s post hoc test. (H–L and P) Analyzed using Welch’s test. Bar graphs show individual datapoints and mean ± SEM. ns, non-significant; *p < 0.05; **p < 0.01; ***p < 0.001; ****p < 0.0001. AU, arbitrary unit.
Figure 2.
Figure 2.. Incorporation of 13C from 13C6 glucose into TCA cycle metabolites through PDH and PC
(A) White and blue circles, respectively, show the incorporation of 12C and 13C into TCA cycle metabolites arising from metabolism of pyruvate by PC. (B) White and red circles, respectively, represent 12C and 13C atoms as incorporated from 13C6 glucose into the TCA cycle through the conversion of pyruvate to acetyl-CoA by PDH. (C–E) Lactate000, lactate111, and lactate110 are the most abundant isotopomers (C) in both humans and mice (D), although the incorporation of 13C from 13C6 glucose into lactate111 is significantly higher in human than mouse islets (D and E) (E shows same data as D, but as separate graphs for clarity). (F–H) 13C incorporation into alanine isotopomers (F) is similar in human and mouse islets (G), with alanine111 being the most represented labeled isotopomer (G and H) (H shows same data as G, but as separate graphs for clarity). (I and J) The distribution of labeling patterns for glutamate (I) are similar in human and mouse islets (J), with glutamate00011 being the most abundant labeled isotopomer in both species (J) (inset shows same data as in J, but as separate graphs for human and mouse). For all data, n = 16–17 islet preparations, nine human donors, and n = 12–15 islet preparations, seven or eight animals. Data were analyzed using two-way ANOVA and Sidak’s post hoc test. Bar graphs show individual datapoints and mean ± SEM. ns, non-significant; ****p < 0.0001.
Figure 3.
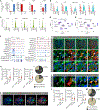
Figure 3.. Human β cells specifically express LDHB
(A) Normalized mRNA levels (transcripts per million [TPM]) for INS, GCG, LDHA, and LDHB genes in a and β cells (re-analysis of data from Arda et al.). (B and C) Normalized LDHA (B) and LDHB (C) expression in α, β, δ, and γ cells from human islet scRNA-seq experiments (n = 5 datasets).,– (D and E) Uniform manifold approximation projection (UMAP) plots showing LDHA (D) and LDHB (E) raw counts clustered according to cell type (n = 18 donors).,, (F) Genome browser snapshot of transcription factor binding, histone modification (chromatin immunoprecipitation sequencing [ChIP-seq], targets as indicated), and RNA-seq for LDHA and LDHB. (G) LDHB protein expression strongly co-localizes with insulin (INS) expression in human pancreas sections. Zoom-in (middle panel) shows absence of LDHB in glucagon (GCG)+ cells. Zoom-in (bottom panel) shows a small subpopulation of GCG+ cells with detectable LDHB staining. (H) Quantification of LDHB expression in GCG+ and INS+ cells in human pancreas sections, including sub-analysis of GCG+ segregated by high (Hi) and low (Lo) LDHB levels (>8 × 10⁴ CTCF) (n = 150 cells, three donors) (Mann-Whitney test). (I) Pie charts showing the proportions of GCG+ and INS+ cells that express Hi or Lo LDHB in human pancreas sections (n = 150 cells, three donors). (J) Representative images (zoom in from G) showing LDHB Hi and Lo cells for GCG and INS. (K) As for (G), but showing that LDHB protein expression remains co-localized with INS in isolated human islets. (L and M) As for (H) and (I), but in isolated human islets (n = 180 cells, three donors) (Mann-Whitney test). Scale bars, 30 μm. Violin plots show median and interquartile range. Scales in (B) and (C) represent reads per kilobase per million mapped reads (RPKM). ns, non-significant; ****p < 0.0001.
Figure 4.
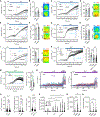
Figure 4.. Effects of LDHB inhibition on lactate levels and function in human β cells
(A–F) Traces (A, C, and E) and bar graph and representative images (B, D, and F) showing that glucose-stimulated lactate generation is amplified by 10 μM AXKO-0046 (LDHB inhibitor) in islets from three separate donors (donor 1, n = 10–15 islets; donor 2, n = 10–14 islets; donor 3, n = 10–12 islets) (unpaired t test). (G and H) AXKO-0046 amplifies glucose-stimulated lactate generation in mouse β cells, as shown by mean traces (G) and summary bar graph and representative image (H) (n = 21–28 islets, three animals) (unpaired t test). (I and J) 10 μM galloflavin (LDHA + LDHB inhibitor) decreases glucose-stimulated lactate generation in human β cells, as shown by mean traces (I) and summary bar graph and representative image (J) (n = 23–27 islets, three donors) (unpaired t test). (K and L) AXKO-0046 does not increase glucose-stimulated lactate generation in the presence of galloflavin in mouse β cells, as shown by mean traces (K) and summary bar graph (L) (n = 29–38 islets, three animals) (one-way ANOVA, Sidak’s post hoc test). (M) AXKO-0046 does not significantly influence glucose-stimulated ATP/ADP ratios in human β cells (n = 19–23 islets, three donors) (unpaired t test). (N and O) Traces (N) and violin plots (O) showing that AXKO-0046 has a small but significant effect on glucose- and KCl-stimulated Ca2+ levels in human β cells (n = 101–118 cells, three donors) (Mann-Whitney test). (P) AXKO-0046 and galloflavin do not significantly influence glucose- or Ex4-stimulated insulin secretion (n = 18 repeats, three donors) (two-way repeated measures ANOVA, Tukey’s post hoc test). (Q) Same data as in (P) G3 but, for the sake of clarity, separate analysis showing that AXKO-0046, and not galloflavin, significantly increases basal insulin secretion (one-way ANOVA, Sidak’s post hoc test). (R) Insulin content is similar between all states examined (Kruskal-Wallis test, Dunn’s post hoc test). Traces show mean ± SEM. Bar graphs show individual datapoints and mean ± SEM. Violin plots show individual datapoints and median. Scale bars, 83 μm. Arrows and box show AUC calculation boundaries. ns, non-significant; *p < 0.05; **p < 0.01; ***p < 0.001; ****p < 0.0001. Veh, vehicle; AXKO, AXKO-0046; Gallo, galloflavin, G3, 3 mM glucose; G17, 17 mM glucose; Ex4, exendin4.

References

    1. De Vos A, Heimberg H, Quartier E, Huypens P, Bouwens L, Pipeleers D, and Schuit F (1995). Human and rat beta cells differ in glucose transporter but not in glucokinase gene expression. J. Clin. Invest. 96, 2489–2495. 10.1172/jci118308. - DOI - PMC - PubMed
    1. Thorens B, Sarkar HK, Kaback HR, and Lodish HF (1988). Cloning and functional expression in bacteria of a novel glucose transporter present in liver, intestine, kidney, and beta-pancreatic islet cells. Cell 55, 281–290. 10.1016/0092-8674(88)90051-7. - DOI - PubMed
    1. Rorsman P, and Ashcroft FM (2018). Pancreatic beta-Cell Electrical Activity and Insulin Secretion: Of Mice and Men. Physiol. Rev. 98, 117–214. 10.1152/physrev.00008.2017. - DOI - PMC - PubMed
    1. Rutter GA, Pullen TJ, Hodson DJ, and Martinez-Sanchez A (2015). Pancreatic beta-cell identity, glucose sensing and the control of insulin secretion. Biochem. J. 466, 203–218. 10.1042/BJ20141384. - DOI - PubMed
    1. Henquin JC (2000). Triggering and amplifying pathways of regulation of insulin secretion by glucose. Diabetes 49, 1751–1760. - PubMed

Publication types

LinkOut - more resources