. 2024 Apr 23;43(4):114076.
doi: 10.1016/j.celrep.2024.114076. Epub 2024 Apr 10.

SARS-CoV-2 variant of concern fitness and adaptation in primary human airway epithelia

Affiliations

SARS-CoV-2 variant of concern fitness and adaptation in primary human airway epithelia

Rita M Meganck et al. Cell Rep. .

Abstract

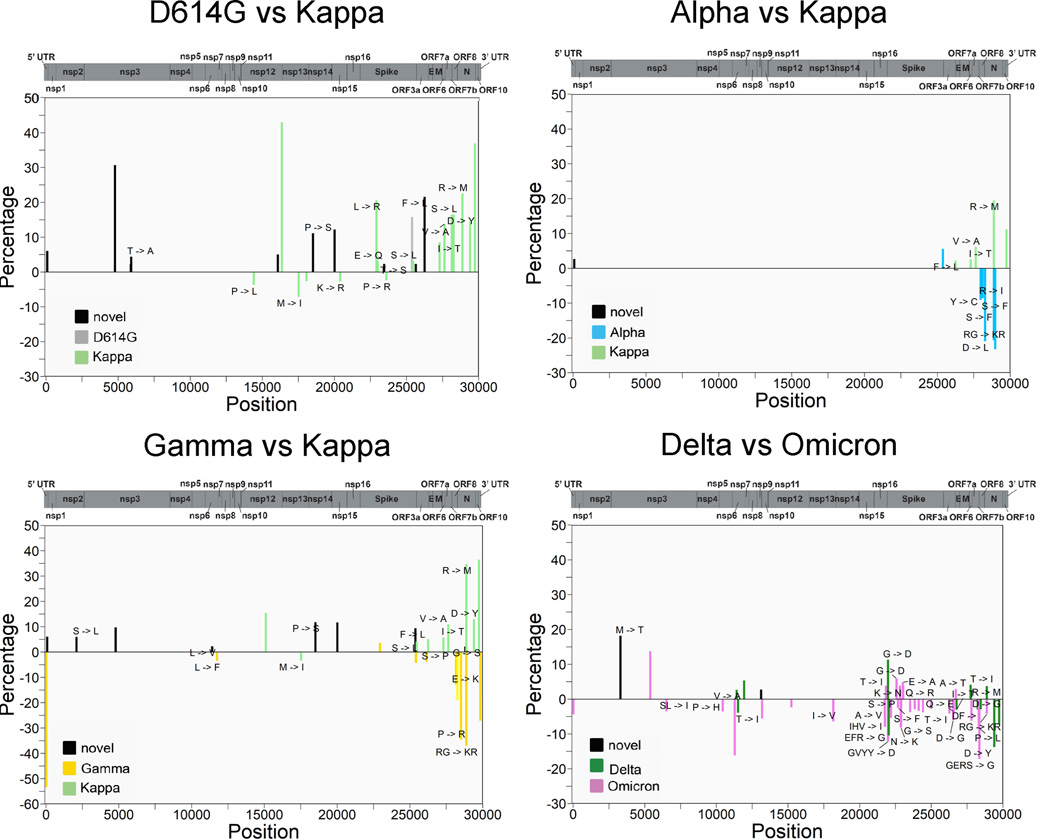
The severe acute respiratory syndrome coronavirus 2 pandemic is characterized by the emergence of novel variants of concern (VOCs) that replace ancestral strains. Here, we dissect the complex selective pressures by evaluating variant fitness and adaptation in human respiratory tissues. We evaluate viral properties and host responses to reconstruct forces behind D614G through Omicron (BA.1) emergence. We observe differential replication in airway epithelia, differences in cellular tropism, and virus-induced cytotoxicity. D614G accumulates the most mutations after infection, supporting zoonosis and adaptation to the human airway. We perform head-to-head competitions and observe the highest fitness for Gamma and Delta. Under these conditions, RNA recombination favors variants encoding the B.1.617.1 lineage 3' end. Based on viral growth kinetics, Alpha, Gamma, and Delta exhibit increased fitness compared to D614G. In contrast, the global success of Omicron likely derives from increased transmission and antigenic variation. Our data provide molecular evidence to support epidemiological observations of VOC emergence.

Keywords: CP: Microbiology; SARS-CoV-2; adaptation; cellular tropism; competition; coronavirus; primary airway culture; recombination; single cell RNA-seq; variants of concern; viral fitness.


Conflict of interest statement

Declaration of interests R.S.B. is a member of advisory boards for VaxArt, Takeda, and Invivyd; has consulted for Gilead; and has collaborative projects with Gilead, J&J, and Hillevax focused on unrelated projects.

Figures

Figure 1:
Figure 1:
Growth kinetics and morphology of SARS-CoV-2 variants in primary airway cultures. A) Growth curve of the indicated SARS-CoV-2 variants on primary human nasal epithelia (HNE) cells (MOI=0.1; n=3 patient codes). Data are plotted as mean +/− SEM. B) Growth curve of the indicated SARS-CoV-2 variants on primary human large airway epithelia (LAE) cells (MOI=0.1; n=3–4 patient codes). Data are plotted as mean +/− SEM. C) Growth curve of the indicated SARS-CoV-2 variants on primary human small airway epithelia (SAE) cells (MOI=0.01; n=3–4 patient codes). Data are plotted as mean +/− SEM. A 2-way ANOVA with repeated measures and multiple comparisons, in comparison to D614G, was used for statistical analysis. * = p <0.05. D) Growth curve of the indicated SARS-CoV-2 variants on primary human AT2 alveolosphere organoids (n=2 patient codes). Data are plotted as mean +/− SEM. A 2-way ANOVA with repeated measures and multiple comparisons, in comparison to D614G, was used for statistical analysis. * = p <0.05. E) Growth curve of the indicated SARS-CoV-2 variants on A549-hACE2 cells (n=3). Data are plotted as mean +/− SEM. A 2-way ANOVA with repeated measures and multiple comparisons, in comparison to D614G, was used for statistical analysis. * = p <0.05. F) RNAScope was performed on LAE/SAE cultures harvested at 96 hpi after the above-described growth curves (n=3–4 patient codes) with the indicated SARS-CoV-2 variants. FOXJ1 is a marker of ciliated cells, and SCGB1A1 is a marker of secretory cells. G) Whole mount cultures at 96 hpi after the above described growth curves (n=3–4 patient codes) were stained for viral antigen. The percent area with viral staining, quantified by whole membrane scan, is shown for LAE (left) and SAE (right) cells. Individual data points are shown, with each color representing a different donor code. Data are plotted as mean +/− SD. Student’s t-test was used for statistical analysis, in comparison to D614G. * = p <0.05. H) Whole mount cultures at 96 hpi were stained for viral antigen (green), α-tubulin (white), CCSP (red), and nuclei (blue). α-tubulin is a marker of ciliated cells, and CCSP is a marker of secretory cells. Arrow: α-tubulin+ ciliated cells; *: α -tubulin+/CCSP+ cells; #: CCSP+ squamous cells; ^: α -tubulin/CCSP cells. Scale bar = 25μm. I) Scanning electron microscopy (SEM, left) and transmission electron microscopy (TEM, right) of LAE cells at 72 hpi with the indicated SARS-CoV-2 variants. White arrow: syncytia formation on megacells. Yellow arrow: extracellular vesicles. Red arrow: empty vesicles. See also Supplemental Figure 1 and 2.
Figure 2:
Figure 2:
Host response to SARS-CoV-2 infection. A) Percent cytotoxicity as calculated by LDH release over the course of 96 hpi in both LAE (left; n=3–4 patient codes), SAE cells (center; n=3–4 patient codes), and HNE (right; n=3 patient codes) cells. Data are plotted as mean +/− SEM. A 2-way ANOVA with repeated measures and multiple comparisons, in comparison to D614G, was used for statistical analysis. * = p <0.05. B-F) scRNAseq was performed on primary human airway epithelial cells infected with either D614G, Delta, or Omicron (n=3–4 biological replicates from 2 patient codes). B-E represent combined data from all samples. B) UMAP plot showing the major cell type populations observed. C) Viral N gene expression overlaid on the UMAP plot. D) Dot plot of indicated viral and host gene expression in each cell-type cluster. E) Volcano plot of gene expression differences in infected ciliated cells compared to uninfected ciliated cells. Positive log-fold-change (right) denotes higher expression in infected cells, and negative log-fold-change (left) denotes lower expression in infected cells. Blue: ISGs; Red: viral genes; Purple: NFkB pathway genes; Green: cilia marker genes. F) Dot plot of indicated viral and ISG gene expression in each cell-type cluster and virus at 48 hpi. See also Supplemental Figure 2.
Figure 3:
Figure 3:
Mutational profile of SARS-CoV-2 variants after growth in primary human airway cells. Data are combined from experiments performed separately in LAE and SAE cells (n=3–4 patient codes). A) Boxplots of relative mutation load (RML) after 96 hpi of the indicated SARS-CoV-2 variants. Student’s t-test was used for statistical analysis, in comparison to D614G. * = p <0.05; ** = p< 0.005. B) Genome-wide mutational profile after 96hpi of the indicated SARS-CoV-2 variants. Mutations displayed are averages from n≥3 patient codes of both LAE and SAE cells. New mutations not present in the original viral stock are labeled as novel. Colored mutations indicate variants that were present in the original viral stock, and changed in frequency after 96 hpi. Coding changes are labeled on the plot. See also Supplemental Figure 3.
Figure 4:
Figure 4:
Head-to-head competition of SARS-CoV-2 variants in primary human airway cells. 1:1 MOI mixtures of the indicated SARS-CoV-2 variants were used to infect cultures (MOI=0.01; n=3–4 patient codes; combined from experiments performed separately in LAE and SAE cells). Day 0 inoculum and Day 5 apical washes were collected to analyze by ddPCR for relative variant frequencies. Data are averages of results from both LAE and SAE cells, plotted as mean +/− SD. Student’s t-test was used for statistical comparison of Day 0 and Day 5. * = p <0.05; ** = p< 0.005; *** = p<0.0005; **** = p < 0.00005. Key: Black (D614G), Blue (Alpha), Red (Beta), Yellow (Gamma), Light Green (Kappa), Dark Green (Delta), Pink (Omicron). See also Supplemental Figure 4.
Figure 5:
Figure 5:
Mutational profile of SARS-CoV-2 variants after competition in primary human airway cells. Genome-wide mutational profile at Day 5 with the indicated competitions (MOI=0.01; n=3–4 patient codes; combined from experiments performed separately in LAE and SAE cells). Mutations displayed are averages of results from both LAE and SAE cells. New mutations not present in the original viral stock are labeled as novel. Colored mutations indicate variants that were present in the original viral stock, and changed in frequency after 96 hpi. Coding changes are labeled on the plot. See also Supplemental Figure 5.

References

    1. Lu R, Zhao X, Li J, Niu P, Yang B, Wu H, Wang W, Song H, Huang B, Zhu N, et al. (2020). Genomic characterisation and epidemiology of 2019 novel coronavirus: implications for virus origins and receptor binding. Lancet 395, 565–574. 10.1016/S0140-6736(20)30251-8. - DOI - PMC - PubMed
    1. Sheahan TP, Sims AC, Zhou S, Graham RL, Pruijssers AJ, Agostini ML, Leist SR, Schafer A, Dinnon KH, Stevens LJ, et al. (2020). An orally bioavailable broad-spectrum antiviral inhibits SARS-CoV-2 in human airway epithelial cell cultures and multiple coronaviruses in mice. Sci Transl Med 12, 1–20. 10.1126/SCITRANSLMED.ABB5883. - DOI - PMC - PubMed
    1. Chen P, Nirula A, Heller B, Gottlieb RL, Boscia J, Morris J, Huhn G, Cardona J, Mocherla B, Stosor V, et al. (2020). SARS-CoV-2 Neutralizing Antibody LY-CoV555 in Outpatients with Covid-19. New England Journal of Medicine, 2020–2021. 10.1056/nejmoa2029849. - DOI - PMC - PubMed
    1. Weinreich DM, Sivapalasingam S, Norton T, Ali S, Gao H, Bhore R, Musser BJ, Soo Y, Rofail D, Im J, et al. (2020). REGN-COV2, a Neutralizing Antibody Cocktail, in Outpatients with Covid-19. New England Journal of Medicine. 10.1056/nejmoa2035002. - DOI - PMC - PubMed
    1. Rappazzo CG, Tse LV, Kaku CI, Wrapp D, Huang D, Deveau LM, Yockachonis TJ, Herbert AS, Battles MB, O CM, et al. (2021). Broad and potent activity against SARS-like viruses by an engineered human monoclonal antibody. Science (1979) 371, 823–829. - PMC - PubMed

Publication types

Supplementary concepts