. 2024 Apr 12;10(15):eadm8841.
doi: 10.1126/sciadv.adm8841. Epub 2024 Apr 12.

Spatially resolved immune exhaustion within the alloreactive microenvironment predicts liver transplant rejection

Affiliations

Spatially resolved immune exhaustion within the alloreactive microenvironment predicts liver transplant rejection

Arianna Barbetta et al. Sci Adv. .

Abstract

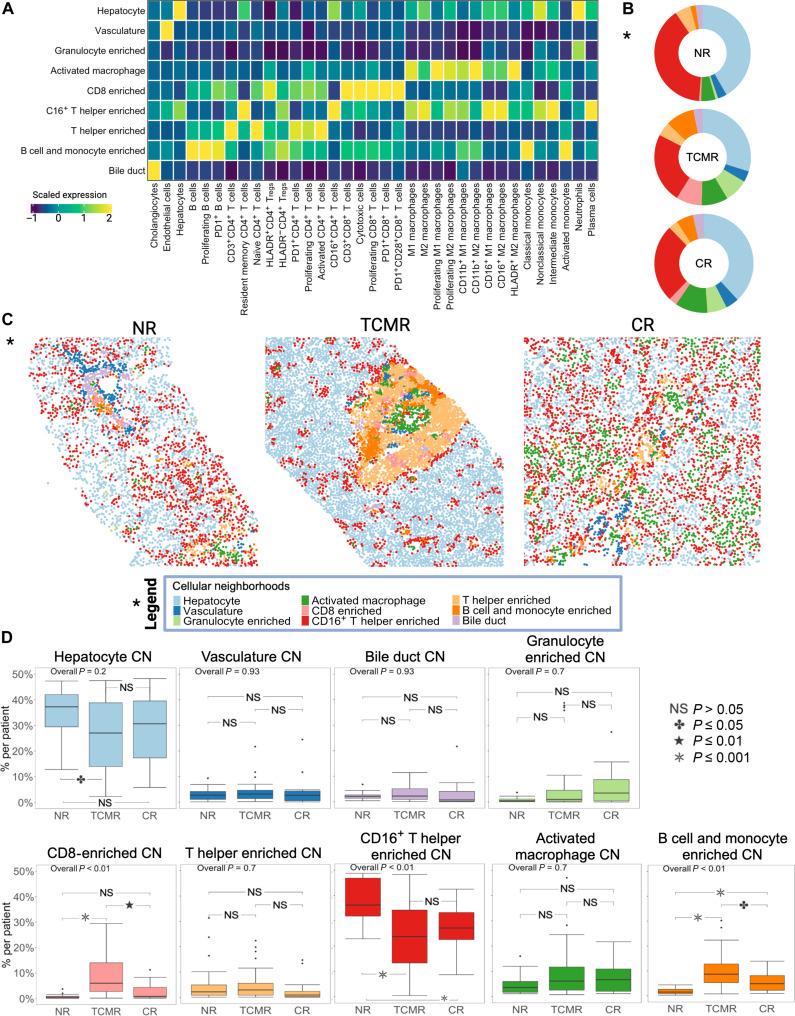
Allograft rejection is common following clinical organ transplantation, but defining specific immune subsets mediating alloimmunity has been elusive. Calcineurin inhibitor dose escalation, corticosteroids, and/or lymphocyte depleting antibodies have remained the primary options for treatment of clinical rejection episodes. Here, we developed a highly multiplexed imaging mass cytometry panel to study the immune response in archival biopsies from 79 liver transplant (LT) recipients with either no rejection (NR), acute T cell-mediated rejection (TCMR), or chronic rejection (CR). This approach generated a spatially resolved proteomic atlas of 461,816 cells (42 phenotypes) derived from 96 pathologist-selected regions of interest. Our analysis revealed that regulatory (HLADR+ Treg) and PD1+ T cell phenotypes (CD4+ and CD8+ subsets), combined with variations in M2 macrophage polarization, were a unique signature of active TCMR. These data provide insights into the alloimmune microenvironment in clinical LT, including identification of potential targets for focused immunotherapy during rejection episodes and suggestion of a substantial role for immune exhaustion in TCMR.


Figures

Fig. 1.
Fig. 1.. Single-cell proteomic atlas of the global cellular composition in liver allografts using IMC.
(A) Schematic figure of IMC workflow starting with case selection of biopsies including 96 specimens from 79 patients across clinical groups (NR, n = 24; T cell–mediated rejection, n = 41; and CR, n = 14). Tissue specimens were stained with our 22-marker IMC panel, and images were acquired. Images were preprocessed and segmented to generate masks and a single-cell expression matrix dataset. Downstream phenotypic analysis using a semi-supervised clustering approach and spatial analysis was performed on the dataset (461,816 cells). (B) Representative visualization of cell masks colored by cell population in non-immune and immune populations in TCMR. Scale bars, 190 μm. Cell population or metacluster colors from the legend are consistent throughout the figure. (C) Heatmap showing scaled marker expression within our 10 major metaclusters with purple bars with relative proportion of which clinical group contributed to the metacluster. Gray bars depict total cell number and percent composition of that population across the entire dataset. (D) t-SNE visualization showing cell metaclusters (excluding hepatocytes for ease of visualizing the less abundant metaclusters) by clinical group. (E) Boxplots representing the relative proportions of metaclusters across clinical groups with statistical comparison of each population as a proportion of that cell type per patient. TCMR and CR showed a greater proportion of immune cells compared to NR. Among the three clinical groups, different cell proportions were observed in CD4+ and CD8+ T cells, B cells, monocytes, and plasma cells compartments. UV, ultraviolet; m/z, mass/charge ratio; ROI, region of interest; NS, not significant.
Fig. 2.
Fig. 2.. Active TCMR is uniquely characterized by expansion of Treg and PD1+CD4+ T cells.
(A) Visualization of cell masks colored by metaclusters on representative TCMR tissue section. Scale bar, 180 μm. (B) Plot of the same TCMR tissue section with yellow coloring indicating location of CD4+ T cells within the representative core biopsy. Scale bar, 180 μm. (C) Zoom panel highlighting CD4+ T cells colored by cell subpopulation (see color key legend). Subpopulations were identified using unsupervised clustering within the CD4+ T cell metacluster, which comprised 24,864 cells, using expression values from markers CD28, CD16, CD11b, CD45, CD4, PD1, FoxP3, Ki67, CD3, and HLADR. Nine unique subpopulations emerged from this analysis: Resident memory CD4+ T cells, CD3+CD4+ T cells, activated (HLADRhi) CD4+ T cells, CD16+CD4+ T cells, naïve CD4+ T cells, HLADR+CD4+ Tregs, HLADRCD4+ Tregs, PD1+CD4+ T cells, and proliferating (Ki67+) CD4+ T cells. (D) tSNE visualizations showing CD4+ T cell subpopulations by clinical group. (E) Stacked bar plot representing cell subpopulation proportions within individual patients by clinical group. (F) Boxplots showing CD4+ cell subpopulation percent per patient as a fraction of the CD4+ T cell population. Resident memory CD4+ T cells represented the most abundant phenotype observed in NR (P < 0.01); CD3+CD4+ T cells were the predominant phenotype detected in both TCMR and CR groups (P < 0.01), which presented a greater proportion of activated CD4+ T cells for both versus NR (P < 0.01); TCMR showed a greater proportion of naïve CD4+ and PD1+ T cells (P = 0.03) as well as HLADR+ Tregs (P < 0.01) compared to NR. (G) Pseudotemporal trajectory analysis of the CD4+ compartment with uniform manifold approximation and projection (UMAP) of cell populations. The leftmost panel shows UMAP plot with cell subpopulations, and second panel shows the predicted temporal trajectory (black line, bottom to top). The rightmost panel depicts the density of CD4+ T cells (y axis) from each clinical group across pseudotime (x axis). PD1+CD4+ T cells and Tregs represent late-stage effector CD4+ populations specific to TCMR.
Fig. 3.
Fig. 3.. CD8+ T cell profile in active TCMR highlights simultaneous increases in cell proliferation and PD1+ subpopulations.
(A) Representative TCMR image with metaclusters projected onto the mask outline of core biopsy ROI. Scale bar, 190 μm. (B) TCMR mask image now highlighting CD8+ T cells only in orange. Scale bar, 190 μm. (C) Zoom panel of CD8+ T cells colored by cell subpopulation (see color key). Similar as with CD4+ T cells, the CD8+ compartment was categorized into subpopulations using unsupervised clustering with the following markers: CD28, CD16, CD11b, CD45, CD8, PD1, FoxP3, Ki67, CD3, HLADR, and Granzyme B. Five unique subpopulations were identified from the parent CD8+ population comprising 30,488 total cells: CD3+CD8+ T cells, proliferating (Ki67+) T cells, cytotoxic T cells, PD1+CD8+ T cells, and PD1+CD28+ T cells. (D) tSNE of CD8+ T cell subpopulations. (E) Stacked bar plot showing individual CD8+ T cell subpopulations by patient and clinical group. (F) Boxplots depicting CD8+ T cell subpopulations as a percent of total CD8+ T cell population and compared across clinical group. Different distribution in CD3+CD8+ T cells, proliferating, and PD1+CD8+ T cells subpopulation was observed across the three clinical groups, with a greater proportion of proliferating and PD1+CD8+ T cells in TCMR. (G) Leftmost panel with pseudotime UMAP plot of CD8+ T cell subpopulations and middle panel showing dual trajectory starting at the darker portion of the graph and moving to the lower left of the plot. Plot of density of CD8+ T cells (y axis) in each clinical group across pseudotime (x axis). Stimulation of CD3+CD8+ T cells results in the maturation of two distinct phenotypes represented by a proliferating CD8+ T cells and a distinct PD1+CD8+ T cell subpopulation.
Fig. 4.
Fig. 4.. Both active TCMR and CR are characterized by increased proportion of HLADR+ M2 macrophages with concurrent decreases in CD16+ M1 and M2 macrophages.
(A) Cell mask visualization on TCMR tissue section colored by metacluster. Scale bar, 190 μm. (B) TCMR tissue section again with cell mask outlines and colored blue to show location of the macrophage metacluster cells within the tissue. Scale bar, 190 μm. (C) Zoom panel of macrophage subpopulations (see color key legend). The macrophage metacluster was composed of 45,927 total cells within the entire dataset, and subpopulations were identified by first differentiating M1 (CD163Lo) from M2 (CD163hi) and then performing unsupervised clustering based on expression of CD16, CD11b, CD45, FoxP3, CD163, CD68, Ki67, and HLADR. Nine distinct subpopulations emerged from this analysis including generic M1 and M2 populations, proliferating (Ki67+) M1 macrophages, proliferating (Ki67+) M2 macrophages, CD11b+ M1 macrophages, CD11b+ M2 macrophages, CD16+ M1 macrophages, CD16+ M2 macrophages, and HLADR+ M2 macrophages. (D) tSNE plot of macrophage subpopulations separated by clinical group. (E) Stacked bar plot of individual macrophage subpopulations by patient and clinical group. (F) Boxplots showing macrophage subpopulations as a percent of the overall macrophage population per patient. A greater proportion of proliferating M1 macrophages was observed in TCMR compared to NR and CR; TCMR and NR had a greater proportion of CD16+ M1 macrophages compared to CR; NR showed a greater cell percentage of CD16+ M2 macrophages compared to TCMR and CR; HLADR+ M2 macrophages were more abundant in both TCMR and CR compared to NR.
Fig. 5.
Fig. 5.. Spatial relationship analysis between immune cell subsets across clinical groups shows increased interactions in exhaustion phenotype (Treg, PD1+, leukocytes) and proliferating cell types in active TCMR.
(A) Spatial correlation network visualization showing attractions (red line) and avoidances (blue line) across cell subpopulations and colored by the metacluster that the subpopulation is derived from. The line thickness represents the strength of the degree of attraction, or avoidance between the cell subpopulations and the size of the circle represents the size of the subpopulation. For ease of visualization, the CD11b+ monocyte/macrophage, PD1+, proliferating, and Treg populations are grouped in phenotype clusters (gray circle highlights). Lymphocytes exhibiting an exhausted phenotype (clusters number 17, 22, 23, and 39) showed a greater number of interactions in TCMR compared to NR and CR. (B to D) Heatmap showing pairwise spatial interaction between subclusters in NR (B), TCMR (C), and CR (D). (E) Plot of spatial distance of subcluster populations to endothelium.
Fig. 6.
Fig. 6.. Spatial profiling of liver allograft biopsies uncovers eight higher-order CN motifs that are differentially abundant across clinical groups, including a unique CD8-enriched CN containing exhaustion phenotype subsets that is strongly associated with active TCMR.
(A) Heatmap showing composition of CN clusters. From the 35 identified cell populations and subpopulations in our dataset, we obtained nine distinct CNs or spatial motifs that are found within our dataset which include: Hepatocyte, vasculature, granulocyte enriched, activated macrophages, CD8 enriched, CD16+ T helper enriched, T helper enriched, B cell and monocyte enriched, and bile duct. (B) Donut plots showing proportions of CNs by clinical group. TCMR has the largest proportion of CD8 enriched and B cell and monocyte enriched CNs. NR has the proportion of CD16+ T helper–enriched CN. (C) Visualization of CNs projected onto representative biopsy specimens from NR, TCMR, and CR. (D) Boxplots depicting the percent makeup of CNs compared between clinical groups. Difference in percentage distribution was reported for CD8 enriched, which presented a greater percentage in TCMR compared to NR and CR; CD16 T helper–enriched CN presented a higher percentage in NR compared to TCMR and CR, and no difference was observed between TCMR and NR; the percentage of B cell and monocytes enriched CN was higher in TCMR compared to NR and CR, while CR showed a greater proportion compared to NR.
Fig. 7.
Fig. 7.. In depth molecular characterization of tissue using bulk RNA-seq confirms the exhaustion signature associated with active TCMR.
(A) Sequential FFPE tissue sections obtained from a subgroup of most representative four NR and four TCMR FFPE of cellular compositions observed for each clinical group using IMC were analyzed using nCounter bulk RNA-seq. The heatmap visualizes the scaled expression of genes corresponding to generic T cells, T helper 1 (TH1), cytotoxic, and exhausted phenotypes in both NR and TCMR. Activated, cytotoxic, and exhausted T cell genes showed a greater expression in active TCMR when compared to NR. (B) Heatmap of scaled expression values of macrophage and NK-related genes including M1, M2a, M2b, and M2c phenotypes along with NK-associated genes. Genes belonging to both M1 and M2 polarized macrophages showed a greater expression in active TCMR than NR; similarly, NK-associated gene expression was higher in TCMR. (C) To confirm bulk RNA-seq data, TCMR sections were examined for PD1, PDL1, and PDL2 (left) protein expression using IMC. The middle and zoomed in panel on the right show cell mask outlines colored blue for PD1+CD4+ T cells, yellow for PD1+CD8+ T cells, red for PDL1+CD68+ macrophages, and green for PDL2+CD68+ macrophages. This visually confirms the presence of exhausted phenotype T cells and their interaction with macrophages expressing PDL1 and PDL2 ligands in active TCMR.
Fig. 8.
Fig. 8.. Identification of cellular features in liver allograft biopsies that are highly predictive for discriminating active TCMR from NR and CR.
(A) Bootstrapping using LASSO regression identified the top highly ranked features which are predictive of NR versus TCMR. (B) On the basis of the model, identified cell subpopulations well suited for distinguishing TCMR from NR include proliferating hepatocytes, PD1+CD4+ T cells, nonclassical monocytes, and HLADR+ M2 macrophages. Positive coefficient indicates that an increase of that cell subpopulation increases the likelihood of TCMR, while negative coefficient indicates that an increase of that cell subpopulation decreases the likelihood of TCMR, thus increasing the likelihood of NR. (C) Evaluation metrics for predictive model built using highly ranked cell subpopulations identified in A. The model shows a sensitivity of 0.89 ± 0.09, specificity of 0.88 ± 0.13, accuracy of 0.89 ± 0.07, and AUC of 0.96 ± 0.04 (means ± SD). Spearman correlation coefficient between median predicted and actual outcomes R = 0.77; P value = 7.206 × 10⁻¹⁰ (Wilcoxon rank-sum test). (D) Bootstrapping using LASSO regression model identified the top highly ranked features, which are predictive of TCMR versus CR. (E) On the basis of the model, identified subpopulations well suited for distinguishing TCMR from CR include proliferating M1 macrophages, proliferating CD8+ T cells, plasma cells, PD1+CD8+ T cells, cholangiocytes, CD3+CD4+ T cells, CD16+ M1 macrophages, and CD16+CD4+ T cells. Positive coefficient indicates that an increase of that cell subpopulation increases the likelihood of CR, while negative coefficient indicates that an increase of that cell subpopulation decreases the likelihood of CR, thus increasing the likelihood of TCMR. (F) Evaluation metrics for predictive model built using highly ranked cell subpopulations identified in (D). The model shows a sensitivity of 0.93 ± 0.13, specificity of 0.92 ± 0.08, accuracy of 0.92 ± 0.07, and AUC of 0.96 ± 0.06 (means ± SD). Spearman correlation coefficient between median predicted and actual outcomes R = 0.82; P value = 1.7827 × 10⁻⁹ (Wilcoxon rank-sum test). ROC, receiver operating characteristic.

Update of

References

    1. Shaked A., Ghobrial R. M., Merion R. M., Shearon T. H., Emond J. C., Fair J. H., Fisher R. A., Kulik L. M., Pruett T. L., Terrault N. A., A2ALL Study Group , Incidence and severity of acute cellular rejection in recipients undergoing adult living donor or deceased donor liver transplantation. Am. J. Transplant. 9, 301–308 (2009). - PMC - PubMed
    1. Bartlett A. S., Ramadas R., Furness S., Gane E., McCall J. L., The natural history of acute histologic rejection without biochemical graft dysfunction in orthotopic liver transplantation: A systematic review. Liver Transpl. 8, 1147–1153 (2002). - PubMed
    1. Levitsky J., Goldberg D., Smith A. R., Mansfield S. A., Gillespie B. W., Merion R. M., Lok A. S. F., Levy G., Kulik L., Abecassis M., Shaked A., Acute rejection increases risk of graft failure and death in recent liver transplant recipients. Clin. Gastroenterol. Hepatol. 15, 584–593.e2 (2017). - PMC - PubMed
    1. Haddad E. M., McAlister V. C., Renouf E., Malthaner R., Kjaer M. S., Gluud L. L., Cyclosporin versus tacrolimus for liver transplanted patients. Cochrane Database Syst. Rev. 2006, CD005161 (2006). - PMC - PubMed
    1. Demetris A. J., Batts K. P., Dhillon A. P., Ferrell L., Fung J., Geller S. A., Hart J., Hayry P., Hofmann W. J., Hubscher S., Kemnitz J., Koukoulis G., Lee R. G., Lewin K. J., Ludwig J., Markin R. S., Petrovic L. M., Phillips M. J., Portmann B., Rakela J., Randhawa P., Reinholt F. P., Reyne’s M., Reyne’s R., Robert M., Schlitt H., Solez K., Snover D., Taskinen E., Thung S. N., Tillery G. W., Wiesner R. H., Wight D. G. D., Williams J. W., Yamabe H., Banff Schema for grading liver allograft rejection: An international consensus document. Hepatology 23, 658–663 (1997). - PubMed

Publication types