. 2024 May;23(5):100762.
doi: 10.1016/j.mcpro.2024.100762. Epub 2024 Apr 11.

TIMAHAC: Streamlined Tandem IMAC-HILIC Workflow for Simultaneous and High-Throughput Plant Phosphoproteomics and N-glycoproteomics

Affiliations

TIMAHAC: Streamlined Tandem IMAC-HILIC Workflow for Simultaneous and High-Throughput Plant Phosphoproteomics and N-glycoproteomics

Chin-Wen Chen et al. Mol Cell Proteomics. 2024 May.

Abstract

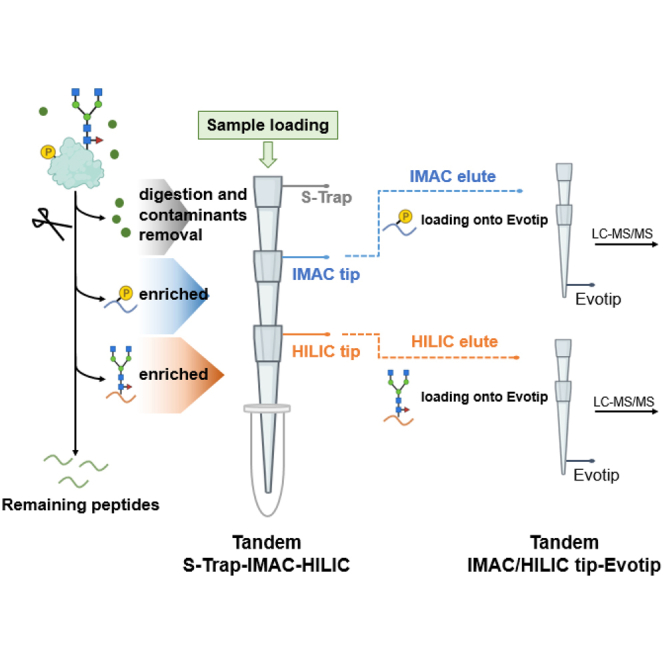
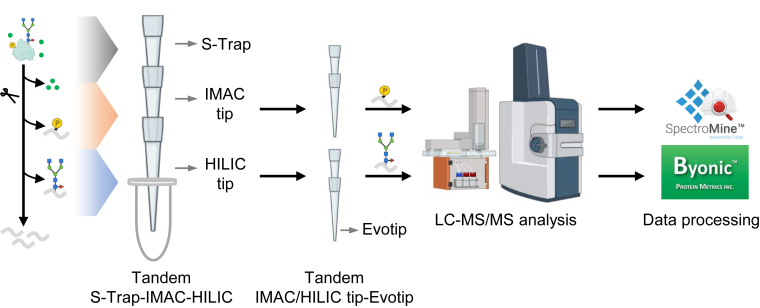
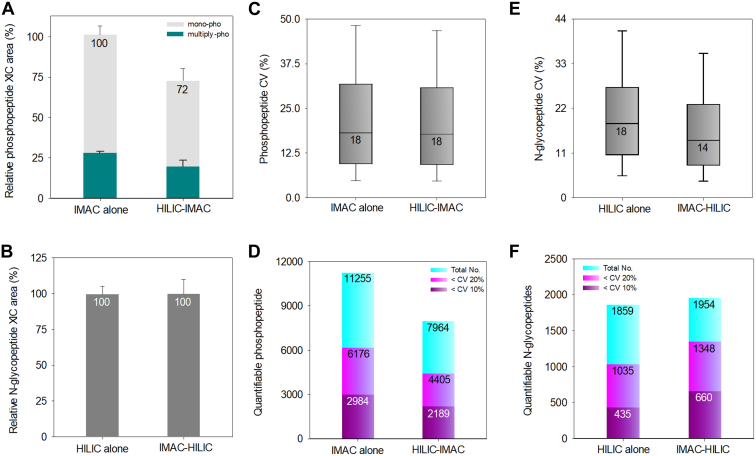
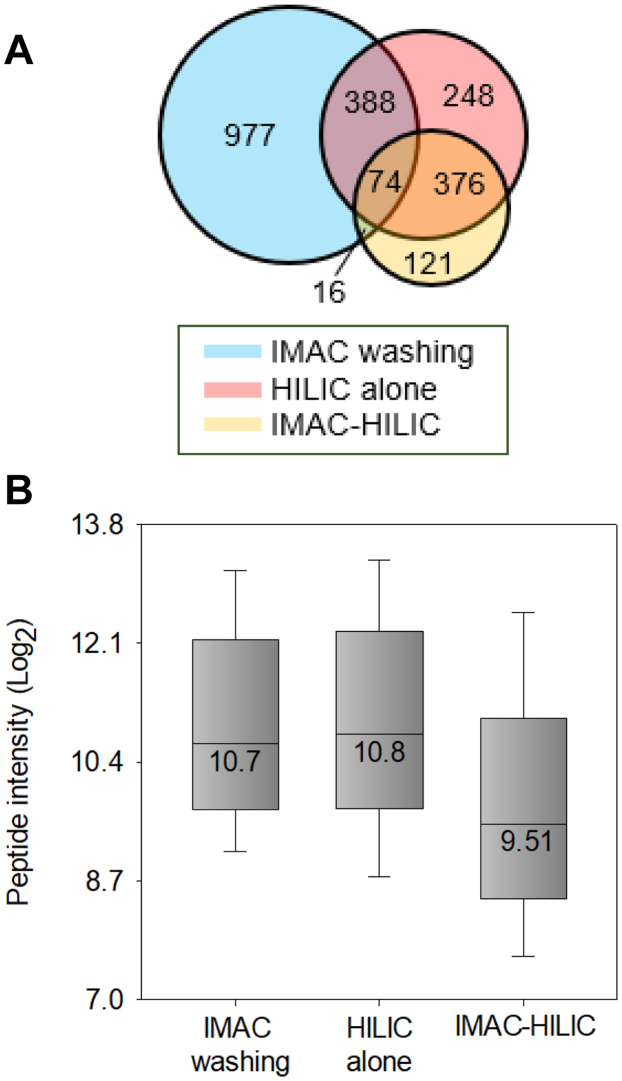
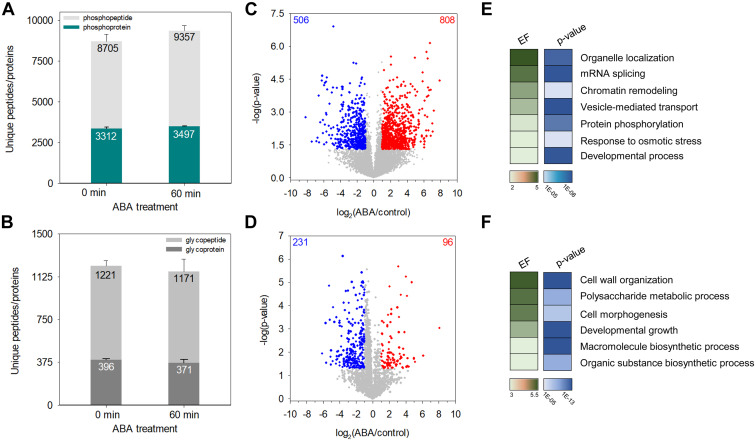
Protein post-translational modifications (PTMs) are crucial in plant cellular processes, particularly in protein folding and signal transduction. N-glycosylation and phosphorylation are notably significant PTMs, playing essential roles in regulating plant responses to environmental stimuli. However, current sequential enrichment methods for simultaneous analysis of phosphoproteome and N-glycoproteome are labor-intensive and time-consuming, limiting their throughput. Addressing this challenge, this study introduces a novel tandem S-Trap-IMAC-HILIC (S-Trap: suspension trapping; IMAC: immobilized metal ion affinity chromatography; HILIC: hydrophilic interaction chromatography) strategy, termed TIMAHAC, for simultaneous analysis of plant phosphoproteomics and N-glycoproteomics. This approach integrates IMAC and HILIC into a tandem tip format, streamlining the enrichment process of phosphopeptides and N-glycopeptides. The key innovation lies in the use of a unified buffer system and an optimized enrichment sequence to enhance efficiency and reproducibility. The applicability of TIMAHAC was demonstrated by analyzing the Arabidopsis phosphoproteome and N-glycoproteome in response to abscisic acid (ABA) treatment. Up to 1954 N-glycopeptides and 11,255 phosphopeptides were identified from Arabidopsis, indicating its scalability for plant tissues. Notably, distinct perturbation patterns were observed in the phosphoproteome and N-glycoproteome, suggesting their unique contributions to ABA response. Our results reveal that TIMAHAC offers a comprehensive approach to studying complex regulatory mechanisms and PTM interplay in plant biology, paving the way for in-depth investigations into plant signaling networks.

Keywords: ABA signaling; Arabidopsis thaliana; HILIC; IMAC; N-glycoproteomics; phosphoproteomics.


Conflict of interest statement

Conflict of interest The authors declare that they have no known competing financial interests or personal relationships that could have appeared to influence the work reported in this paper.

Figures

None
Graphical abstract
Fig. 1
Fig. 1
Experimental design of the TIMAHAC workflow for simultaneous analysis of plant phosphoproteomics and N-glycoproteomics. Contaminant removal and protein digestion are conducted within an S-Trap microcolumn. Phosphopeptides and N-glycopeptides are concurrently enriched through centrifugation using the tandem S-Trap-IMAC-HILIC strategy. The enriched peptides are directly loaded onto an Evotip and subsequently analyzed using an Evosep system coupled with a timsTOF HT mass spectrometer in DDA mode. Phosphoproteomics and N-glycoproteomics data are analyzed using SpectroMine and Byonic, respectively.
Fig. 2
Fig. 2
Evaluation of IMAC and HILIC enrichment efficiency at different TFA concentrations.A, number of identified phosphopeptides and multiply phosphorylated peptides by IMAC under four TFA concentration conditions. The light grey bar indicates the total number of identified phosphopeptides in each condition, while the dark teal bar represents the number of multiple phosphorylated peptides identified in each condition. The dots plot indicates the percentage of identified phosphopeptides relative to the total identified peptides (n = 3). Error bars, SD. B, number of identified N-glycopeptides and phosphopeptides using HILIC enrichment under different TFA concentration conditions. The dots plot illustrates the N-glycopeptide selectivity of HILIC in each condition (n = 3). Error bar, SD. C, radar plot summarizing the distribution of five glycan categorizations of identified unique glycoforms under four TFA concentration conditions. GPs, N-glycopeptides; PPs, phosphopeptides. SD, standard deviation.
Fig. 3
Fig. 3
Benchmark of tandem IMAC-HILIC strategy against tandem HILIC-IMAC workflow.A, distribution of identified non-phosphopeptides, monophosphorylated peptides, and multiply phosphorylated peptides between the IMAC alone and HILIC-IMAC workflows (n = 3). Error bar, SD. B, distribution of identified non-glycopeptides and N-glycopeptides between the HILIC alone and IMAC-HILIC workflows (n = 3). Error bar, SD. C, number of non-glycopeptides and N-glycopeptides identified using the IMAC-HILIC, IMAC-SDB-HILIC, and HILIC alone workflows under low-input condition (n = 3). Error bar, SD. GP, N-glycopeptide; Mono-pho, monophosphorylated peptide; Multiply-pho, multiply phosphorylated peptide; Non-GP, non-glycopeptide; Non-pho, non-phosphopeptide; SD, standard deviation.
Fig. 4
Fig. 4
Performance assessment of MS signals and quantitative accuracy of in tandem HILIC-IMAC and IMAC-HILIC strategies.A, accumulated XIC area of identified monophosphorylated and multiply phosphorylated peptides compared between IMAC alone and HILIC-IMAC approaches (n = 3). Error bar, SD. B, accumulated XIC area of identified N-glycopeptides compared between HILIC alone and HILIC-IMAC approaches (n = 3). Error bar, SD. C, the distribution of CVs for phosphopeptide intensities identified from both the IMAC alone and HILIC-IMAC protocols. Boxes mark the first, median, and third quantiles, and whiskers mark the minimum/maximum value within 1.5 interquartile range. D, the number of quantifiable phosphopeptides and phosphopeptides quantified with a CV below 10% and 20% compared between IMAC alone and HILIC-IMAC approaches. E, the distribution of CVs for N-glycopeptide intensities was identified from both the HILIC alone and IMAC-HILIC protocols. Boxes mark the first, median, and third quantiles, and whiskers mark the minimum/maximum value within 1.5 interquartile range. F, number of quantifiable N-glycopeptides and N-glycopeptides quantified with a CV below 10% and 20% compared between HILIC alone and IMAC-HILIC approaches. Mono-pho, monophosphorylated peptides; Multiply-pho, multiply phosphorylated peptides; SD, standard deviation; Total No., total identified number.
Fig. 5
Fig. 5
Comparison of the non-glycopeptide identification numbers and intensity medians in the IMAC washing, HILIC alone, and IMAC-HILIC results.A, venn diagram representing the overlap of identified non-glycopeptides in three results. B, intensity distribution of the non-glycopeptides identified in all conditions. Boxes mark the first, median, and third quantiles, while whiskers mark the minimum/maximum value within the 1.5 interquartile range. IMAC washing is the second step of IMAC washing.
Fig. 6
Fig. 6
Investigation of ABA-mediated perturbation in Arabidopsis phosphoproteome and N-glycoproteome using the TIMAHAC workflow.A, number of identified phosphopeptides and phosphoproteins in control and ABA-treated Arabidopsis (n = 4). Error bars, SD. B, number of identified N-glycopeptides and N-glycoproteins in control and ABA-treated Arabidopsis (n = 4). Error bars, SD. C, volcano plot of phosphorylation sites regulated upon 1 h of ABA treatment in Arabidopsis compared to untreated plants (p < 0.05, FC > 2 = red, FC < 2 = blue). D, volcano plot of N-glycopeptides regulated upon 1 h of ABA treatment in Arabidopsis compared to untreated plants (p < 0.05, FC > 2 = red, FC < 2 = blue). E, highlight of GOBP enriched by a Fisher’s exact test of phosphoproteins with significantly perturbed site upon ABA treatment (p < 0.001, EF > 2). F, highlight of GOBP enriched by a Fisher’s exact test of N-glycoproteins with significantly perturbed N-glycoform upon ABA treatment (p < 0.001, EF > 2). EF, enrichment factor; FC, fold change.

Similar articles

Cited by

References

    1. Friso G., van Wijk K.J. Posttranslational protein modifications in plant metabolism. Plant Physiol. 2015;169:1469–1487. - PMC - PubMed
    1. Chong L., Hsu C.C., Zhu Y. Advances in mass spectrometry-based phosphoproteomics for elucidating abscisic acid signaling and plant responses to abiotic stress. J. Exp. Bot. 2022;73:6547–6557. - PubMed
    1. von Schaewen A., Frank J., Koiwa H. Role of complex N-glycans in plant stress tolerance. Plant Signal. Behav. 2008;3:871–873. - PMC - PubMed
    1. Veit C., Vavra U., Strasser R. N-Glycosylation and plant cell growth. Methods Mol. Biol. 2015;1242:183–194. - PubMed
    1. Wang P., Zhao Y., Li Z., Hsu C.C., Liu X., Fu L., et al. Reciprocal regulation of the TOR kinase and ABA receptor balances plant growth and stress response. Mol. Cell. 2018;69:100–112.e106. - PMC - PubMed

MeSH terms

LinkOut - more resources