. 2024 Aug 27;83(9):1132-1143.
doi: 10.1136/ard-2024-225664.

Disentangling the riddle of systemic lupus erythematosus with antiphospholipid syndrome: blood transcriptome analysis reveals a less-pronounced IFN-signature and distinct molecular profiles in venous versus arterial events

Affiliations

Disentangling the riddle of systemic lupus erythematosus with antiphospholipid syndrome: blood transcriptome analysis reveals a less-pronounced IFN-signature and distinct molecular profiles in venous versus arterial events

Dionysis Nikolopoulos et al. Ann Rheum Dis. .

Abstract

Introduction: Systemic lupus erythematosus with antiphospholipid syndrome (SLE-APS) represents a challenging SLE endotype whose molecular basis remains unknown.

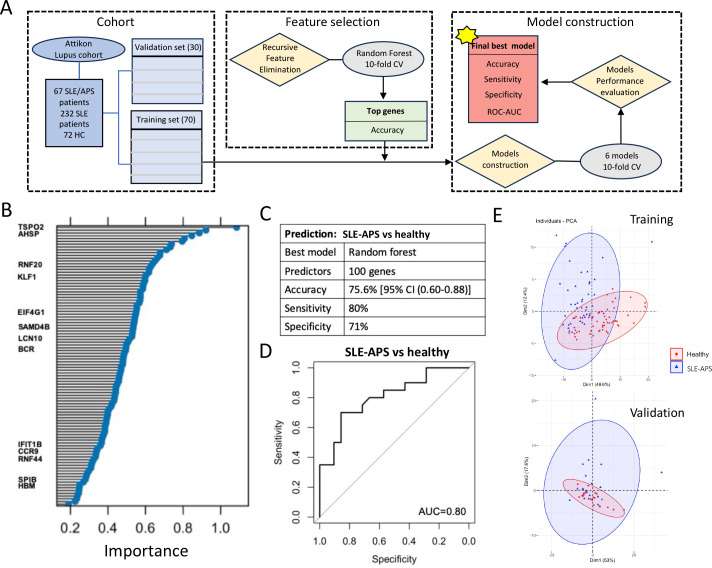
Methods: We analysed whole-blood RNA-sequencing data from 299 patients with SLE (108 SLE-antiphospholipid antibodies (aPL)-positive, including 67 SLE-APS; 191 SLE-aPL-negative) and 72 matched healthy controls (HC). Pathway enrichment analysis, unsupervised weighted gene coexpression network analysis and machine learning were applied to distinguish disease endotypes.

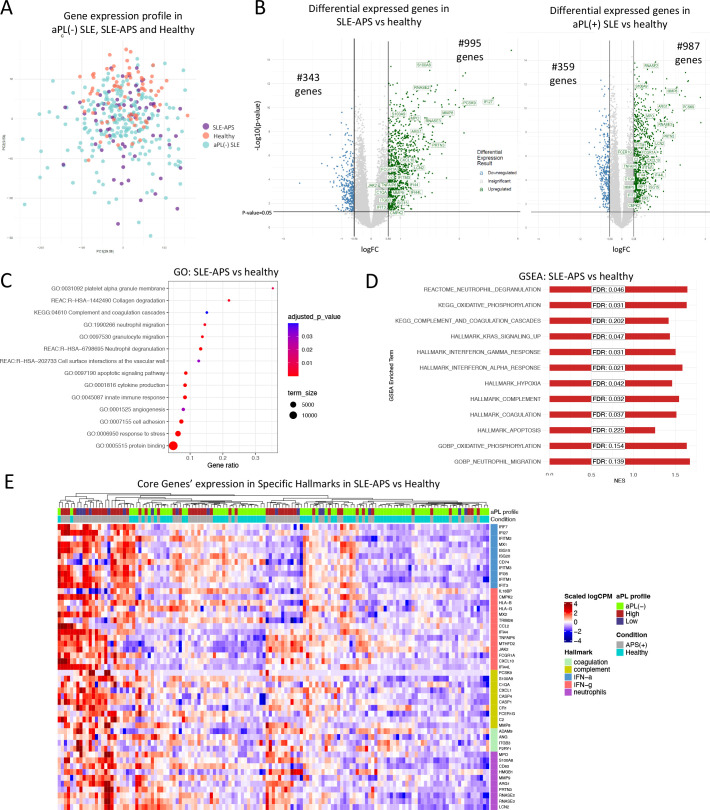
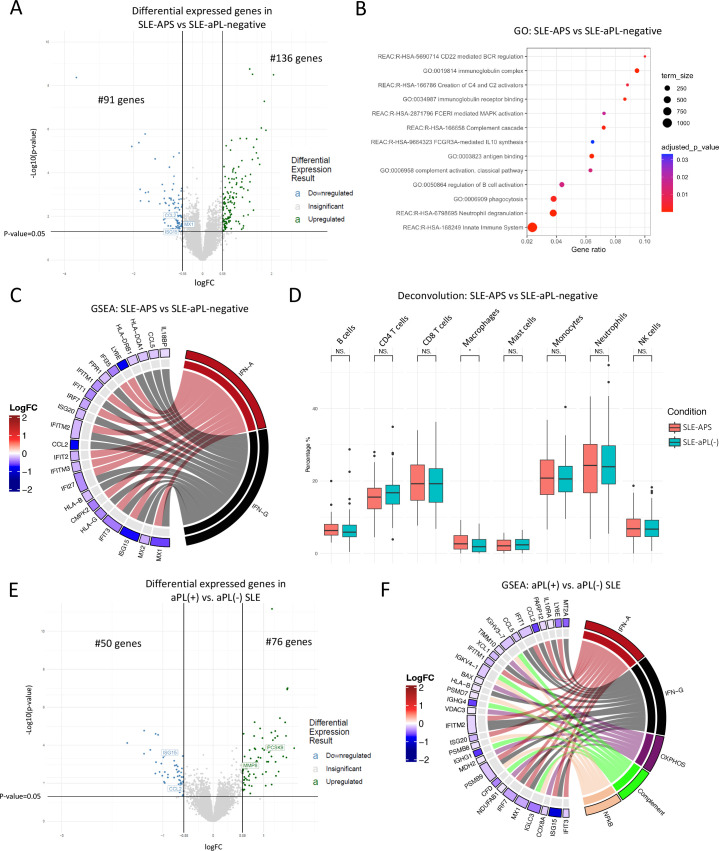
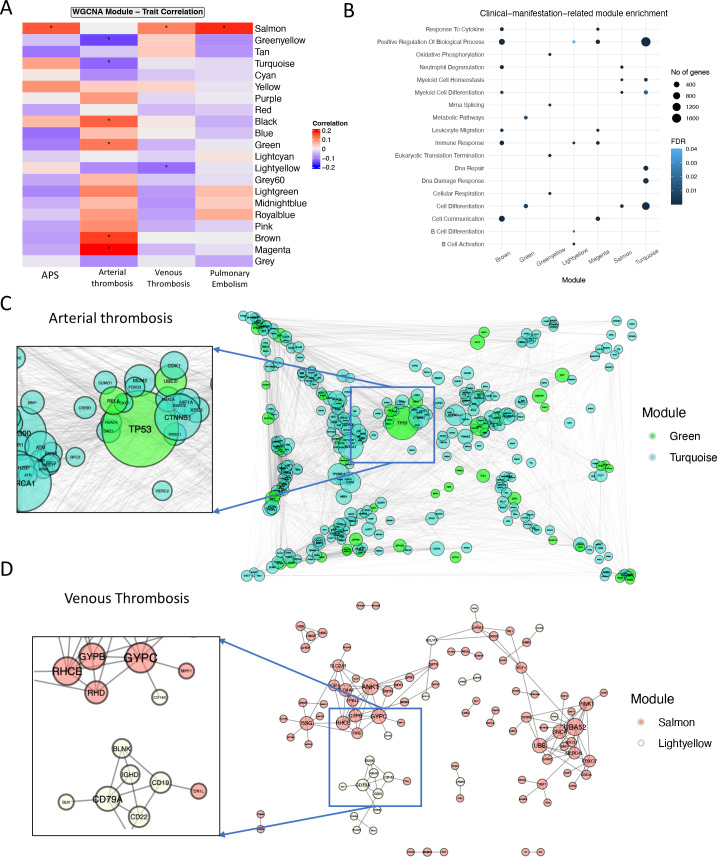
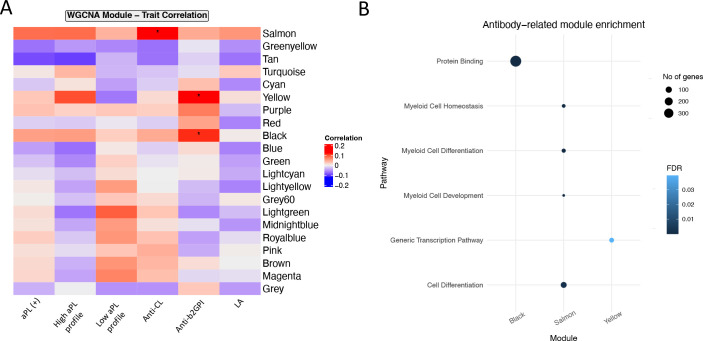
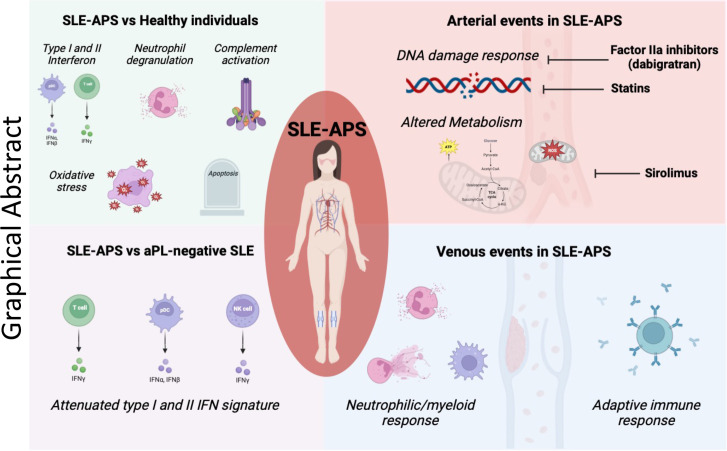
Results: Patients with SLE-APS demonstrated upregulated type I and II interferon (IFN) pathways compared with HC. Using a 100-gene random forests model, we achieved a cross-validated accuracy of 75.6% in distinguishing these two states. Additionally, the comparison between SLE-APS and SLE-aPL-negative revealed 227 differentially expressed genes, indicating downregulation of IFN-α and IFN-γ signatures, coupled with dysregulation of the complement cascade, B-cell activation and neutrophil degranulation. Unsupervised analysis of SLE transcriptome identified 21 gene modules, with SLE-APS strongly linked to upregulation of the 'neutrophilic/myeloid' module. Within SLE-APS, venous thromboses positively correlated with 'neutrophilic/myeloid' and 'B cell' modules, while arterial thromboses were associated with dysregulation of 'DNA damage response (DDR)' and 'metabolism' modules. Anticardiolipin and anti-β2GPI positivity-irrespective of APS status-were associated with the 'neutrophilic/myeloid' and 'protein-binding' module, respectively.

Conclusions: There is a hierarchical upregulation and-likely-dependence on IFN in SLE with the highest IFN signature observed in SLE-aPL-negative patients. Venous thrombotic events are associated with neutrophils and B cells while arterial events with DDR and impaired metabolism. This may account for their differential requirements for anticoagulation and provide rationale for the potential use of mTOR inhibitors such as sirolimus and the direct fIIa inhibitor dabigatran in SLE-APS.

Keywords: Antibodies, Antiphospholipid; Antiphospholipid Syndrome; Lupus Erythematosus, Systemic; Thrombosis.


Conflict of interest statement

Competing interests: None declared.

Figures

Figure 1
Figure 1
Transcriptomic signature in patients with SLE with APS versus healthy individuals demonstrates extensive aberrancies in blood transcriptome. A total of 1338 dysregulated DEGs in SLE-APS compared with HC revealed upregulation of pathways related to interferon (IFN)-α, INF-γ, complement, oxidative stress and neutrophil degranulation. (A) PCA of blood gene expression profiles from patients with SLE with APS (SLE-APS; n=67), SLE-aPL-negative patients (n=191) and HC (n=72). (B) Volcano plot highlighting the DEGs in patients with SLE-APS versus HC (left) and SLE-aPL-positive patients versus HC (right). Upregulated DEGs are coloured green, and downregulated DEGs are coloured blue. Genes not reaching our significance thresholds (|log2FC| >0.58 and p value <0.05) are shown in grey. (C) Dot plot showing the results of GO analysis representing biological pathways that are deregulated in patients with SLE-APS versus HC. The size of the dots represents the number of genes included in each enriched term and the colour represents the adjusted p value. (D) Bar plot showing the results of GSEA analysis representing biological pathways associated with the Hallmark V.7.5 database. The figure shows the positively enriched pathways (false discovery rate (FDR) <0.25) in patients with SLE-APS versus HC. (E) Heatmap showing the expression profile of the 49 genes belonging to specific Hallmarks (IFN-a, IFN-g, neutrophils, complement and coagulation) found as DEGs between SLE-APS and HC. Expression values were z-score normalised. Top annotation row shows the condition of each sample, coloured grey for patients with SLE-APS, turquoise for HC and lightgreen for aPL-negative patients, red for aPL-positive patients with aPLhigh profile and blue for aPL-positive patients with aPLlow profile. aPL, antiphospholipid antibodies; APS, antiphospholipid syndrome; DEGs, differentially expressed genes; FC, fold change; GO, gene ontology; GSEA, gene set enrichment analysis. HC, healthy controls; PCA, principal component analysis; SLE, systemic lupus erythematosus.
Figure 2
Figure 2
Machine-learning algorithm of whole-blood RNA-sequencing data distinguishes patients with systemic lupus erythematosus (SLE) with antiphospholipid syndrome (APS) from healthy individuals. A group of 100 genes discriminates SLE-APS from healthy controls (HC) (specificity=71%, sensitivity=80%, area under the curve (AUC)=0.80) including the key transcription factors SPIB and KLF1 that regulate the expression of IFIT1B, BCR, MPO and MMP9. (A) Schematic overview of the machine-learning approach; RNA-sequencing were split in training and test sets at 70:30 ratio. (B) The 100 gene predictors of the random forest model distinguishing patients with SLE with APS from HC based on their importance, as evidenced by their absolute coefficient. Gene predictors potentially implicated in the pathogenesis in the SLE-APS are highlighted. (C) Characteristics of the prediction model of patients with SLE-APS from HC. (D) Receiver operating characteristic curve (ROC) analysis of the random forest model in the validation set reveals an AUC of 0.80. (E) Principal component analysis (PCA) in training and validation sets using the 100 genes.
Figure 3
Figure 3
Transcriptomic signature in patients with SLE with APS (SLE-APS) versus SLE-aPL-negative: Interferon signature is less profound in patients with SLE-APS versus SLE-aPL-negative. Dysregulation of a group of 227 DEGs underlines the SLE-APS phenotype in SLE characterised by downregulation of type-I and type-II IFN signatures along with dysregulation of complement cascade, B-cell activation, and neutrophil degranulation. (A) Volcano plot highlighting the DEGs in SLE-APS versus SLE-aPL-negative. Upregulated DEGs are coloured green, and downregulated DEGs are coloured blue. DEGs not reaching our significance thresholds (|log2FC| >0.58 and p value <0.05) are shown in grey. (B) Dot plot showing the results of GO analysis representing biological pathways that are deregulated in patients with SLE-APS versus SLE-aPL-negative. The size of the dots represents the number of genes included in each enriched term and the colour represents the adjected p value. (C) Chord plot showing the results of GSEA analysis representing biological pathways associated with the Hallmark v2023.1.Hs database. The figure shows the significantly enriched pathways (FDR <0.25) in patients with SLE-APS versus SLE-aPL-negative (right) and key deregulated genes of each pathway found to DE between the two groups (left). (D) Deconvolution analysis using CIBERSORTx shows the estimated proportions of different immune cell subsets in SLE-APS versus SLE-aPL-negative. (E) Volcano plot highlighting the DEGs in SLE-aPL-positive versus SLE-aPL-negative patients. Upregulated DEGs are coloured green, and downregulated DEGs are coloured blue. DEGs not reaching our significance thresholds (|log2FC| >0.58 and p value <0.05) are shown in grey. (F) Chord plot showing the results of GSEA analysis representing biological pathways associated with the Hallmark v2023.1.Hs database. The figure shows the significantly enriched pathways (FDR <0.25) in SLE-aPL-positive versus SLE-aPL-negative patients (right) and key deregulated genes of each pathway found to DE between the two groups (left). aPL, anti-phospholipid antibodies; APS, antiphospholipid syndrome; DEGs, differentially expressed genes; FC, fold change; GO, gene ontology; GSEA, gene set enrichment analysis; IFN, interferon; SLE, systemic lupus erythematosus.
Figure 4
Figure 4
Unsupervised cluster analysis reveals distinct pathogenetic mechanisms implicated in venous and arterial thromboses. Venous thromboses are positively correlated with ‘neutrophilic/myeloid and ‘B cell’ modules, while the arterial thromboses were associated with dysregulation of ‘DNA damage response (DDR)’ and ‘metabolism’ modules. (A) Heatmap showing gene modules derived from WGCNA using transcriptomic data of the entire SLE cohort. Asterisks indicate statistically significant correlations between modules (rows) and APS-related clinical manifestations (columns). (B) Bubble plot of gene ontology terms found as significantly enriched in the correlated modules (salmon, greenyellow, turquoise, lightyellow, brown, magenta, green, black). Colour represents adjusted FDR, and size represents the number of genes related to a term found in each module. (C) Network from protein–protein interactions of proteins derived from green (green) and turquoise (turquoise) modules. Node fill colour corresponds to the module. The network layout was created using Davidson and Harels simulated annealing algorithm from the package igraph. (D) Network from protein–protein interactions of proteins derived from salmon (salmon) and lightyellow (lightyellow) modules. Node fill colour corresponds to the module. The network layout was created using Davidson and Harels simulated annealing algorithm from the package igraph. WGCNA, weighted gene coexpression network analysis; SLE, systemic lupus erythematosus; APS, antiphospholipid syndrome; DEGs, differentially expressed genes; aPL, antiphospholipid antibodies; FDR, false discovery rate; FC, fold change.
Figure 5
Figure 5
Unsupervised cluster analysis reveals distinct pathogenetic mechanisms implicated in patients with specific autoantibody profile. Anticardiolipin and anti-beta2 glycoprotein I (anti-β2GPI) positivity without clinical APS is associated with ‘neutrophilic/myeloid response’ and ‘protein-binding’ modules, respectively. (A) Heatmap showing gene modules derived from WGCNA using transcriptomic data of the entire SLE cohort. Asterisks indicate statistically significant correlations between modules (rows) and APS-related autoantibodies (columns). (B) Bubble plot of gene ontology terms found as significantly enriched in the correlated modules (black, salmon, yellow). Colour represents adjusted FDR, and size represents the number of genes related to a term found in each module. APS, antiphospholipid syndrome; FDR, false discovery rate; SLE, systemic lupus erythematosus; WGCNA, weighted gene coexpression network analysis.
Figure 6
Figure 6
Schematic overview of deregulated mechanisms in SLE-APS. The SLE-APS transcriptome demonstrates extensive aberrancies with quantitative and qualitative differences characterised mainly by neutrophilic, apoptotic, complement, coagulation and type-I/II IFN signatures. APS in SLE is characterised by enhanced type I and II interferon (IFN) signatures which however are less prominent compared with their aPL-negative counterparts. Venous thrombotic events are predominantly driven by an enhanced neutrophilic and B cell response. DNA damage response aberrancies and altered metabolic pathways underlie arterial thromboses. Inhibitors of fIIai such as dabigatran, statins and mTOR inhibitors such as sirolimus—that attenuate DNA damage and metabolic aberrancies—have been used tested for the treatment of arterial events in SLE-APS and could be further explored. APS, antiphospholipid syndrome; aPL, antiphospholipids antibodies; SLE, systemic lupus erythematosus.

References

    1. Sciascia S, Amigo MC, Roccatello D, et al. . “Diagnosing antiphospholipid syndrome: “extra-criteria” manifestations and technical advances”. Nat Rev Rheumatol 2017;13:548–60. 10.1038/nrrheum.2017.124 - DOI - PubMed
    1. Nikolopoulos D, Kostopoulou M, Pieta A, et al. . Evolving phenotype of systemic lupus erythematosus in caucasians: low incidence of lupus nephritis, high burden of neuropsychiatric disease and increased rates of late-onset lupus in the ‘ attikon ’ cohort. Lupus 2020;29:514–22. 10.1177/0961203320908932 - DOI - PMC - PubMed
    1. Farina N, Abdulsalam R, McDonnell T, et al. . Antiphospholipid antibody positivity in early systemic lupus erythematosus is associated with subsequent vascular events. Rheumatology 2023;62:2252–6. 10.1093/rheumatology/keac596 - DOI - PMC - PubMed
    1. Chighizola CB, Raschi E, Borghi MO, et al. . Update on the pathogenesis and treatment of the antiphospholipid syndrome. Curr Opin Rheumatol 2015;27:476–82. 10.1097/BOR.0000000000000200 - DOI - PubMed
    1. Radic M, Pattanaik D. Cellular and molecular mechanisms of anti-phospholipid syndrome. Front Immunol 2018;9:969. 10.3389/fimmu.2018.00969 - DOI - PMC - PubMed