Randomized Controlled Trial
. 2024 Oct 15;109(11):2857-2871.
doi: 10.1210/clinem/dgae226.

Impact of Distinct Antiandrogen Exposures on the Plasma Metabolome in Feminizing Gender-affirming Hormone Therapy

Affiliations
Randomized Controlled Trial

Impact of Distinct Antiandrogen Exposures on the Plasma Metabolome in Feminizing Gender-affirming Hormone Therapy

Rebecca Shepherd et al. J Clin Endocrinol Metab. .

Abstract

Context: The plasma metabolome is a functional readout of metabolic activity and is associated with phenotypes exhibiting sexual dimorphism, such as cardiovascular disease. Sex hormones are thought to play a key role in driving sexual dimorphism.

Objective: Gender-affirming hormone therapy (GAHT) is a cornerstone of transgender care, but longitudinal changes in the plasma metabolome with feminizing GAHT have not been described.

Methods: Blood samples were collected at baseline and after 3 and 6 months of GAHT from transgender women (n = 53). Participants were randomized to different anti-androgens, cyproterone acetate or spironolactone. Nuclear magnetic resonance-based metabolomics was used to measure 249 metabolic biomarkers in plasma. Additionally, we used metabolic biomarker data from an unrelated cohort of children and their parents (n = 3748) to identify sex- and age-related metabolite patterns.

Results: We identified 43 metabolic biomarkers altered after 6 months in both anti-androgen groups, most belonging to the very low- or low-density lipoprotein subclasses, with all but 1 showing a decrease. We observed a cyproterone acetate-specific decrease in glutamine, glycine, and alanine levels. Notably, of the metabolic biomarkers exhibiting the most abundant "sex- and age-related" pattern (higher in assigned female children and lower in assigned female adults, relative to assigned males), 80% were significantly lowered after GAHT, reflecting a shift toward the adult female profile.

Conclusion: Our results suggest an anti-atherogenic signature in the plasma metabolome after the first 6 months of feminizing GAHT, with cyproterone acetate also reducing specific plasma amino acids. This study provides novel insight into the metabolic changes occurring across feminizing GAHT.

Keywords: GAHT; estradiol; metabolism; metabolome; sex hormones; transgender.


Figures

Figure 1.
Figure 1.
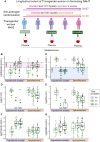
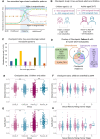
Changes to the circulating sex hormone milieu occur earlier and more potently in the cyproterone acetate group. (A) Study overview. N = 53 transgender women were recruited and randomly allocated to estradiol and 100 mg/day spironolactone or estradiol and 12.5 mg/day cyproterone acetate. Blood was collected at baseline (GAHT-naïve) and after 3 and 6 months. Heparinized plasma was sent for high-throughput NMR-based metabolomics. (B-G) Boxplots describing natural log-transformed hormone levels across GAHT in each anti-androgen group (baseline = 0 m, 3 months GAHT = 3 m, 6 months GAHT = 6 m): (B) estradiol, (C) total testosterone, (D) LH, (E) FSH, (F) prolactin, and (G) SHBG.
Figure 2.
Figure 2.
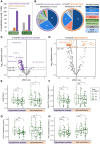
(A) Bar plot summarizing number of significant (adjusted P < .05) metabolic biomarkers associated with 3 or 6 months of GAHT relative to baseline. Purple bars indicate metabolic biomarkers only significant in the cyproterone acetate group, orange bars indicate metabolic biomarkers only significant in the spironolactone group, and gray bars indicating common metabolic biomarkers (significant in both anti-androgen groups). (B) Pie chart depicting proportions and trend (increase or decrease) of metabolic biomarker classes significantly altered after 6 months of GAHT relative to baseline in cyproterone acetate (left) and spironolactone (right) groups. In both groups, we observed decreased levels of VLDL, LDL, ApoB, and ApoB:ApoA1 ratio. (C-D) Volcano plots showing metabolic biomarkers significantly altered after 6 months of GAHT relative to baseline in cyproterone acetate (C) and spironolactone (D) groups. The y-axis represents –log10 Benjamini-Hochberg adjusted P value and the x-axis represents the effect size (beta coefficient) derived from the mixed linear model. The dashed y-intercepts indicate an adjusted P value cutoff of <.05 (bottom) or <.01 (top). (E-H) Boxplots describing metabolic biomarker levels across GAHT in each anti-androgen group (baseline = 0 m, 3 months of GAHT = 3 m, 6 months of GAHT = 6 m): (E) ApoB:ApoA1 ratio, (F) cholesterol concentration (mmol/L) of small low-density lipoprotein (LDL), (G) cholesterol concentration (mmol/L) of total very low-density lipoprotein VLDL, (H) cholesterol concentration (mmol/L) of total high-density lipoprotein (HDL). * Benjamini-Hochberg adjusted P value from timepoint mixed linear model < .05, ** Benjamini-Hochberg adjusted P value from timepoint mixed linear model < .01.
Figure 3.
Figure 3.
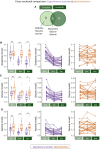
Unique changes in the amino acid profile after 3 and 6 months of GAHT in the cyproterone acetate group. (A) Cross-sectional analysis of spironolactone vs cyproterone acetate groups at 3 and 6 months of GAHT revealed amino acids significantly (Benjamini-Hochberg adjusted P < .05) different at 3 months or 6 months (or both). (B-D) Boxplots showing glutamine (B), glycine (C), and alanine (D) (mmol/L) levels in the cyproterone acetate (orange) and spironolactone (groups) at baseline, 3 months, and 6 months of GAHT. Line graphs showing individual participant trajectories of glutamine (B), glycine (C), and alanine (D) (mmol/L) across GAHT in the cyproterone acetate (purple) and spironolactone (orange) groups. *Benjamini-Hochberg adjusted P value from cross-sectional analysis linear model < .05, **Benjamini-Hochberg adjusted P value from cross-sectional analysis linear model < .01.
Figure 4.
Figure 4.
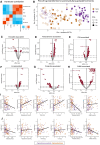
Plasma metabolic biomarker levels are significantly associated with circulating hormone levels in transgender women. (A) Pearson's correlation plot of log-transformed and z-scored circulating sex hormones (estradiol, total testosterone, FSH, LH, prolactin, and SHBG). (B). Principal component analysis (PCA) plot of natural log transformed z-scored sex hormone levels (estradiol, total testosterone, FSH, LH, prolactin, and SHBG). Cyproterone acetate group samples show better separation from baseline samples than spironolactone samples on PC1 (dimension 1, x-axis), indicative of a more pronounced change in the hormonal milieu from baseline. (C-H) Volcano plots showing metabolic biomarkers significantly associated with circulating levels of estradiol (C), total testosterone (D), FSH (E), LH (F), prolactin (G), and SHBG (H). The y-axis represents –log10 Benjamini-Hochberg adjusted P value and the x-axis represents the effect size (beta coefficient) derived from the mixed linear model. The dashed y-intercepts indicate an adjusted P value cutoff of <.05 (bottom) or <.01 (top). Metabolic biomarkers highlighted in maroon indicate those with an adjusted P value < .05. Most significant metabolic biomarkers are annotated, with glutamine (Gln), glycine (Gly), alanine (Ala), and the ApoB:ApoA1 ratio (ApoB_by_ApoA1) commonly among top metabolic biomarkers. (I-J) Scatter plots showing the association of glutamine (mmol/L) (I) and ApoB:ApoA1 ratio (mmol/L) (J) with circulating sex hormone levels. In (I-J), orange data points indicate those from the spironolactone group and purple data points indicate those from the cyproterone acetate group.
Figure 5.
Figure 5.
Top GAHT-affected metabolic biomarkers are sex- and age-associated metabolic biomarkers. (A) Circulating metabolic biomarkers show sex-associated age-related patterns. We identify 8 patterns (“A” to “H”), 2 of which are sex-associated across the lifespan (“A” and “H”) and 6 of which show sex- and age-related patterns (“B” to “G”). B. We used Nightingale Health metabolomics data from the CheckPoint to identify significant (adjusted P < .05) sex-associated metabolic biomarkers in children and adults. (C) Patterns of sex-associated metabolic biomarkers in CheckPoint data, based on the 8 patterns (“A”-“G”). Pattern “G” metabolic biomarkers (sex-associated in children and adults, with higher levels in female children and lower levels in female adults) was the most common pattern. (D) Overlap of pattern G metabolic biomarkers identified in the CheckPoint study with 6-month GAHT-affected metabolic biomarkers. Forty-four of 55 (80%) were significantly altered after 6 months of GAHT, with 23 unique to the cyproterone acetate group, 1 metabolic biomarker specific to the spironolactone group, and 20 common metabolic biomarkers. (E-F) Boxplots showing glutamine (mmol/L) levels grouped by age (child or adult) and sex (pink = assigned female, blue = assigned male) (E) and Sexual Maturity Rating (Tanner stage) in children (F). (G-H) Boxplots showing the ApoB:ApoA1 ratio grouped by age and sex (G) and Sexual Maturity Rating (Tanner stage) in children (H). **Benjamini-Hochberg adjusted P < .01. In (F) and (H), sex association appears to shift from child association to toward adult association as Sexual Maturity Rating category increases.

Similar articles

Cited by

References

    1. Coleman E, Radix AE, Bouman WP, et al. . Standards of care for the health of transgender and gender diverse people, version 8. Int J Transgend Health. 2022;23(Suppl 1):S1‐S259. - PMC - PubMed
    1. Baker KE, Wilson LM, Sharma R, Dukhanin V, McArthur K, Robinson KA. Hormone therapy, mental health, and quality of life among transgender people: a systematic review. J Endocr Soc. 2021;5(4):bvab011. - PMC - PubMed
    1. Foster Skewis L, Bretherton I, Leemaqz SY, Zajac JD, Cheung AS. Short-term effects of gender-affirming hormone therapy on dysphoria and quality of life in transgender individuals: a prospective controlled study. Front Endocrinol (Lausanne). 2021;12:717766. - PMC - PubMed
    1. Javier C, Crimston CR, Barlow FK. Surgical satisfaction and quality of life outcomes reported by transgender men and women at least one year post gender-affirming surgery: a systematic literature review. Int J Transgend Health. 2022;23(3):255‐273. - PMC - PubMed
    1. van Leerdam TR, Zajac JD, Cheung AS. The effect of gender-affirming hormones on gender dysphoria, quality of life, and psychological functioning in transgender individuals: a systematic review. Transgend Health. 2023;8(1):6‐21. - PMC - PubMed

Publication types