. 2024 Apr 12;7(7):e202302416.
doi: 10.26508/lsa.202302416. Print 2024 Jul.

Nr1h4 and Thrb ameliorate ER stress and provide protection in the MPTP mouse model of Parkinson's

Affiliations

Nr1h4 and Thrb ameliorate ER stress and provide protection in the MPTP mouse model of Parkinson's

Nancy Ahuja et al. Life Sci Alliance. .

Abstract

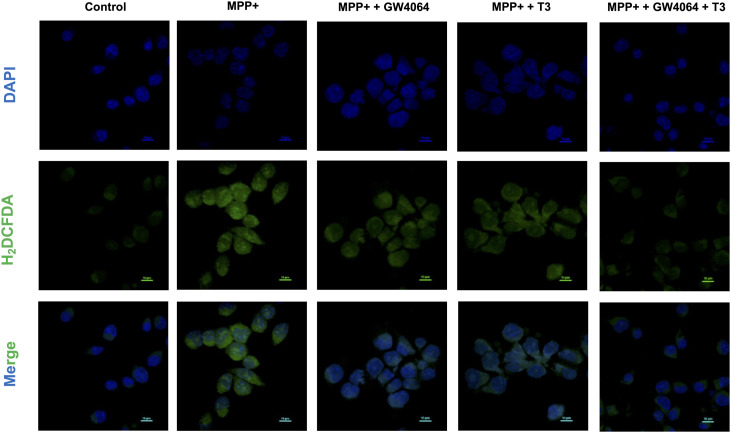
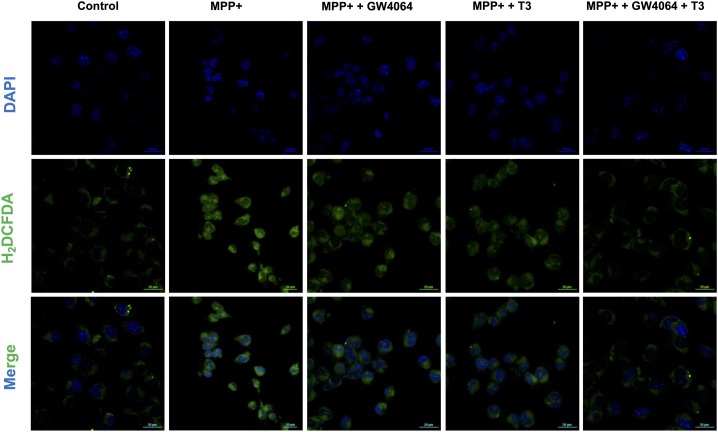
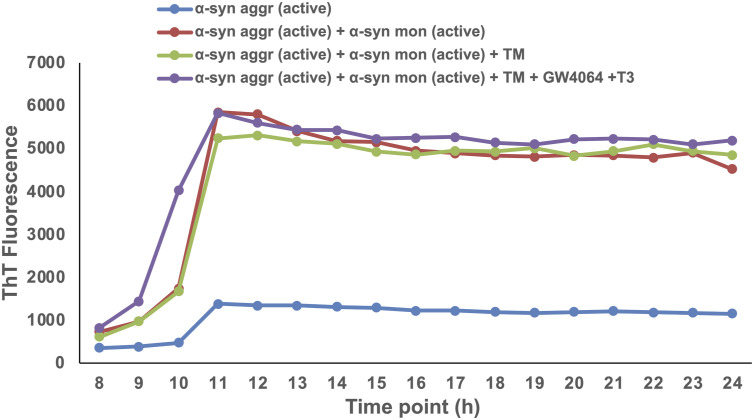
Elevated ER stress has been linked to the pathogenesis of several disease conditions including neurodegeneration. In this study, we have holistically determined the differential expression of all the nuclear receptors (NRs) in the presence of classical ER stress inducers. Activation of Nr1h4 and Thrb by their cognate ligands (GW4064 and T3) ameliorates the tunicamycin (TM)-induced expression of ER stress genes. A combination of both ligands is effective in mitigating cell death induced by TM. Further exploration of their protective effects in the Parkinson's disease (PD) model shows that they reduce MPP+-induced dissipation of mitochondrial membrane potential and ROS generation in an in vitro PD model in neuronal cells. Furthermore, the generation of an experimental murine PD model reveals that simultaneous treatment of GW4064 and T3 protects mice from ER stress, dopaminergic cell death, and functional deficits in the MPTP mouse model of PD. Thus, activation of Nr1h4 and Thrb by their respective ligands plays an indispensable role in ER stress amelioration and mounts protective effects in the MPTP mouse model of PD.


Conflict of interest statement

The authors declare that they have no conflict of interest.

Figures

Figure S1.
Figure S1.. Induction of ER stress in N2a cells.
Cells were treated with different concentrations of TM, TG, and BFA, and the expression of ER stress markers such as BiP and CHOP was examined by Western blot. Data are representative of three independent experiments.
Figure 1.
Figure 1.. Expression profiling of nuclear receptors in ER stress–induced differentiated N2a cells.
Cells were treated with TM, TG, and BFA for 24 h, and the expression of all the NRs was determined by qRT–PCR using an array plate. (A) Pie chart depicting the number of NRs that found expression in N2a cells (transcripts having a Ct value 32 or less). (B) Heatmap illustrating the altered expression levels of NRs after treatment with TM, TG, and BFA relative to an untreated control. (C) Schematic representing the NRs, which are commonly and uniquely modulated (showing at least twofold change) in TM-, TG-, and BFA-induced ER stress conditions. (D) Average fold regulation in the expression of endocrine, adopted orphan, and orphan NRs. (E) Immunoblot analysis of NRs, which are commonly modulated in all three stress conditions. Data are the mean ± SD or representative of three independent experiments performed in triplicates. *P < 0.05, **P < 0.01, ***P < 0.001 versus untreated control group by a two-tailed t test. The letters above the bar depict connecting letter reports representing the correlation of NR expression in the presence of TM, TG, and BFA. Bars not connected by similar letters are significantly different.
Figure 2.
Figure 2.. Nr1h4 and Thrb activation ameliorates TM-induced ER stress in differentiated N2a cells.
(A, B, C) qRT–PCR analysis of ER stress genes in control and (A) Nr1h4 knockdown, (B) Thrb knockdown, or (C) Nr1h4 and Thrb double-knockdown differentiated N2a cells, treated with TM, in the presence or absence of GW4064 or T3 or both. (D, E, F) Immunoblot analysis of all the ER stress markers involved in three UPR pathways (IRE, PERK, and ATF6) in control and (D) Nr1h4 knockdown, (E) Thrb knockdown, or (F) Nr1h4 and Thrb double-knockdown differentiated N2a cells, treated with TM, in the presence or absence of GW4064 or T3 or both. Data are the mean ± SD or representative of three independent experiments performed in triplicates. *P <= 0.05, **P < 0.01, ***P < 0.001 versus control group or as indicated by a two-tailed t test.
Figure S2.
Figure S2.. Nr1h4 activation in Thrb knockdown background and Thrb activation in Nr1h4 knockdown background ameliorate TM-induced ER stress.
(A) qRT–PCR analysis of ER stress genes in (A) Nr1h4 knockdown N2a cells, treated with TM, in the presence or absence of T3; (B) Thrb knockdown N2a cells, treated with TM, in the presence or absence of GW4064; and (C) N2a cells in the absence or presence of GW4064 or T3 or both. Data are the mean ± SD or representative of three independent experiments performed in triplicates. ***P < 0.001 versus control group; #P < 0.05, compared with TM by a two-tailed t test.
Figure 3.
Figure 3.. GW4064 and T3 treatment is protective in ER stress–mediated cell death.
(A, B, C) Cells were treated with TM in the absence or presence of GW4064 or T3 or both for 24 h, and cell death was monitored by a (A) MTT assay, (B) LDH release assay, and (C) annexin-V and PI staining by flow cytometry. (D) Immunoblot analysis of pro-apoptotic (clv parp, Bax) and anti-apoptotic (Mcl-1, Bcl-2, pro-caspase-3) markers. (E) Cleaved caspase-3 was measured by a fluorescent assay. Data are the mean ± SD or representative of three independent experiments performed in triplicates. *P < 0.05, **P < 0.01, ***P < 0.001, compared with control or as indicated; #P < 0.05, ##P < 0.01, ###P < 0.001, compared with TM by a two-tailed t test.
Figure 4.
Figure 4.. Activation of Nr1h4 and Thrb by GW4064 and T3 prevents mitochondrial membrane depolarization and ROS production in an in vitro PD model.
Differentiated N2a cells were treated with MPTP in the absence or presence of GW4064 or T3 or both for 24 h. (A) qRT–PCR and immunoblot analysis of Nr1h4 and Thrb in the presence of MPP+. (B) Immunoblot of ER stress markers BiP and CHOP. (C) Mitochondrial membrane potential was measured by flow cytometry using the fluorescent probe JC-1. (D) Total ROS levels were detected with the fluorescent probe, 2′,7′-dichlorodihydrofluorescein diacetate, by flow cytometry. Data are the mean ± SD or representative of three independent experiments performed in triplicates. *P < 0.05, **P < 0.01, ***P < 0.001, compared with control or as indicated; #P < 0.05, ##P < 0.01, ###P < 0.001, compared with MPP+ by a two-tailed t test.
Figure S3.
Figure S3.. GW4064 and T3 treatment reduced MPP+-induced ROS production.
Total ROS levels were detected with the fluorescent probe, 2′,7′-dichlorodihydrofluorescein diacetate, by confocal imaging. Data are representative of three independent experiments.
Figure 5.
Figure 5.. Treatment with GW4064 and T3 has neuroprotective effects in the MPTP mouse model of PD.
(A) Schematic representation of the MPTP model experimental design. (B) Immunoblot of TH and ER stress markers (BiP and CHOP) in the striatum. (C) Immunohistochemical detection of TH in the striatum and the SNpc. Scale bars: 50 μm. Data are representative of three independent experiments. *P < 0.05, **P < 0.01, ***P < 0.001, compared with control or as indicated by a two-tailed t test.
Figure 6.
Figure 6.. Behavioral analysis of the GW4064- and T3-administered MPTP mouse model of PD.
(A) Open field test results of MPTP-treated mice. Track plots depicting the movement of mice in the open field test for 15 min using ANY-maze software. The number of entries in the center zone, time spent in the center zone, and total distance traveled in 15 min in an open field. (B) Pole test results where the total time to descend and T-turn time were recorded. (C) Rotarod test where latency to fall off the rotarod is depicted at different rotation speeds (5–20 rpm). (D) Wire hanging test to measure the grip strength. (E) Morris water maze tests where mice were analyzed for the escape latency during a 5-d training course. (F) In the probe tests, the track plot of the movement of mice for 90 s, the number of entries into the target zone, and the time spent in the target zone are depicted. Data are presented as the mean ± SEM (n = 15/group). *P < 0.05, **P < 0.01, ***P < 0.001, ****P < 0.0001, compared with the control group or as indicated; #P < 0.05, ##P < 0.01 for MPTP versus MPTP+GW4064+T3 group by one-way ANOVA followed by either the Tukey post hoc analysis (in cases of homogeneous variance) or Dunnett’s T3 test (for heterogeneous variance).
Figure S4.
Figure S4.. Anxiety and locomotor activity of MPTP-induced PD mouse model.
(A) EPMT results where the number of entries into and time spent in open arms are depicted. (B) Narrow beam walk test results depicting the time taken to cross the beam and the number of foot slip errors. Data are presented as the mean ± SEM (a total of 15 mice per group were used; *P < 0.05, **P < 0.01, ***P < 0.001, compared with the control group or as indicated, by one-way ANOVA followed by the Tukey post hoc test).
Figure 7.
Figure 7.. Activation of Nr1h4 and Thrb prevents ER stress and ROS production in human neuronal SH-SY5Y cells.
SH-SY5Y cells were treated with MPP+ in the absence or presence of GW4064 or T3 or both for 24 h. (A) Immunoblot of ER stress markers BiP and CHOP. (B) Annexin-V and PI staining by flow cytometry. (C) ROS levels detected by flow cytometry. (D) Effect of ER stress and GW4064 and T3 on α-syn aggregation: (D) representative confocal images of 4 μg/ml α-syn aggregates (active) alone or in combination with active monomers, in the presence of TM (2.5 μg/ml) only or together with GW4064 and T3 for 24 h. The number of α-syn puncta per cell was counted for 30 cells in each group. Data are the mean ± SD or representative of three independent experiments performed in triplicates. *P < 0.05, **P < 0.01, ***P < 0.001, compared with control or as indicated; #P < 0.05, ##P < 0.01, ###P < 0.001, compared with MPP+ by a two-tailed t test.
Figure S5.
Figure S5.. GW4064 and T3 treatment reduced MPP+-induced ROS production in SH-SY5Y cells.
Total ROS levels were detected by confocal imaging. Data are representative of three independent experiments performed in triplicates.
Figure S6.
Figure S6.. Dynamics of α-synuclein aggregation in the presence of TM and GW4064 and T3.
ThT (25 μM) fluorescence binding assay of α-syn aggregates (active), in combination with α-syn monomer (active) and the presence of TM alone or together with ligands (GW4064 and T3).

Similar articles

References

    1. Back SH, Kaufman RJ (2012) Endoplasmic reticulum stress and type 2 diabetes. Annu Rev Biochem 81: 767–793. 10.1146/annurev-biochem-072909-095555 - DOI - PMC - PubMed
    1. Bazzari FH, Abdallah DM, El-Abhar HS (2019) Chenodeoxycholic acid ameliorates AlCl3-induced alzheimer’s disease neurotoxicity and cognitive deterioration via enhanced insulin signaling in rats. Molecules 24: 1992. 10.3390/molecules24101992 - DOI - PMC - PubMed
    1. Bhagyaraj E, Ahuja N, Kumar S, Tiwari D, Gupta S, Nanduri R, Gupta P (2019) TGF-β induced chemoresistance in liver cancer is modulated by xenobiotic nuclear receptor PXR. Cell Cycle 18: 3589–3602. 10.1080/15384101.2019.1693120 - DOI - PMC - PubMed
    1. Cabral-Miranda F, Hetz C (2018) ER stress and neurodegenerative disease: A cause or effect relationship? Curr Top Microbiol Immunol 414: 131–157. 10.1007/82_2017_52 - DOI - PubMed
    1. Cao Y, Xiao Y, Zhou K, Yan J, Wang P, Yan W, Cai W (2019) FXR agonist GW4064 improves liver and intestinal pathology and alters bile acid metabolism in rats undergoing small intestinal resection. Am J Physiol Gastrointest Liver Physiol 317: G108–G115. 10.1152/ajpgi.00356.2017 - DOI - PubMed

Substances