. 2024 Apr 12;12(4):e008261.
doi: 10.1136/jitc-2023-008261.

Armored TGFβRIIDN ROR1-CAR T cells reject solid tumors and resist suppression by constitutively-expressed and treatment-induced TGFβ1

Affiliations

Armored TGFβRIIDN ROR1-CAR T cells reject solid tumors and resist suppression by constitutively-expressed and treatment-induced TGFβ1

Tri Minh Tran et al. J Immunother Cancer. .

Abstract

Background: Chimeric antigen receptor (CAR) T-cell therapy target receptor tyrosine kinase-like orphan receptor 1 (ROR1) is broadly expressed in hematologic and solid tumors, however clinically-characterized ROR1-CAR T cells with single chain variable fragment (scFv)-R12 targeting domain failed to induce durable remissions, in part due to the immunosuppressive tumor microenvironment (TME). Herein, we describe the development of an improved ROR1-CAR with a novel, fully human scFv9 targeting domain, and augmented with TGFβRIIDN armor protective against a major TME factor, transforming growth factor beta (TGFβ).

Methods: CAR T cells were generated by lentiviral transduction of enriched CD4+ and CD8+ T cells, and the novel scFv9-based ROR1-CAR-1 was compared with the clinically-characterized ROR1-R12-scFv-based CAR-2 in vitro and in vivo.

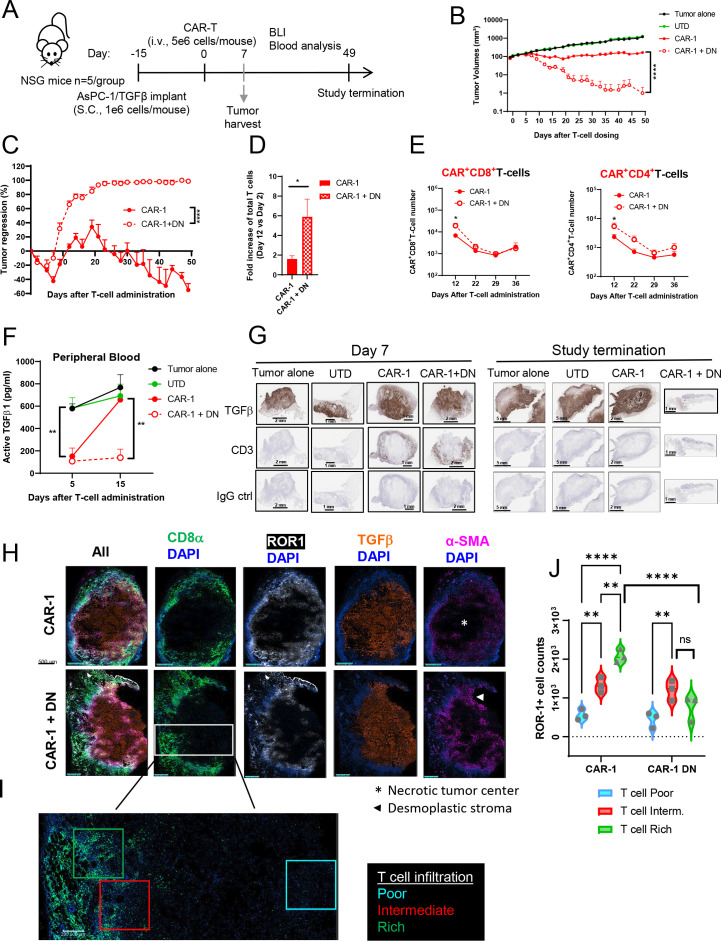
Results: CAR-1 T cells exhibited greater CAR surface density than CAR-2 when normalized for %CAR+, and produced more interferon (IFN)-γ tumor necrosis factor (TNF)-α and interleukin (IL)-2 in response to hematologic (Jeko-1, RPMI-8226) and solid (OVCAR-3, Capan-2, NCI-H226) tumor cell lines in vitro. In vivo, CAR-1 and CAR-2 both cleared hematologic Jeko-1 lymphoma xenografts, however only CAR-1 fully rejected ovarian solid OVCAR-3 tumors, concordantly with greater expansion of CD8+ and CD4+CAR T cells, and enrichment for central and effector memory phenotype. When equipped with TGFβ-protective armor TGFβRIIDN, CAR-1 T cells resisted TGFβ-mediated pSmad2/3 phosphorylation, as compared with CAR-1 alone. When co-cultured with ROR-1+ AsPC-1 pancreatic cancer line in the presence of TGFβ1, armored CAR-1 demonstrated improved recovery of killing function, IFN-γ, TNF-α and IL-2 secretion. In mouse AsPC-1 pancreatic tumor xenografts overexpressing TGFβ1, armored CAR-1, in contrast to CAR-1 alone, achieved complete tumor remissions, and yielded accelerated expansion of CAR+ T cells, diminished circulating active TGFβ1, and no apparent toxicity or weight loss. Unexpectedly, in AsPC-1 xenografts without TGFβ overexpression, TGFβ1 production was specifically induced by ROR-1-CAR T cells interaction with ROR-1 positive tumor cells, and the TGFβRIIDN armor conferred accelerated tumor clearance.

Conclusions: The novel fully human TGFßRIIDN-armored ROR1-CAR-1 T cells are highly potent against ROR1-positive tumors, and withstand the inhibitory effects of TGFß in solid TME. Moreover, TGFβ1 induction represents a novel, CAR-induced checkpoint in the solid TME, which can be circumvented by co-expressing the TGβRIIDN armor on T cells.

Keywords: Cell Engineering; Immunotherapy, Adoptive; Receptors, Chimeric Antigen; T-Lymphocytes; Tumor Microenvironment.


Conflict of interest statement

Competing interests: All authors are employees of Lentigen Technology Inc., a Miltenyi Biotec Company.

Figures

Figure 1
Figure 1
Characterization of in vitro and in vivo function of the novel ROR-1 CAR-1, and the comparator CAR-2, against hematologic tumors. (A) Schematic diagram of CAR-1 and CAR-2 ROR1-1 targeting constructs. (B) Representative flow cytometry plots for ROR1 CAR expression on CAR-1 and CAR-2-transduced normal donor T cells, and UTD control. (C) Pooled CAR expression percentage CAR+cells (left) and MFI (right) for transduction experiments in T cells from three healthy donors, and un-transduced T cells (UTD) control, as measured by flow cytometry at day 8 post transduction; mean±SEM, Student’s t-test. (D) Quantification of ROR1 cell surface density, expressed in molecules per cell, in different hematologic cell lines, as quantified by flow cytometric ABC assay, n=2. (E) In vitro cytotoxic activity of CAR T cells when co-cultured for 18 hours with Jeko-1, RPMI-8226, or HL-60 tumor cell lines; one representative donor of three is shown. (F) Quantification of cytokines secreted in 18 hours co-culture of CAR T cells with Jeko-1 cell line by ELISA, pooled results from three donors, mean±SEM, mixed effect model. (G) NSG mice were implanted with Jeko-1 cells (i.v., 0.5e6 cells/mouse; 6 mice/group) at day #−6, followed by staging at day #−1, CAR T cells were administered (i.v., 3e6 CAR+T cells/mouse) at day #0; tumor progression was quantified by bioluminescence imaging (H, I). Tumor progression in study groups was compared by Kruskal-Wallis analysis, with Dunn’s post hoc test. Body weight change was monitored (J) peripheral blood was sampled at the indicated time points and the tumor cells (K) and human T cells (L) were quantified by flow cytometry. Student’s t-test. All data are shown as mean±SEM; statistical significance is denoted as *p<0.05; **p<0.01; ***p<0.001; ****p<0.0001, ns-non-significant. CAR, chimeric antigen receptor; IFN, interferon; IL, interleukin; i.v., intravenous; MFI, mean fluorescence intensity; ROR1, receptor tyrosine kinase-like orphan receptor 1; scFv, single chain variable fragment; TNF. tumor necrosis factor.
Figure 2
Figure 2
CAR-1, but not CAR-2, suppressed tumor progression in the orthotopic OVCAR-3 mouse xenograft model of ovarian cancer, and exhibited higher cytokine response to solid tumor lines in vitro. (A) Quantification of ROR1 expression on the surface of various solid tumor cancer cell lines; the experiment was performed in duplicates employing anti-ROR1 Ab from BD Biosciences; a separate experiment was also performed in duplicates using anti-ROR-1 Abs from Miltenyi Biotec and R&D Systems with similar results. (B) Representative killing curves of CAR T cells against various solid cancer cell lines (OVCAR-3, Capan-2, and NCI-H226) in an 18 hours co-culture. (C) Cytokine production from the experiments in (B) was quantified by ELISA, pooled results from three independent donors are shown, mean±SEM. Experimental groups were compared by mixed effect model (D–I): Efficacy of CAR T cells in in vivo ovarian cancer OVCAR-3 xenograft model: NSG mice (five mice/group) were implanted (i.p.) with OVCAR-3 cell line (10e6 cells/mouse) at day −7, followed by staging at day −1; CAR T cells (5e6 CAR+T cells/mouse) were administered (i.v.) at day 0 (D); tumor progression was quantified by bioluminescence imaging; groups were compared by mixed effect analysis with Tukey’s post hoc test. (E, F) Body weight was monitored (G); blood was sampled at the indicated time points to quantify CAR+T cells in both CD8+ and CD4+ subpopulations (H) as well as memory T cells (I). Groups were compared by two way analysis of variance with Sidak’s post hoc test (H) or Student’s t-test (I). All results are presented as mean±SEM; statistical significance is denoted as *p<0.05; **p<0.01; ***p<0.001; ****p<0.0001, ns-non-significant. Ab, antibody; BLI, bioluminescence; CAR, chimeric antigen receptor; IFN, interferon; IL, interleukin; i.p., intraperitoneal; i.v., intravenous; ROR1, receptor tyrosine kinase-like orphan receptor 1; TEM, efector memeory T cells; TCM - central memory T cells; TNF, tumor necrosis factor; UTD, un-transduced T cells.
Figure 3
Figure 3
Dominant negative TGFβRII (DN) obstructed TGFβ1 signaling in T cells transduced with CAR-1 and reduced the inhibitory effect of TGFβ1 on CAR T cells’ cytotoxic activity against pancreatic cancer cell line AsPC-1 in vitro. (A) schematic diagram of constructs of CAR-1 alone and CAR-1 armored with DN. (B) At day 8 of transduction, CAR expression (left: flow plots, center: graph from the flow plots) and memory phenotype (right) of both CD8+ and CD4+T cells transduced with CAR-1 or CAR-1+DN were analyzed by flow cytometry; three independent experiments were performed, employing three donors, with similar results. (C) Expression of TGFβRII in T cells transduced with CAR-1 or CAR-1+DN was assessed by flow cytometry; three independent experiments were performed, employing three donors, with similar results. (D) CAR T cells were IL-2 starved for 22 hours to synchronize the cells followed by treatment with TGFβ1 (10 ng/mL) for 5, 15, or 30 min; cells were then stained with pSmad2/3 and subject to flow cytometry analysis; left panel: flow plots: right panel: graph from the plots in the left panel (results are the mean±SE of three donors). (E) Expression of ROR1 on AsPC-1 cell line was assessed by flow cytometry. (F) AsPC-1 was co-cultured with CAR T cells without or with TGFβ1 (1 or 10 ng/mL); tumor cell lysis was measured by xCELLigence; left: % cytolysis (results are representative of three donors); right: cytotoxic relative potency of CAR T cells treated with TGFβ1 versus non-treatment (results are the mean±SE of three donors). Mean±SE of three donors. Two-way analysis of variance with Sidak’s post hoc test *p<0.05; ***p<0.001; **p<0.01; ***p<0.001. (G) Cytokine production from the experiments in (F) was quantified by ELISA; results are the mean±SE of three donors. (H,I) Production of TGFβ1 either in active or latent form by various solid tumor cell lines (H) or by AsPC-1 ectopically overexpressing TGFβ1 (I) was assessed by ELISA; data are representative of two independent experiments with similar results. (J) AsPC-1 overexpressing TGFβ1 (AsPC-1/TGFβ1) or AsPC-1 control was co-cultured with CAR T cells, % cytolysis of tumor cells was shown, results are the representative of three donors. (K) Cytokine production from the experiments in (J) was quantified by ELISA. Mean±SE of three donors; Student’s t-tests; statistical significance is denoted as *p<0.05; **p<0.01; ***p<0.001; ****p<0.0001, ns-non-significant. CAR, chimeric antigen receptor; IFN, interferon; IL, interleukin; TGF, transforming growth factor; TNF, tumor necrosis factor; UTD, un-transduced T cells.
Figure 4
Figure 4
TGFβRIIDN attenuated the inhibitory effect of TGFβ1 in AsPC-1 xenograft model of pancreatic cancer overexpressing TGFβ1. NSG mice (five mice/group) were implanted subcutaneously with AsPC-1/TGFβ1 cells (1e6 cells/mouse) at day −15, followed by staging and CAR T-cell infusion (i.v., 5e6 CAR+T cells/mouse) at day 0 (A) and tumor volumes were monitored (B–C). Statistical significance determined by Mann-Whitney test (B) and Wilcoxon matched—pairs signed-rank test (C) T cells isolated from peripheral blood at the indicated time points were quantified by flow cytometry for total cell number (D) or CAR+ components in both CD8+ and CD4+ subpopulations (E) results were analyzed by Mann-Whitney test. Blood from mice sampled at day 5 and day 15 post T-cell infusion was quantified for TGFβ1, groups were compared by Student’s t-test (F). Tumor tissues collected at day 7 post T-cell infusion and at study termination were subjected to immunohistochemistry staining for TGFβ1, CD3, and IgG control (G); the number of ROR1+cells was quantified by MACSima imaging cycling staining high content immunofluorescent microscopy (H–J); tissues were probed for CD8a (T cells), ROR1 (CAR-targeted tumor antigen), TGFβ and alpha-smooth muscle actin (myofibroblasts, stroma) with DAPI counterstaining for nuclei (H); T cell-rich, T cell-intermediate and T cell-low regions of tumors were evaluated; an example of higher magnification of these regions is shown in (I); and the quantification of ROR1+cells from each of these regions (n=3 each) is shown in violin plots representing cell number distribution in each group (J); statistical analysis was performed by two-way analysis of variance with Sidak’s post hoc test. All results are presented as mean±SEM; statistical significance is denoted as *p<0.05, **p<0.01, ***p<0.001, ****p<0.0001. BLI, bioluminescene; CAR, chimeric antigen receptor; DAPI, 4',6-diamidino-2-phenylindole; DN, dominant negative; i.v., intravenous; ROR1, receptor tyrosine kinase-like orphan receptor 1; s.c., subcutaneous; SMA, smooth muscle actin; TGF, transforming growth factor; UTD, un-transduced T cells.
Figure 5
Figure 5
Armored CAR-1 T cells accelerate tumor clearance in TGFβ-inducible model of pancreatic cancer. NSG mice (five mice/group) were implanted subcutaneously with AsPC-1 cells (1e6 cells/mouse) at day −17, followed by staging and CAR-T infusion (i.v., 5e6 CAR+T cells/mouse) at day 0 (A) tumor growth kinetics were monitored and analyzed by one-way ANOVA with Tukey’s post hoc test. Vertical dotted lines represent the last time points when tumors in CAR-1+DN and CAR-1 groups were detected, respectively (B). Percentage of tumor regression in mice treated with either CAR-1+DN or CAR-1 T cells relative to CAR dosing day (day 0) was analyzed by Student’s t-test. Results in (B) (C) are presented as mean±SEM (C). Tumor tissues collected at day 7 post T-cell infusion were subjected to immunohistochemical staining for TGFβ1, CD3, IgG control (D); the number of tumor cells, T cells and myofibroblasts positive for TGFβ was quantified by MACSima imaging cycling staining (E–G); tissues were probed for TGFβ, CD8a (T cells), ROR1 (CAR-targeted tumor antigen), pan-cytokeratin (non-targeted tumor antigen), and alpha-smooth muscle actin (myofibroblasts, stroma); T cell-rich, T cell-intermediate and T cell-low regions of tumors were evaluated in triplicates (E); representative magnification of these regions (F); quantification of TGFβ+cells in T cell-rich, T cell-intermediate and T cell-low regions (n=3 each) is shown in violin plots representing cell number distribution in each group (G); statistical analysis was performed by two-way ANOVA with Sidak’s post hoc test; statistical significance is denoted as *p<0.05, **p<0.01, ***p<0.001, ****p<0.0001, ns-non-significant. ANOVA, analysis of variance; BLI, bioluminescence; CAR, chimeric antigen receptor; DN, dominant negative; i.v., intravenous; ROR1, receptor tyrosine kinase-like orphan receptor 1; s.c., subcutaneous; SMA, smooth muscle actin; TGF, transforming growth factor; UTD, un-transduced T cells.

References

    1. Sterner RC, Sterner RM. CAR-T cell therapy: Current limitations and potential strategies. Blood Cancer J 2021;11:69. 10.1038/s41408-021-00459-7 - DOI - PMC - PubMed
    1. Anderson NM, Simon MC. The tumor Microenvironment. Curr Biol 2020;30:R921–5. 10.1016/j.cub.2020.06.081 - DOI - PMC - PubMed
    1. Kipps TJ. Ror1: an orphan becomes apparent. Blood 2022;140:1583–91. 10.1182/blood.2021014760 - DOI - PMC - PubMed
    1. Baskar S, Kwong KY, Hofer T, et al. . Unique cell surface expression of receptor tyrosine kinase Ror1 in human B-cell chronic lymphocytic leukemia. Clin Cancer Res 2008;14:396–404. 10.1158/1078-0432.CCR-07-1823 - DOI - PubMed
    1. Zhang S, Chen L, Wang-Rodriguez J, et al. . The Onco-embryonic antigen Ror1 is expressed by a variety of human cancers. The American Journal of Pathology 2012;181:1903–10. 10.1016/j.ajpath.2012.08.024 - DOI - PMC - PubMed

Publication types

Substances