. 2024 Apr 12;15(1):3194.
doi: 10.1038/s41467-024-47401-6.

Annelid adult cell type diversity and their pluripotent cellular origins

Affiliations

Annelid adult cell type diversity and their pluripotent cellular origins

Patricia Álvarez-Campos et al. Nat Commun. .

Abstract

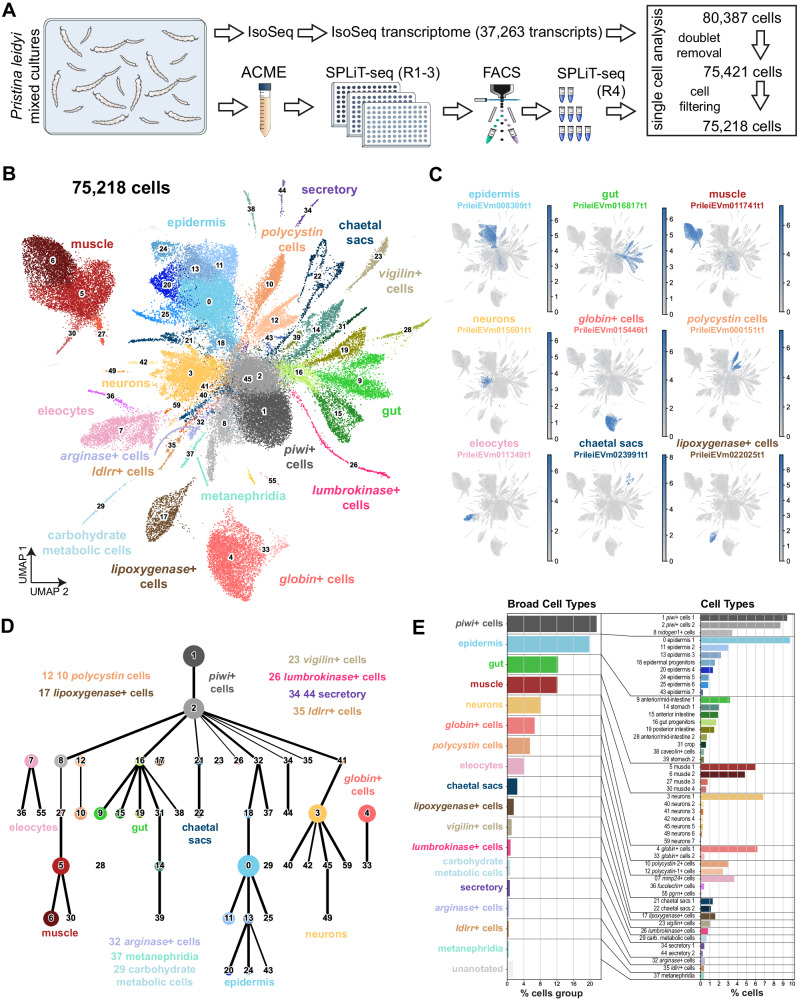
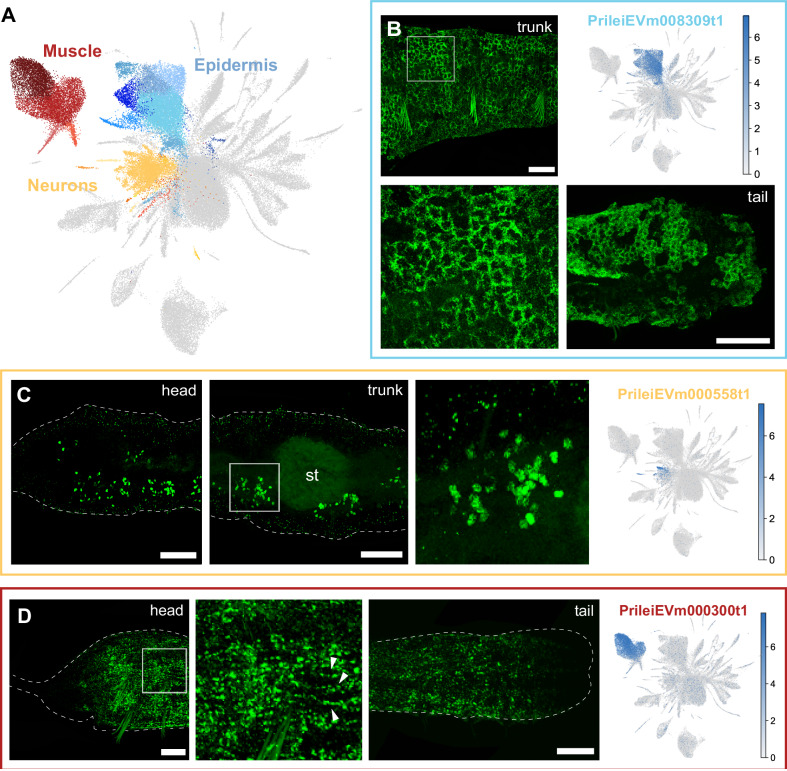
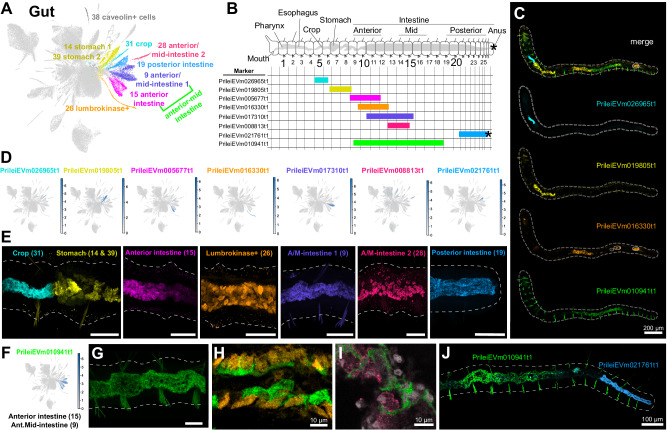
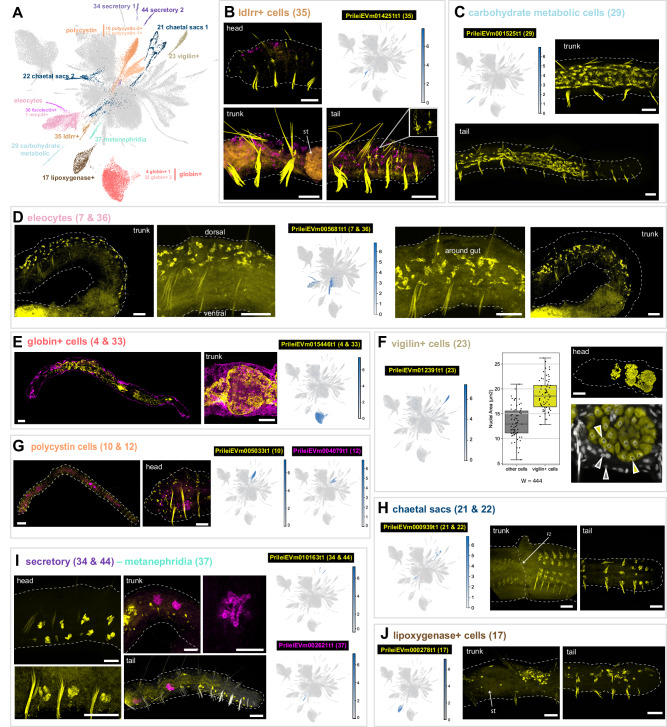
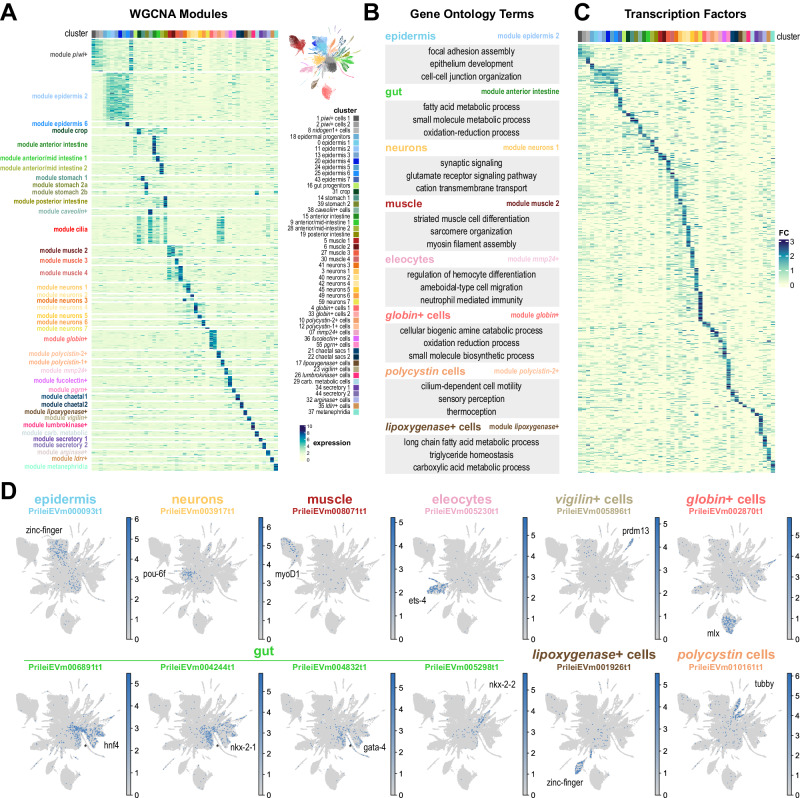
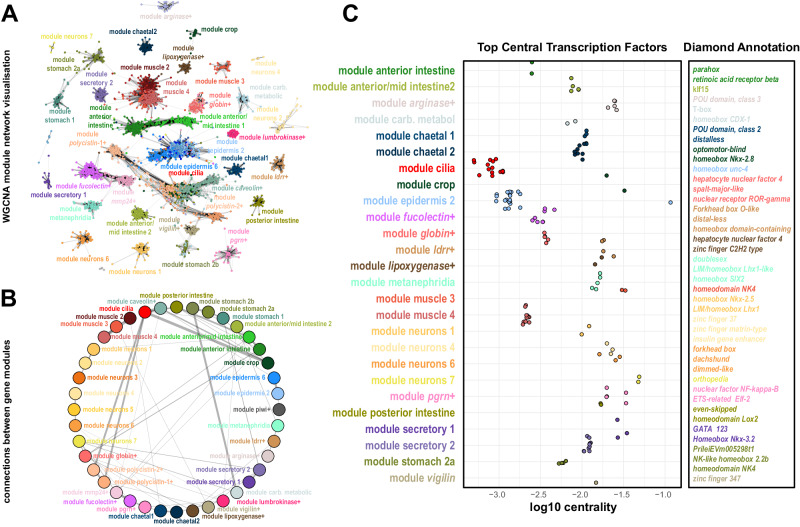
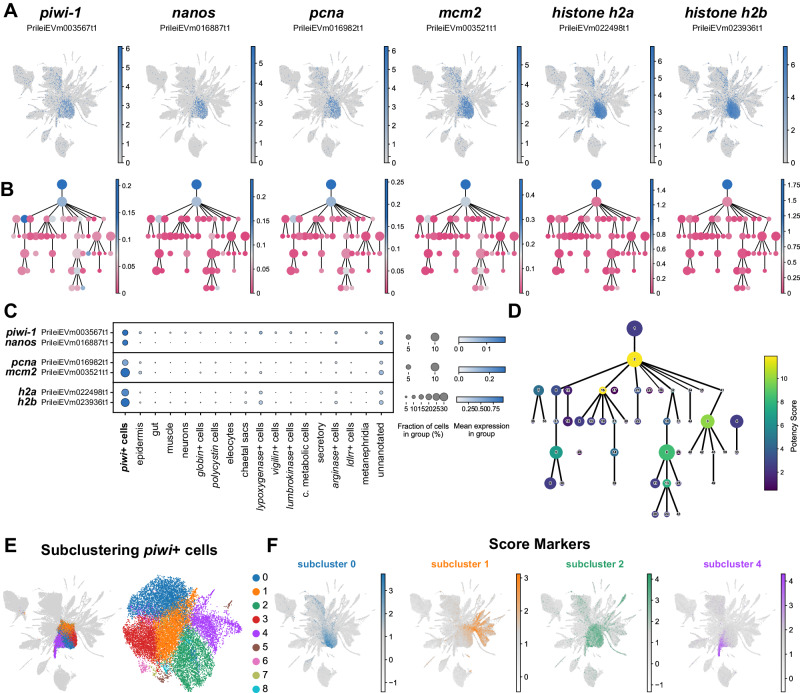
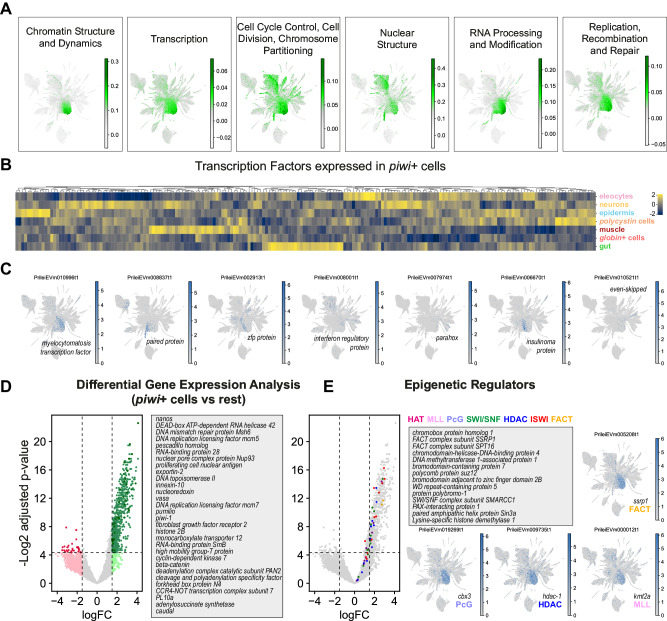
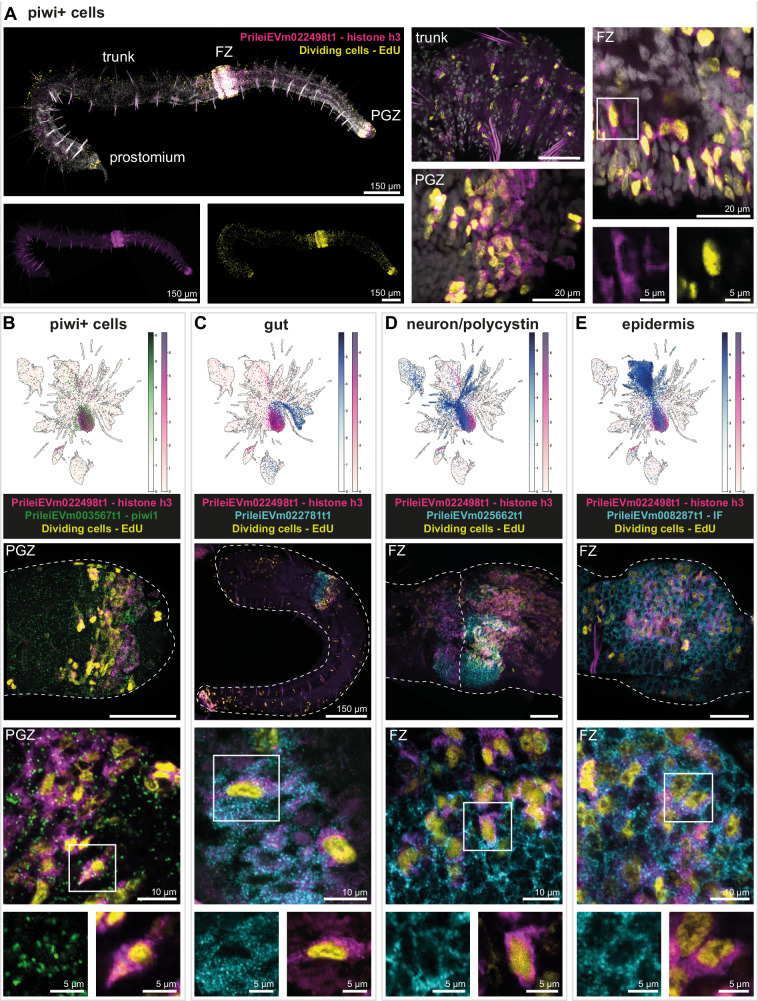
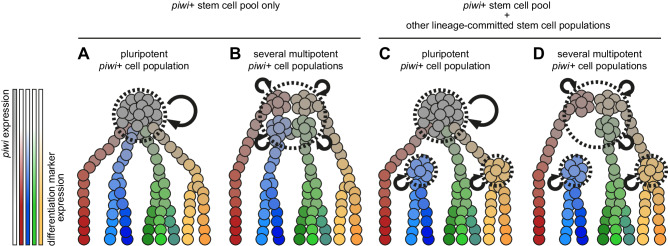
Many annelids can regenerate missing body parts or reproduce asexually, generating all cell types in adult stages. However, the putative adult stem cell populations involved in these processes, and the diversity of cell types generated by them, are still unknown. To address this, we recover 75,218 single cell transcriptomes of the highly regenerative and asexually-reproducing annelid Pristina leidyi. Our results uncover a rich cell type diversity including annelid specific types as well as novel types. Moreover, we characterise transcription factors and gene networks that are expressed specifically in these populations. Finally, we uncover a broadly abundant cluster of putative stem cells with a pluripotent signature. This population expresses well-known stem cell markers such as vasa, piwi and nanos homologues, but also shows heterogeneous expression of differentiated cell markers and their transcription factors. We find conserved expression of pluripotency regulators, including multiple chromatin remodelling and epigenetic factors, in piwi+ cells. Finally, lineage reconstruction analyses reveal computational differentiation trajectories from piwi+ cells to diverse adult types. Our data reveal the cell type diversity of adult annelids by single cell transcriptomics and suggest that a piwi+ cell population with a pluripotent stem cell signature is associated with adult cell type differentiation.


Conflict of interest statement

The authors declare no competing interests.

Figures

Fig. 1
Fig. 1. Single-cell atlas of adult Pristina leidyi annelids.
A Experimental workflow. Cartoon adapted from reference. 44. B UMAP visualisation of the 75,218-cell Pristina leidyi single-cell transcriptomic atlas with clusters coloured according to their cell identity. C Expression plots of markers of the major broad types, including epidermis, gut, muscle, neurons, globin+ cells, polycystin cells, eleocytes, chaetal sacs and lipoxygenase+ cells. D Lineage reconstruction abstracted graph (PAGA) showing the most probable path connecting the clusters. Each node corresponds to a cell cluster identified with the leiden algorithm. The size of nodes is proportional to the amount of cells in the cluster, and the thickness of the edges is proportional to the connectivity probabilities. Nodes are coloured according to their cell identity. E Cell cluster percentages at the broad cell type and the cell type levels.
Fig. 2
Fig. 2. Epidermal, muscle and neuronal clusters in Pristina leidyi.
A – UMAP visualisation highlighting Epidermis (blue), Muscle (red), and Neuron (yellow) clusters. B – In situ HCRs and expression plot of epidermis marker PrileiEVm008309t1, showing extensive signal in the epidermal cells across the body. The bottom left panel is a close-up of the top left panel. C – In situ HCR and expression plot of the neuronal marker PrileiEVm000558t1, showing groups of neuronal cell bodies across the worm’s body. The right microscopy panel is a close-up from the middle microscopy panel. D – In situ HCR and expression plot of the muscle marker PrileiEVm000300t1, showing expression along the worm. The middle microscopy panel is a close-up from the left panel, evidencing muscle fibres (arrowheads). Scale bars are 50 μm unless otherwise specified. All expression patterns displayed in the figure were observed in, at least, 3 different individuals.
Fig. 3
Fig. 3. Gut organisation of Pristina leidyi.
A UMAP visualisation highlighting gut and associated clusters. The colour code matches the colours in the microscopy images. B General distribution of marker expression representing each gut region along the worm (see Supplementary Fig. 7). Cartoon adapted with permission from references. 5 and 69. C Example in situ HCR showing 4 different markers simultaneously, but in distinct regions of the gut (blue, yellow, orange, green). Dashed line indicates the outline of the worm. Circles indicate background signal in the gut. D Expression plots of diverse gut cluster markers. Gene colour code matches the colours of the clusters. E In situ HCR expression of diverse gut cluster markers. All images are lateral views. Note the strict border between the crop and stomach, where there is no co-expression of the markers. F Expression plot of anterior and mid intestine marker PrileiEVm010941t1, with expression in cell clusters 9 and 15. G In situ HCR expression of PrileiEVm010941t1. H In situ HCR expression of PrileiEVm010941t1 (green) and lumbrokinase+ cell marker PrileiEVm016330t1 (orange), showing non overlapping expression in the same gut region. I In situ HCR expression of PrileiEVm010941t1 (green) and anterior/mid-intestine marker PrileiEVm008813t1 (pink), showing non overlapping expression in the same gut region. J In situ HCR expression of PrileiEVm010941t1 and posterior intestine marker PrileiEVm021761t1, showing non overlapping expression in distinct gut regions. In all panels, anterior is left and dorsal is up (unless otherwise noted). Tail in (B) is ventrolateral. Scale bars are 50 μm unless otherwise specified. All expression patterns displayed in the figure were observed in, at least, three different individuals.
Fig. 4
Fig. 4. Annelid specific and novel cell types.
A UMAP visualisation highlighting annelid specific and novel cell types. B In situ HCR and expression plot of the ldlrr+ cell marker (cluster 35) PrileiEVm014251t1, showing signal throughout the whole animal body. Detail of the extensions of ldlrr+ cells is shown in the inset of the tail picture. Magenta counterstaining corresponds to eleocytes and nidogen+ cell marker (clusters 7 and 36) PrileiEVm005681t1. C In situ HCR and expression plot of carbohydrate metabolic cells marker (cluster 29) PrileiEVm001525t1, showing extensive signal in the posterior end of the animal. D In situ HCR and expression plot of eleocyte cell marker (clusters 7 and 36) PrileiEVm005681t1, showing expression in the dorsal area and around the animal’s gut. E In situ HCR and expression plot of globin+ cell marker (clusters 4 and 33) PrileiEVm015446t1, showing expression around the animal’s gut. Magenta staining corresponds to epidermal marker PrileiEVm008309t1. F In situ HCR and expression plot of vigilin+ cell marker (cluster 23) PrileiEVm012391t1, in the anterior part of the animal. Barplot shows nuclei area quantification on a sample size of n = 130, 65 vigilin- nuclei (grey) and 65 vigilin+ nuclei (yellow), examined over 3–5 focal planes in three different animals. Barplot squares represent the median line, and lower and upper quartiles. Whiskers represent sample minimum and maximum values. Median is 12.9 µm2 for vigilin- cells and 18.6 µm2 for vigilin+ cells. A statistical Wilcoxon test (W = 444, p-value = 8.009e−15) indicates significant differences between the two groups. G In situ HCR and expression plots of polycystin cell markers (clusters 10 and 12) PrileiEVm005033t1 and PrileiEVm004079t1, showing the expression of polycystin-2+ cells (yellow) segmentally repeated throughout the body wall of the animal and polycystin-1 + (magenta) only in the anterior region. H In situ HCR and expression plots of chaetal sacs markers (cluster 21 and 22) PrileiEVm000939t1, showing the expression in the fission zone (FZ) and in the tail of the animal. I In situ HCR and expression plots of secretory (cluster 34 and 44) and metanephridia (clusters 37) markers PrileiEVm010163t1 and PrileiEVm002621t1, respectively. Secretory cells are segmentally repeated, mostly ventrally, all along the whole body of the animal. Metanephridia cells show expression in some specific segments of the midbody and posterior regions. J In situ HCR and expression plot of lipoxygenase+ cell marker (cluster 17) PrileiEVm000278t1, showing cell expression in the trunk, around the stomach (st), and posterior parts of the animals. In most panels, anterior is left and dorsal is up, except trunk in (H), which is ventrolateral. All scale bars are 50 μm. All expression patterns displayed in the figure were observed in, at least, three different individuals.
Fig. 5
Fig. 5. The transcriptional landscape of annelid cell type differentiation.
A Expression heatmap of 10,796 genes was classified in 40 WGCNA modules (rows), sorted by cluster expression (columns). Colour intensity indicates normalised expression (z-score). B Summary of Gene Ontology terms associated with example modules. C Expression heatmap of 650 TFs (rows) sorted by cluster expression (columns). Colour intensity indicates expression fold change. D Expression plots of TFs associated with individual cell types or broad types. The asterisks point to key differences between TFs.
Fig. 6
Fig. 6. Network analysis of Pristina gene modules.
A Network visualisation of WGCNA modules using the Fruchterman-Reingold layout algorithm. In this visualisation, each gene is represented as a dot, coloured according to its cluster of highest expression, and edges represent gene coexpression based on WGCNA TOM values (>0.35). 38 out of 40 modules survive this threshold (see Supplementary Note 3). B Module network visualisation summarising coexpression values between different modules, showing associations between different modules. Edge thickness indicates the number of co-expressed genes from different pairs of modules. C Stripplot showing the top central TFs identified in WGCNA modules, and their annotations.
Fig. 7
Fig. 7. Pluripotent stem cell signature of Pristina piwi+ cells.
A Expression plots of stem cell and proliferation markers: piwi, nanos, pcna, mcm2, histone h2a, and histone h2b. B PAGA feature plots of stem cells and proliferation markers in (A). The graph nodes represent the individual cell clusters and the colour intensity, from dark blue (high) to darkish pink (low), represents the expression of each marker. C Dot Plot showing the expression of stem cell and proliferation markers in broad cell types. The colour intensity of the dots represents the mean expression and the size of the dot represents the fraction of cells expressing the marker. Due to the highest expression of histone genes each pair is presented in an individual panel, with its own maximum colour intensity and size. D PAGA plot coloured according to potency score, ranging from dark blue (low) to yellow (high). E UMAP visualisation of the 16,247 cells of piwi+ clusters 1, 2 and 8, in their original UMAP embedding (left) and their subclustering UMAP embedding (right), with clusters coloured according to their cell subcluster classification. F UMAP score plots of markers of piwi+ subclusters 0, 1, 2 and 4, showing differential expression in gut, epidermis, lumbrokinase+, vigilin+ and nidogen+ cell clusters.
Fig. 8
Fig. 8. Transcriptomic profile of annelid piwi+ cells.
A UMAP visualisation of scored gene expression of COGs in piwi+ cells. B Expression heatmap of 200 top TFs expressed in piwi+ cells and their expression in the main broad cell types, showing several clusters of TFs expressed in both piwi+ cells and one or more broad types. C Expression plots of example TFs coexpressed in piwi+ cells and other broad types. D Limma differential gene expression analysis of piwi+ cells (clusters 1, 2 and 8) against all other cell types (bayesian t-statistics from the eBayes limma function, two-sided; adjusted p-values with Benjamini-Hochberg correction). Green colour indicates upregulated genes, red colour indicates downregulated genes. Light colour shade indicates above threshold of logFC, darker colour shade indicates above threshold of logFC and significant (adjusted p-value < 0.05). Examples listed are coloured in darker green. E Detail of annotated epigenetic regulators and their expression enriched in piwi+ cells, and example UMAP visualisations of representative epigenetic factors.
Fig. 9
Fig. 9. In situ HCR expression of proliferation and differentiated cell markers in piwi+ cells.
A In situ HCR expression of piwi+ cells marker PrileiEVm022498t1 (histone h3, magenta) and EdU+ cells (yellow) showing signal throughout the whole animal body. The right microscopy panels are close-ups from different animals, showing overlapping expression in the trunk, fission zone (FZ), and posterior growth zone (PGZ). The bottom right microscopy panel is a close-up from the upper right microscopy panel, evidencing the overlapping expression in a cell in the FZ. All cells were stained with DAPI (grey). B In situ HCR and expression plot of piwi+ markers PrileiEVm022498t1 (histone h3, magenta) and PrileiEVm003567t1 (piwi1, green), and EdU+ cells (yellow), showing extensive signal in the PGZ. The middle and bottom microscopy panels are close-ups from the upper microscopy panel evidencing overlapping expression in the PGZ and at the cellular level. Dashed line indicates the outline of the worm. C In situ HCR and expression plot of piwi+ marker PrileiEVm022498t1 (histone h3, magenta) and gut marker PrileiEVm022781t1 (cyan), and EdU+ cells (yellow), showing expression in the developing gut of the new worm that has just split apart. The middle and bottom microscopy panels are close-ups from the upper microscopy panel evidencing overlapping expression in the gut and at the cellular level. D In situ HCR and expression plot of piwi+ marker PrileiEVm022498t1 (histone h3, magenta) and neural and polycystin marker PrileiEVm025662t1 (cyan), and EdU+ cells (yellow), showing intensive expression in the developing brain in FZ. The middle and bottom microscopy panels are close-ups from the upper microscopy panel evidencing overlapping expression in the developing brain and at the cellular level. E In situ HCR and expression plot of piwi+ marker PrileiEVm022498t1 (histone h3, magenta) and epidermal marker PrileiEVm008287t1 (intermediate filament, cyan), and EdU+ cells (yellow), showing intensive expression in the FZ. The middle and bottom microscopy panels are close-ups from the upper microscopy panel evidencing overlapping expression in the epidermis and at the cellular level. In all panels, anterior is left, dorsal is up. Scale bars are 50 μm unless noted in the figure. All expression patterns displayed in the figure were observed in, at least, three different individuals.
Fig. 10
Fig. 10. Alternative hypotheses of stem cell function in Pristina adult cell type generation.
AD Diagram of 4 alternative models of stem cell function in Pristina. Piwi+ cells are depicted in grey, and differentiation markers are depicted in red, blue, green and yellow. Stem cell populations are shown within dashed lines and self-renewal is represented by curved arrows.

Update of

References

    1. Bely AE. Distribution of segment regeneration ability in the Annelida. Integr. Comp. Biol. 2006;46:508–518. doi: 10.1093/icb/icj051. - DOI - PubMed
    1. Bely AE. Early events in annelid regeneration: a cellular perspective. Integr. Comp. Biol. 2014;54:688–699. doi: 10.1093/icb/icu109. - DOI - PubMed
    1. Gazave E, et al. Posterior elongation in the annelid Platynereis dumerilii involves stem cells molecularly related to primordial germ cells. Dev. Biol. 2013;382:246–267. doi: 10.1016/j.ydbio.2013.07.013. - DOI - PubMed
    1. Kostyuchenko RP, Smirnova NP. Vasa, Piwi, and Pl10 expression during sexual maturation and asexual reproduction in the Annelid Pristina longiseta. J. Dev. Biol. 2023;11:34. doi: 10.3390/jdb11030034. - DOI - PMC - PubMed
    1. Özpolat BD, Bely AE. Gonad establishment during asexual reproduction in the annelid Pristina leidyi. Dev. Biol. 2015;405:123–136. doi: 10.1016/j.ydbio.2015.06.001. - DOI - PubMed

Substances