. 2024 Apr 12;15(1):3178.
doi: 10.1038/s41467-024-47433-y.

Systematic investigation of chemo-immunotherapy synergism to shift anti-PD-1 resistance in cancer

Affiliations

Systematic investigation of chemo-immunotherapy synergism to shift anti-PD-1 resistance in cancer

Yue Wang et al. Nat Commun. .

Abstract

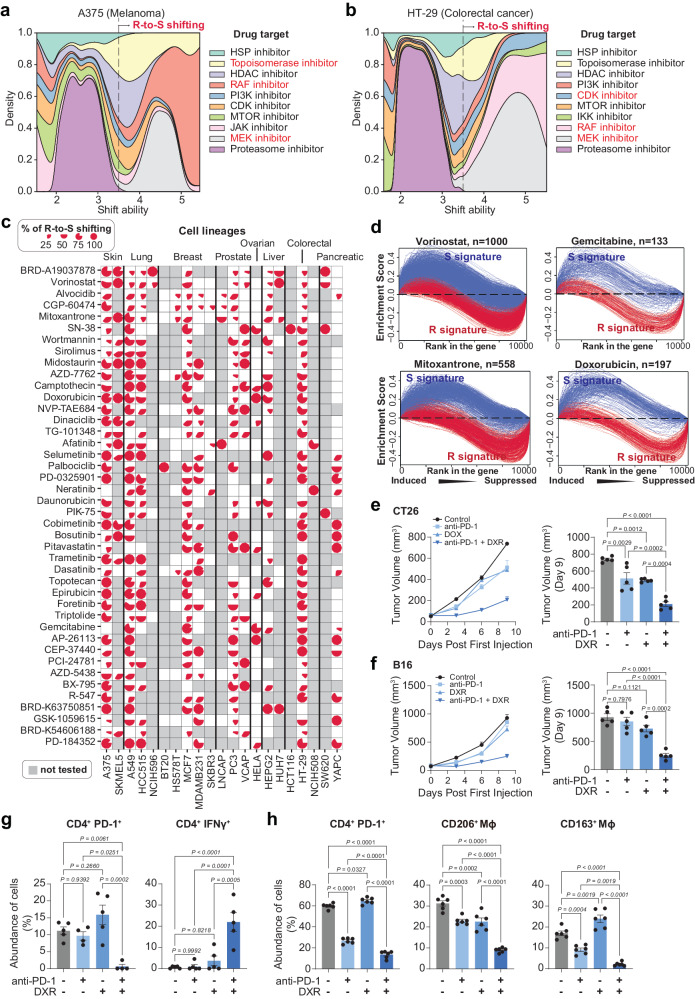
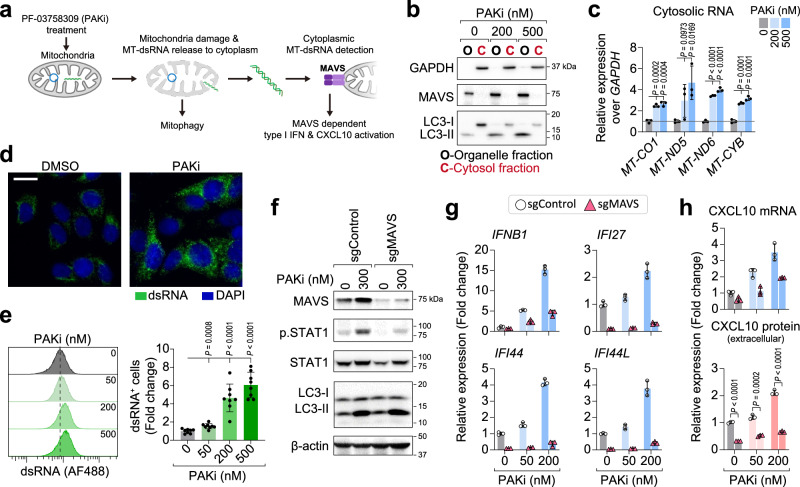
Chemo-immunotherapy combinations have been regarded as one of the most practical ways to improve immunotherapy response in cancer patients. In this study, we integrate the transcriptomics data from anti-PD-1-treated tumors and compound-treated cancer cell lines to systematically screen for chemo-immunotherapy synergisms in silico. Through analyzing anti-PD-1 induced expression changes in patient tumors, we develop a shift ability score to measure if a chemotherapy or a small molecule inhibitor treatment can shift anti-PD-1 resistance in tumor cells. By applying shift ability analysis to 41,321 compounds and 16,853 shRNA treated cancer cell lines transcriptomic data, we characterize the landscape of chemo-immunotherapy synergism and experimentally validated a mitochondrial RNA-dependent mechanism for drug-induced immune activation in tumor. Our study represents an effort to mechanistically characterize chemo-immunotherapy synergism and will facilitate future pre-clinical and clinical studies.


Conflict of interest statement

The authors declare no competing interests.

Figures

Fig. 1
Fig. 1. Robust treatment-induced expression changes associated with anti-PD-1 response in melanoma patients.
a Receiver operating characteristic (ROC) curve showing the performance of using treatment-naïve (gray) or treatment-induced (red) expression to classify anti-PD-1 responders and non-responders. The kernel density estimation plot shows the distribution of patient response groups on the first principal component of treatment-naïve expression (upper) or treatment-induced expression (lower) (n = 42). Source Data are provided as Supplementary Data 1. b Expression correlation between 419 Resistance signature genes and 366 Sensitivity signature genes in melanoma patients (n = 42). Colormap represents the correlation coefficient given by Pearson’s correlation. Source Data are provided as Supplementary Data 1. c Integrating R and S signature to classify anti-PD-1 responders and non-responders in training cohort (GSE91061). Patients are ranked in descending order based on signature score, which is given by the difference of enrichment score between S signature and R signature. Colors of the bar indicate the anti-PD-1 response group. Source Data are provided as Supplementary Data 1. d Validation of R and S signature in two independent validation cohorts. Patients are ranked in descending order based on signature score, which is given by the difference of enrichment score between S signature and R signature. Colors of the bar indicate the anti-PD-1 response group. Source Data are provided as Supplementary Data 1. e Receiver operating characteristic (ROC) curve summarizing the performance of using R and S signatures to classify anti-PD-1 responders and non-responders. Training set, n = 31; Leave-out validation set, n = 11; MGH cohort, n = 14; PRJEB23709 cohort, n = 17. Source Data are provided as Supplementary Data 1. f GO Biological Process: Pathway enrichment of genes involved in S signature. X-axis represents adjusted P value derived from gene set enrichment analysis. The enrichment P value is given by the “enrichr” function in GSEA. g GO Biological Process: Pathway enrichment of genes involved in R signature. X-axis represents adjusted P value derived from gene set enrichment analysis. The enrichment P value is given by the “enrichr” function in GSEA.
Fig. 2
Fig. 2. Genetic inhibition of genes in R and S signature can shift immunotherapy response phenotypes.
a Graph demonstration of R and S signature enrichment and shift ability analysis. b Number of R genes and S genes that are being targeted by shRNAs in Connectivity Map. c Distribution of shift ability score of shRNAs targeting R signatures (shR) or S signatures (shS) across different cell lines. P values (two-sided) are given by two sample KS test. Source Data are provided as Supplementary Data 3. d Number of R (top) or S (bottom) targeting shRNAs that are able to knock down the target genes (shX w/KD), to suppress the target signature (X sig suppression), and to induce R (S) to S (R) shifting. Source Data are provided as Supplementary Data 3. e Suppression of R signature (above) and induction of S signature (bottom) by R-targeting shRNAs. Colormap indicates the normalized enrichment score of corresponding signatures in each experiment. The size of triangles represents the shRNA-induced target gene expression changes compared to other experiments in the same panel. Direction of triangles indicates the direction of expression changes. Source Data are provided as Supplementary Data 3. f Definition of significant shifting based on the shift ability distribution of signature-targeting shRNAs. g Top R-to-S shifting shRNAs that shared across multiple cell lines. Source Data are provided as Supplementary Data 3. h List of shRNAs with highest R-to-S shifting ability. Source Data are provided as Supplementary Data 3. i Treatment-induced expression changes of selected shRNA target genes in anti-PD-1 treated patient cohorts (non-responders, n = 18; responders, n = 24). P values (two-sided) are given by two sample student’s t test. Center lines represent median treatment-induced expression changes, the box limit indicates the lower quantile and upper quantile, and whiskers represent the minimal and maximal treatment-induced expression changes.
Fig. 3
Fig. 3. Shift ability analysis on compound-treated transcriptomes identified the landscape of chemo-immunotherapy synergism.
a Stacked density plot of top R-to-S shifting drug targets in A375 melanoma cell line. X-axis indicates shift ability. The Y-axis indicates density. Red-highlighted text indicates the major drug targets in significant R-to-S shifting range (shift ability >= 3.5). Source Data are provided as Supplementary Data 4. b Stacked density plot of top R-to-S shifting drug targets in HT29 colorectal cell line. X-axis indicates shift ability. The Y-axis indicates density. Red-highlighted text indicates the major drug targets in significant R-to-S shifting range (shift ability >= 3.5). Source Data are provided as Supplementary Data 4. c Compounds that showed R-to-S shifting in multiple cell lines. Pie charts in each cell indicate the percentage of experiments showed a R-to-S shift ability. The bar plot on the right side of the pie matrix indicates the number of cell lines where the compounds showed R-to-S shifting in at least one experiment. Untested cell lines are shaded by gray. Source Data are provided as Supplementary Data 4. d Enrichment curves of R signature and S signature in vorinostat, gemcitabine, mitoxantrone or doxorubicin treated cell lines. e CT26 tumor volume (n = 5 mice) changes and tumor volume on Day 9 in mice following treatment with anti-PD-1, doxorubicin (DXR) and combination of anti-PD-1 with DXR. f B16 tumor volume (n = 5 mice) changes and tumor volume on Day 9 in mice following treatment with anti-PD-1, DXR and combination of anti-PD-1 with DXR. g Single-cell suspensions were prepared from B16 melanoma samples (n = 5 mice) and subjected to flow cytometry analysis including CD4+ PD-1+ T cells (left panel) and CD4+ IFNγ+ T cells (right panel). h MyC-CaP prostate cancer samples (n = 6 mice) infiltrated immune cells analysis including CD4+ PD-1+ T cells (left panel), CD206+ macrophages (middle panel) and CD163+ macrophages (right panel). Data in (eh) are presented as mean ± SEM, P values were generated using one-way ANOVA with Tukey’s post hoc test for comparison.
Fig. 4
Fig. 4. Integrating shift ability analysis on genetic and pharmacological inhibition identified drug targets for chemo-immunotherapy synergism.
a Prioritized drug targets for chemo-immunotherapy synergism. Drug names showed beside the gene targets are their corresponding pharmacological inhibitors. Circles indicate the shift ability of shRNAs. Triangles indicate the shift ability of compound treatment. Bar plots on the right side of the strip plot showed the number of TCGA cancer types where the corresponding genes have significantly positive (red) or negative (blue) correlation (Pearson’s) with different anti-tumor immunity signatures. Source Data are provided as Supplementary Data 5. Enrichment curves of R signature and S signature in PAK4 knockdown (b) and PAK4 inhibitor treated (c) cell lines (A375). d Pearson’s correlation between PAK4 expression and immune cell infiltration in TCGA samples (ACC, n = 79; BLCA, n = 411; BRCA, n = 1097; CESO, n = 304; COAD, n = 467; DLBC, n = 48; GBM, n = 154; HNSC, n = 500; KICH, n = 65; KIRP, n = 288; LGG, n = 510; LIHC, n = 371; LUAD, n = 524; LUSC, n = 501; OV, n = 374; PRAD, n = 498; READ, n = 166; SKCM, n = 367; STAD, n = 375; THCA, n = 502; UCEC, n = 547; UCS, n = 56). e Treatment-induced expression changes of PAK4 in patients before and after anti-PD-1 therapy (GSE91061, non-responders, n = 18, responders, n = 24; MGH cohort, non-responders, n = 10, responders, n = 4; PRJEB23709 cohort, non-responders, n = 7, responders, n = 10). Center lines represent median treatment-induced expression changes, the box limit indicates the lower quantile and upper quantile, and whiskers represent the minimal and maximal treatment-induced expression changes.
Fig. 5
Fig. 5. PAK inhibitor can induce mitophagy and immune response in cancer cells.
a Treatment induced expression analyses reveal mechanisms of chemo-immunotherapy synergisms. Source Data are provided as Supplementary Data 6. b Immunoblotting analysis of LC3 protein in cancer cells after 48 h of PF-03758309 (PAKi) treatment. The heat map (Right) indicates fold change of LC3-I and LC3-II band intensity, normalized to respective β-actin, DMSO served as a no-treatment control (NT). Experiments were repeated twice and obtained similar results. c, d PAKi treatment induces mitophagy in MCF7 cells. c Representative florescence microscopic images of MCF7 cells (24 h) labeled with mitophagy and lysosome dye, scale bar: 20 µm. Two independent experiments were performed and obtained similar results. d Flow cytometry detection of mitophagy in MCF7 cells, n = 5 biologically independent samples. e Pearson’s correlation between dosage and immunity signatures induction of PAK4 inhibitor PF-03758309 in multiple cancer cell lines. f, g qPCR validation of antigen presenting, processing genes (f), and interferon stimulated genes (g) in MCF7 cells after 48 h of PAKi treatment (200 nM). 0 nM or vehicle served as control, n = 3 technical replicates. Two independent experiments were performed and obtained similar results. h, i CXCL10 expression detected by qPCR (h) and ELISA (i) in cancer cells after 48 h of PAKi treatment. n = 3 technical replicates (h), biologically independent samples (i). j PAKi treatment induces PD-L1 expression in cancer cells (48 h). n = 3 technical replicates. Concentration of PAKi used in (hj): 0, 50, 200 and 500 nM for MCF7, MDA-MB-468, A549, PC3, and HT-29; 0, 2, 50 and 500 nM for MEL-526 cells. Data in (d) and (fj) are presented as mean ± SD, P values in (d, i) were generated using a two-tailed Student’s t test. Source data are provided as a Source Data file.
Fig. 6
Fig. 6. PAK inhibitor-induced immune responses are mediated by mtRNA-dsRNA-MAVS.
a Schematic of PAKi induced mtRNA release and dsRNA-MAVS pathway. b Immunoblots express the purity of fractions from MCF7 cells treated with PAKi for 48 h. Cytosolic protein markers: GAPDH, LC3-I; organelle bound protein markers: MAVS, LC3-II. c qPCR analysis of mtRNAs in cytosol fractions from MCF7 cells treated with PAKi for 48 h. n = 3 biologically independent samples. d PAKi treatment induces dsRNA accumulation in MCF7 cells. Immunofluorescence analysis in 24 h DMSO or PF-03758309 treated MCF7 cells, Scale bar: 20 µm. e PAKi treatment induces dose-depended dsRNA expression in MCF7 cells (24 h). n = 8 biologically independent samples. f Immunoblotting analysis in MCF7 sgControl and sgMAVS cells after 48 h of PAKi treatment. g qPCR analysis of IFNB1 and interferon stimulated genes in MCF7 sgControl and sgMAVS cells after 48 h of PAKi treatment, n = 3 technical replicates. h CXCL10 expression detected by qPCR (top) and ELISA (bottom) in MCF7 sgControl and sgMAVS after 48 h of PAKi treatment. n = 3 technical replicates (top), biologically independent samples (bottom). Three (b, c) and two (dh) independent experiments were performed and obtained similar results. Data in (c, e, g, h) are presented as mean ± SD, P values in (c, e, h) were generated using a two-tailed Student’s t test. Source data are provided as a Source Data file.

Update of

References

    1. Iwai Y, et al. Involvement of PD-L1 on tumor cells in the escape from host immune system and tumor immunotherapy by PD-L1 blockade. Proc. Natl. Acad. Sci. USA. 2002;99:12293–12297. doi: 10.1073/pnas.192461099. - DOI - PMC - PubMed
    1. Ribas A, et al. Association of Pembrolizumab with tumor response and survival among patients with advanced melanoma. JAMA. 2016;315:1600–1609. doi: 10.1001/jama.2016.4059. - DOI - PubMed
    1. Schadendorf D, et al. Pooled analysis of long-term survival data from Phase II and Phase III trials of Ipilimumab in unresectable or metastatic melanoma. J. Clin. Oncol. 2015;33:1889–1894. doi: 10.1200/JCO.2014.56.2736. - DOI - PMC - PubMed
    1. Brahmer J, et al. Nivolumab versus Docetaxel in advanced squamous-cell non–small-cell lung cancer. N. Engl. J. Med. 2015;373:123–135. doi: 10.1056/NEJMoa1504627. - DOI - PMC - PubMed
    1. Smith KM, Desai J. Nivolumab for the treatment of colorectal cancer. Expert Rev. Anticancer Ther. 2018;18:611–618. doi: 10.1080/14737140.2018.1480942. - DOI - PubMed