. 2024 Apr 12;15(1):3173.
doi: 10.1038/s41467-024-47424-z.

Semmaphorin 3 A causes immune suppression by inducing cytoskeletal paralysis in tumour-specific CD8+ T cells

Affiliations

Semmaphorin 3 A causes immune suppression by inducing cytoskeletal paralysis in tumour-specific CD8+ T cells

Mike B Barnkob et al. Nat Commun. .

Erratum in

Abstract

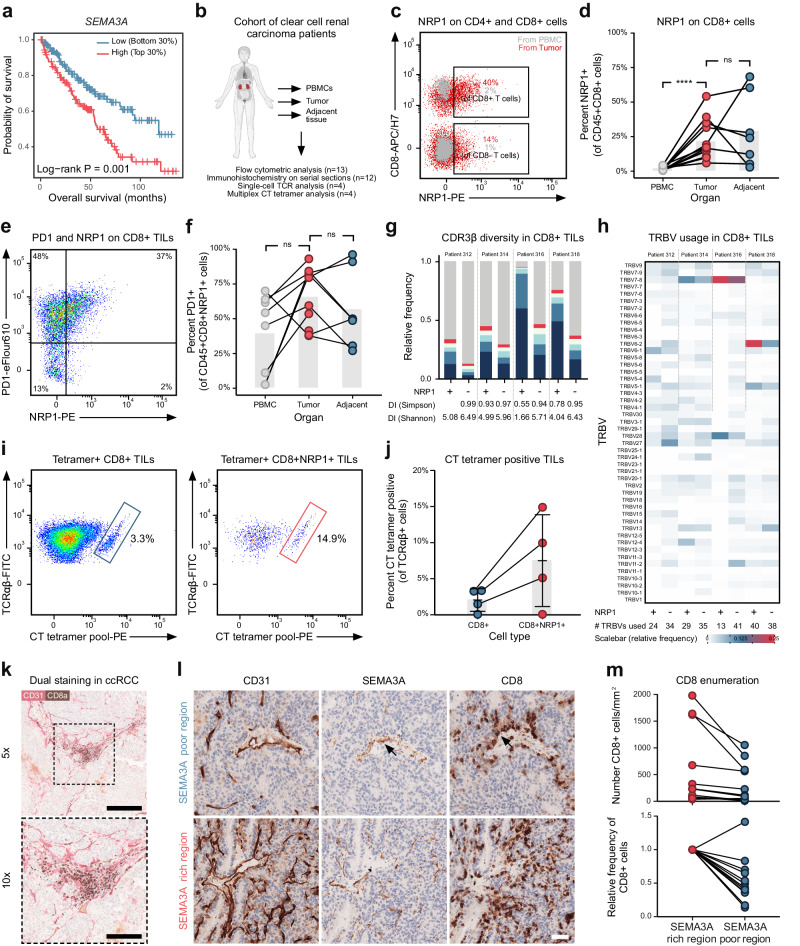
Semaphorin-3A (SEMA3A) functions as a chemorepulsive signal during development and can affect T cells by altering their filamentous actin (F-actin) cytoskeleton. The exact extent of these effects on tumour-specific T cells are not completely understood. Here we demonstrate that Neuropilin-1 (NRP1) and Plexin-A1 and Plexin-A4 are upregulated on stimulated CD8+ T cells, allowing tumour-derived SEMA3A to inhibit T cell migration and assembly of the immunological synapse. Deletion of NRP1 in both CD4+ and CD8+ T cells enhance CD8+ T-cell infiltration into tumours and restricted tumour growth in animal models. Conversely, over-expression of SEMA3A inhibit CD8+ T-cell infiltration. We further show that SEMA3A affects CD8+ T cell F-actin, leading to inhibition of immune synapse formation and motility. Examining a clear cell renal cell carcinoma patient cohort, we find that SEMA3A expression is associated with reduced survival, and that T-cells appear trapped in SEMA3A rich regions. Our study establishes SEMA3A as an inhibitor of effector CD8+ T cell tumour infiltration, suggesting that blocking NRP1 could improve T cell function in tumours.


Conflict of interest statement

The authors declare the following competing interests: M.B.B. has received consulting honorariums from Janssen, Roche and Kite/Gilead, unrelated to the present work. Y.S.M. has consulted for Apiary Therapeutics, Notch Therapeutics and CCRM, unrelated to the present work. The remaining authors declare no competing interests.

Figures

Fig. 1
Fig. 1. Tumor-specific CD8+ T cells upregulate NRP1 and Plexin-A1 allowing for SEMA3A binding.
a, b Representative histogram of flow cytometric analysis of surface NRP1 expression on human NY-ESO-1-specific HLA-A2 restricted CD8+ T cells and mouse OT-I CD8+ T cells following 48 h stimulation with cognate peptides. Cells are gated on CD45, CD8 and TCRβ. Experiment repeated three times. c Analysis of NRP1 upregulation using peptides with varying TCR affinities. Cells are gated on CD45.1, CD8 and TCRβ. Cells from 3 mice per group, experiment was performed once. d Quantification of surface binding of SEMA3AS-P on naïve and 48 h stimulated OT-I T cells. Cells are gated on CD8 and CD3. Experiment was repeated three times. e Confocal imaging of 48 h stimulated OT-I T cells stained with AF647-labeled SEMA3AS-P shows that the protein can bind to the cell membrane (white arrow) and within the cell (black arrow). Scale bar = 10 μm. Representative of two independent experiments. f Flow cytometric analysis of PD-1 and NRP1 expression on OT-I T cells 11 days after adoptive transfer in spleen, non-antigen expressing tumor (B16.F10) and antigen-expressing tumor (B16.F10.Ova) (n = 6 mice). Data representative of two independent experiments. g Schematic of NRP1 interactions partners (left). Flow cytometric analysis of expression of selected NRP1 interactions partners on OT-I T cells 11 days after adoptive transfer (n = 5 mice) (right). Experiment was performed once. Abbreviations: gMFI, geometric mean fluorescence intensity. N4, SIINFEKL. Q4, SIIQFEKL. T4, SIITFEKL. SD, standard deviation. Error bars are means ± SD (c, d, f, g) from representative experiments. Source data are provided as a Source Data file.
Fig. 2
Fig. 2. NRP1-deficiency enhances anti-tumor migration and activity of CD8+ T cells.
a Growth curve of B16.F10 cells in Cd4Cre Nrp1+/+, Nrp1Flox/+ and Nrp1Flox/Flox mice (left) and Kaplan-Meier survival curve (right). Dashed lines indicate growth in individual mice, bold line average for group (n = 3–6 mice per group). b Growth curve of LL/2 cells in Cd4Cre Nrp1+/+, Nrp1Flox/+ and Nrp1Flox/Flox mice (left) and Kaplan–Meier survival curve (right). c Growth curve of B16.F10 cells in Cd4Cre Nrp1Flox/+ and Nrp1Flox/Flox mice pre-treated with either anti-CD8 antibody or isotype control. d Enumeration of CD4+ and CD8+ T cells infiltrated into B16.F10 tumors in Cd4Cre Nrp1+/+, Nrp1Flox/+ and Nrp1Flox/Flox mice (n = 6 per group). e Expression levels of activation and exhaustion markers on CD8+ T cells within the tumor 15 days post injection (n = 3–6 in Nrp1Flox/Flox group, 6 in Nrp1Flox/+ group and 4–7 in Nrp1+/+ group). f Experimental setup of mixed bone marrow chimeras in C57BL/6 mice (left) and subsequent enumeration of CD8+ T cells in mice (middle graph). Ratio of CD8+ T cells from Cd4Cre Nrp1Flox/Flox to Nrp1Flox/+ bone marrow derived cells (right graph) (n = 6 mice per group). g Experimental setup using B16.F10 Sema3a KO or Sema3a OE cells (left) and growth curve of cells in untreated mice (right) (n = 8 mice). h Growth curve of B16.F10 Sema3a KO or Sema3a OE cells using similar experimental setup as in (f), but with OT-I treatment at day 7 post-injection (n = 6 mice per group). i Enumeration of OT-I T cells in tumors (left graph) and their ratio of cells, normalized to the number in the B16.F10 Sema3a KO tumor (right) from same experiment as in (g). Abbreviations: ns, not significant. Error bars are means ± SD from 1 (b, di), or combined from 2 (c, e) and 4 (a) independent experiments. *P = 0.0312 (f), P = 0.043 (i), **P = 0.0041 (b), P = 0.0091 (c), P = 0.0072 (d), P = 0.008 (h), ****P < 0.0001 (a) by two-way ANOVA (ad, g, h) or one-way ANOVA (E) or two-tailed paired t-test (f, i). Source data are provided as a Source Data file.
Fig. 3
Fig. 3. SEMA3A negatively regulates CD8+ T cell adhesion, motility and migration through NRP1.
a Representative brightfield and IRM images of stimulated OT-I T cells adhering to ICAM-1/CXCL12 coated plates with either SEMA3AS-P or IgG. Scale bar = 20 μm. b Contact area per single OT-I T cell. Representative of three independent experiments. c Frequency of cell polarity from brightfield images. A polarity of 1 indicates a shape of a perfect circle, 0 a rectangular shape. Representative images of OT-I T cells illustrated above graph. d Spider plots showing the migration paths of T cells pre-treated with either NRP1 blocking antibody or isotype control antibody on similar plates as in (a). Scale bar = 100 μm. e Single cell distance (left) and single cell velocity (right) from same experiment as (d) (n = 380 cells for IgG and isotype control, 314 cells for IgG and anti-NRP1, 744 cells for Sema3A and isotype control, anf 403 for Sema3A and anti-NRP1). f Spider plots showing the migration path of OT-I T cells on ICAM-1/CXCL12 coated flow cells as in (a), with flow rates at 0 or 80 μm/s. Arrows indicate flow direction. Scale bar = 50 μm. g Percent of OT-I cells that detach in same experiment as (f) (n = 19 cells with control IgG and 73 cells with Sema3A). Representative of two independent experiments. h Number of stimulated OT-I T cells from individual mice (n = 3) able to transmigrate through 3 μm Boyden chamber in indicated conditions. OT-I T cells were pre-treated with either a blocking NRP1 antibody or isotype control antibody. Data representative of two independent experiments. Abbreviations: ns, not significant. Error bars are means ± SEM (b, g) or SD (e, h) from representative experiments (b, h) or combined from 2 (g) and 5 (e) independent experiments. *P = 0.04 (g), **P = 0.003 (g), ****P < 0.0001 (b, e, g, h) by two-tailed Student’s t-test (b), two-way ANOVA (e, g) or one-way ANOVA (h). Source data are provided as a Source Data file.
Fig. 4
Fig. 4. SEMA3A negatively regulates CD8+ T cell immunological synapse formation.
a Live-cell imaging visualizing surface interface using IRM of stimulated CD8+ T cells dropped onto an activating surface with immobilized ICAM-1 and CD3 and SEMA3AS-P or IgG present in medium (left). Cell contour of representative cells from either condition (right). Color of contour indicates time from 0 to 200 sec as denoted on colorbar. Scale bar = 10 μm. b Quantification of maximum size of cell contact area (top) and spreading speed from initial contact to maximum contact area (bottom) (n = 25 cells per group) in same experiment as (a). c Live-cell imaging of activated T cells pre-treated with SEMA3AS-P-I-AF647 and allowed to form synapses on supported lipid bilayers with ICAM-1, CD80 and H-2Kb-SIINFEKL. Arrows in merged image indicate cells that have bound SEMA3A and do not form immunological synapses. Scale bar = 10 μm. Experiment performed once. d Representative image from high-throughput analysis of immunological synapses on supported lipid bilayers as in (c) with OT-I T cells pre-treated with SEMA3A or not. Scale bar = 30 μm. e Quantification of immunological synapses with or without SEMA3AS-P-I pre-treated OT-I T cells. (n = 90–1100 cells per mouse per group). Abbreviations: IRM, interference reflection microscopy. Sec seconds. Error bars are means ± SD combined from 3 (b) and 6 (e) independent experiments. **P = 0.0011 (b), P = 0.0042 (E, left), P = 0.0039 (E, right), ***P = 0.0002 (B) by two-tailed Mann–Whitney test (b) or two-tailed paired t-test (e). Source data are provided as a Source Data file.
Fig. 5
Fig. 5. SEMA3A affects T cell actin dynamics through actomyosin II.
a Representative flow cytometric analysis of F-actin content with varying exposure to SEMA3AS-P in stimulated OT-I T cells. b, c Representative brightfield (b) or confocal (c) images of stimulated LifeAct OT-I T cells adhering to ICAM-1/CD3 coated plates before and after SEMA3AS-P added to medium. Color of contour (c—right) indicates time from 0 to 300 s. Dashed white line indicate area used for (d). Scale bar = 10 μm. Independently performed three times. d Kymograph before (top) and after (bottom) SEMA3AS-P added. Dotted line denote data used for calculating (e). e F-actin velocity at cell edge before and after treatment with either SEMA3AS-P, Jasplakinolide or mutant SEMA3A (n = 33 cells in SEMA3AS-P group, n = 27 in Jasplakinolide group, and n = 24 in mutant SEMA3A group). f Intensity plot of LifeAct signal before and after SEMA3AS-P treatment of a OT-I T cell (left) or multiple cells exposed to SEMAAS-P (right) (n = 28 cells). g Cell width dynamics like (f) before (white background) or after (gray background) SEMA3AS-P, Jasplakinolide or mutant SEMA3A addition. h IRM area of OT-I T cells (gray lines) and average (red line) over time, with no treatment (leftmost white background), under treatment with SEMA3A (gray background) and Blebbistatin (rightmost white background). Representative contour plots of single cell under different treatments above, with color denoting time (150 sec total). I IRM area of individual OT-I T cells and contour plots as in (h), but with treatment with Blebbistatin (gray background) before SEMA3AS-P (rightmost white background). Abbreviations: A.U. arbitrary units, Min minutes, ns, not significant. Sec seconds, t time. Error bars are means ± SD from 1 (f) or combined from 2 (a) and 3 (e, h, i) independent experiments. *P = 0.016 (i), **P = 0.0011 (f), ***P < 0.0002 (H), ****P < 0.0001 (e, h) by two-tailed paired t-test (f) or Students t-test at time-points 90, 270 and 450 sec (h, i). Source data are provided as a Source Data file.
Fig. 6
Fig. 6. CD8+ TILs express NRP1 and are captured in SEMA3A rich areas in ccRCC tumors.
a Correlation of SEMA3A mRNA level with survival of ccRCC patients. b Schematic representing ccRCC patient cohort utilized in (cm). c Representative flow cytometric analysis of CD8 and NRP1 expression in PBMC and TILs. d NRP1 expression on CD8+ T cells in PBMC, tumor and tumor-adjacent tissue (n = 12 samples from PBMC, 13 from tumor and 7 from tumor-adjacent tissue). e Representative flow cytometric analysis of PD1 and NRP1 on CD8+ TIL. f PD1 expression on NRP1 positive CD8+ T cells in PBMC, tumor and tumor-adjacent tissue (n = 8 samples from PBMC, 10 from tumor and 7 from tumor-adjacent tissue). g CDR3β diversity in NRP1 positive (+) and negative (-) CD8+ TILs (n = 4). Colored bars represent the five most abundant clonotypes, gray bars the remaining sequences. h Heatmap of TRBV usage in NRP1 positive (+) and negative (-) CD8+ TILs (n = 4). Color indicates relative usage within all of individual patients. i Representative flow cytometric analysis of TCRαβ and CT tetramer positive CD8+ TILs (left) and NRP1+ CD8+ TILs (right). j Percentage CT tetramer positive NRP1+ and NRP1- CD8+ TILs. k Representative CD8 and CD31 staining in ccRCC. Dashed area indicates zoom area in bottom image. Scale bar = 500 μm (top) and 250 μm (bottom). l Representative CD31, SEMA3A and CD8 staining in SEMA3A poor region (top row) and SEMA3A rich region (bottom row). Arrows indicate association between SEMA3A and CD8 staining. Scale bar = 50 μm. m Enumeration of CD8+ TILs in SEMA3A rich and poor regions (n = 12). Abbreviations: CT cancer testis, DI diversity indices. ns not significant. SA Shannon index, SI Simpson index. TIL tumor-infiltrating lymphocytes. TCGA The Cancer Genome Atlas, TRBV TCR beta chain variable. Error bars are means ± SD. ****P < 0.0001 by two-way ANOVA (d, f). Source data are provided as a Source Data file.

References

    1. Joyce JA, Fearon DT. T cell exclusion, immune privilege, and the tumor microenvironment. Science. 2015;348:74–80. doi: 10.1126/science.aaa6204. - DOI - PubMed
    1. Ochoa de Olza M, Navarro Rodrigo B, Zimmermann S, Coukos G. Turning up the heat on non-immunoreactive tumours: opportunities for clinical development. Lancet Oncol. 2020;21:e419–e430. doi: 10.1016/S1470-2045(20)30234-5. - DOI - PubMed
    1. Molon B, et al. Chemokine nitration prevents intratumoral infiltration of antigen-specific T cells. J. Exp. Med. 2011;208:1949–1962. doi: 10.1084/jem.20101956. - DOI - PMC - PubMed
    1. Spranger S, et al. Up-regulation of PD-L1, IDO, and tregs in the melanoma tumor microenvironment is driven by CD8+ T cells. Sci. Transl. Med. 2013;5:200ra116–200ra116. doi: 10.1126/scitranslmed.3006504. - DOI - PMC - PubMed
    1. Mariathasan S, et al. TGFβ attenuates tumour response to PD-L1 blockade by contributing to exclusion of T cells. Nature. 2018;554:544–548. doi: 10.1038/nature25501. - DOI - PMC - PubMed