. 2024 Apr 12;7(1):84.
doi: 10.1038/s42004-024-01161-y.

Predicting permeation of compounds across the outer membrane of P. aeruginosa using molecular descriptors

Affiliations

Predicting permeation of compounds across the outer membrane of P. aeruginosa using molecular descriptors

Pedro D Manrique et al. Commun Chem. .

Abstract

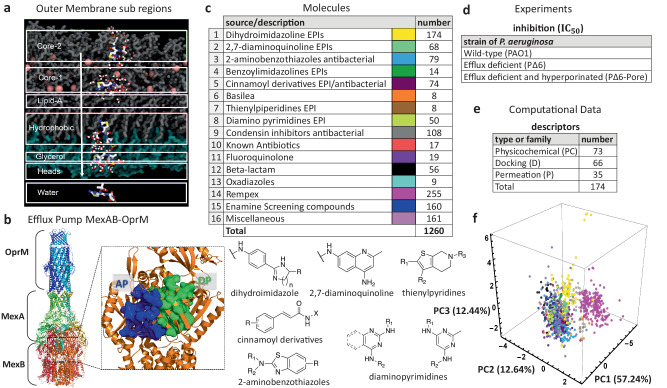
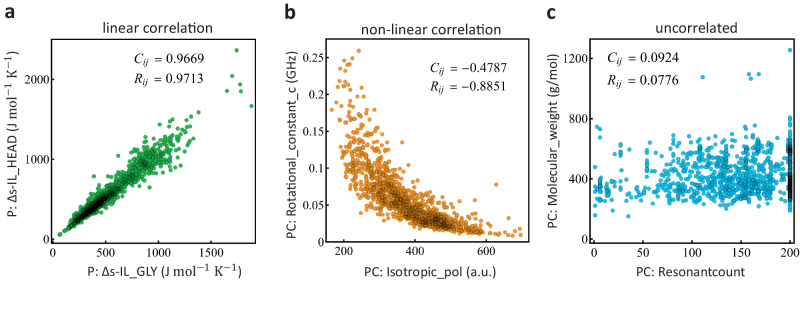
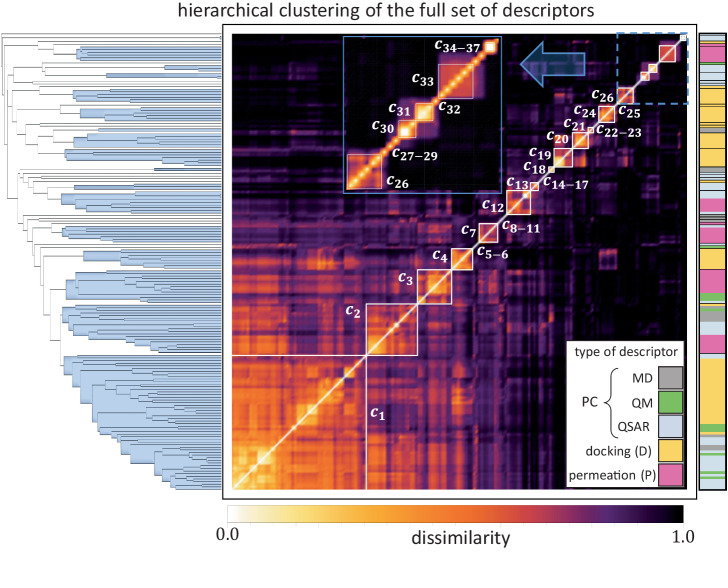
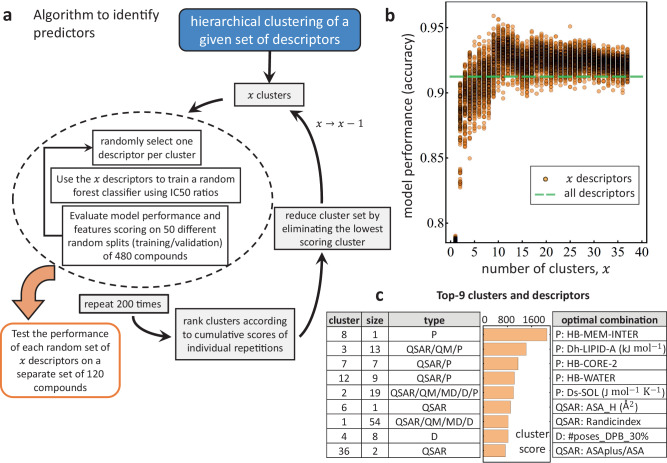
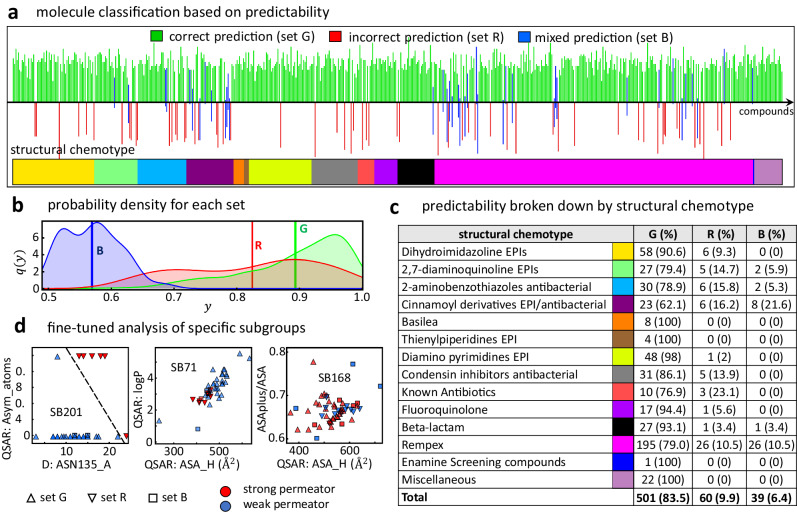
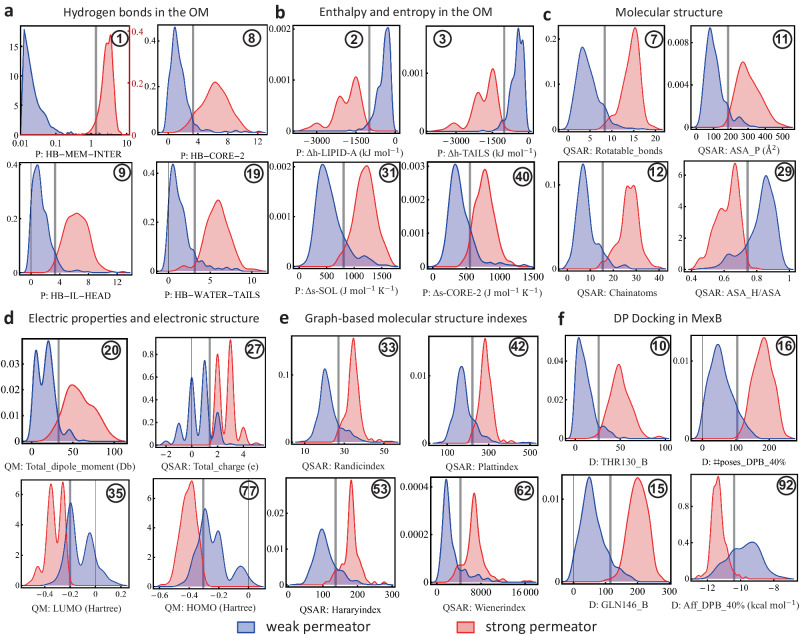
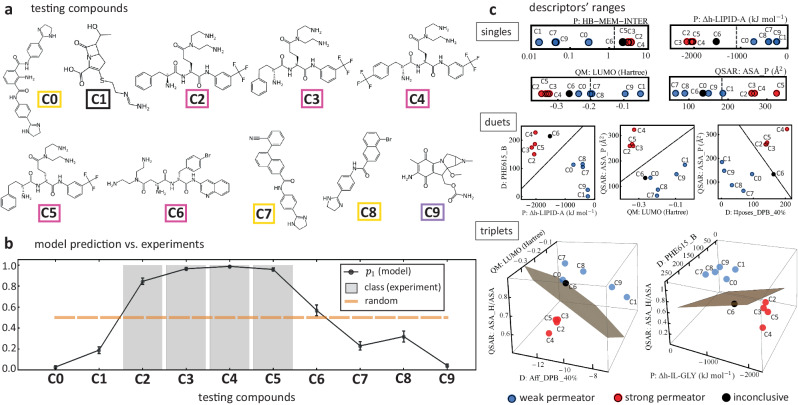
The ability Gram-negative pathogens have at adapting and protecting themselves against antibiotics has increasingly become a public health threat. Data-driven models identifying molecular properties that correlate with outer membrane (OM) permeation and growth inhibition while avoiding efflux could guide the discovery of novel classes of antibiotics. Here we evaluate 174 molecular descriptors in 1260 antimicrobial compounds and study their correlations with antibacterial activity in Gram-negative Pseudomonas aeruginosa. The descriptors are derived from traditional approaches quantifying the compounds' intrinsic physicochemical properties, together with, bacterium-specific from ensemble docking of compounds targeting specific MexB binding pockets, and all-atom molecular dynamics simulations in different subregions of the OM model. Using these descriptors and the measured inhibitory concentrations, we design a statistical protocol to identify predictors of OM permeation/inhibition. We find consistent rules across most of our data highlighting the role of the interaction between the compounds and the OM. An implementation of the rules uncovered in our study is shown, and it demonstrates the accuracy of our approach in a set of previously unseen compounds. Our analysis sheds new light on the key properties drug candidates need to effectively permeate/inhibit P. aeruginosa, and opens the gate to similar data-driven studies in other Gram-negative pathogens.


Conflict of interest statement

The authors declare no competing interests.

Figures

Fig. 1
Fig. 1. Our library of compounds, experimental data, and molecular descriptors.
a Computational representation of the outer membrane environment (OM) of P. aeruginosa detailing the seven sub-regions where MD simulations where the 35 descriptors listed in E were computed for each molecule. b Experimental structure of the tripartite efflux system MexAB-OprM (PDB ID: 6TA6 [10.1038/s41467-020-18770-5]). On the right: focus on the two MexB major binding pockets, AP and DP. c Assembled library of 1260 antimicrobial molecules classified into 16 distinct structural chemotypes as listed (top left), and some examples are shown in the bottom panel. d Each compound is characterized by its antimicrobial activity in three strains of P. aeruginosa by means of the 50% inhibitory concentration (IC50). e Molecules in c are further characterized by 174 computationally-derived mechanistic descriptors classified as either docking (D), permeation (P), or physicochemical (PC). These are computed using QSAR methods, density functional calculations, ensemble docking and MD simulations in water and in the OM of P. aeruginosa. f Principal components third degree decomposition of the molecules following the color code shown in c.
Fig. 2
Fig. 2. Basic relationships among the descriptors.
Each data point represents a molecule, and it is projected on the two-dimensional space of two descriptors as shown. Some of the most common properties found among the descriptors are: a linear correlations, b non-linear correlations, and c uncorrelated. The numbers on each of the panels are computed by standard correlations (i.e., Pearson coefficient), Cij, and rank correlations, Rij. As shown, rank correlations capture better the non-linear relationship shown in the central panel.
Fig. 3
Fig. 3. Data characterization of the 174 molecular descriptors by means of a hierarchical clustering algorithm using their associated rank correlations.
The computation yields 37 dissimilar clusters of sizes ranging from single descriptor clusters (e.g., cluster 37) up to a large cluster of 52 descriptors (cluster 1). The dendrogram in the left-hand side depicts the individual as well as cluster level relationships among the descriptors (single line) and clusters (blue groups), respectively. It also permits the visualization of the cut defining the number of clusters, which was determined by the L-method (see Supplementary Methods). The heat map further highlights the different clusters as well as the relationships between themselves and between individual descriptors via a dissimilarity computation of their associated rank correlations. The type of descriptor is defined in the right-hand side by the color code shown in the legend.
Fig. 4
Fig. 4. Our data-driven model of predictors identification.
a Hierarchical clustering algorithm is used to select different combinations of x descriptors. A random forest classifier is trained on the x descriptors alongside with IC50 ratios, and the descriptors performance are scored accordingly. Over the course of several random selections of x descriptors, the aggregated x scores are used to rank the clusters according to predictability. The lowest ranked cluster is eliminated and the value of x is reduced. In parallel, for each classification run, the fitted model is tested in a separate set of compounds and the evaluation metrics are stored. b Model performance accuracy for each cycle of the model. Individual circles represent the average accuracy score of a single random combination of x descriptors using a random forest classifier over 50 random training/validation splits. The dashed green line represents the average accuracy score for a random forest classifier using the full set of 174 descriptors. c Top-9 clusters ranked according to their testing performance. The table in the left panel distinguishes the cluster number, its size (number of descriptors comprising the cluster), and type of descriptors they contain. The central panel is the aggregated cluster score where all values add to 104, which is the total number of runs for a particular value of x. The right panel lists the top-9 optimal descriptors that produce a testing accuracy of 96.2%.
Fig. 5
Fig. 5. Model prediction analysis.
a Classification of compounds according to their predictability by our model. 100 random samples of 120 compounds each were tested on the remaining of the data. Compounds that were correctly predicted at each model realization are represented by a green bar pointing above the x-axis (set G). Compounds that were incorrectly predicted in every run are represented by a red bar pointing below the x-axis (set R). Compounds that in some runs were correctly predicted and in some other, incorrectly predicted, are represented by blue bars pointing both ways (set B). The color bar in the bottom indicates the structural chemotype a given compound belongs to as defined in Fig. 1. b Probability density q(y) as a function of the probability value y associated with each category of descriptors (G, R, and B) for the dominant target class, i.e., y=max{p0,p1}, where p0 and p1 are the probabilities of being a weak or a strong permeator, respectively. Vertical lines indicate the average probability ȳ for each case. c Number of compounds and percentage of each set (G, R, and B as defined in a) for each structural chemotype following color scheme and ordering as a. d Analysis of three selected subgroups according to a complete Tanimoto similarity analysis that contain a relevant amount of compounds from the sets R (inverted triangles) and B (squares). Each panel shows the specific subgroups (SB201, SB71, and SB168) in the space of two descriptors identified by our model (Fig. 4a and compared to their respective experimental class: strong permeator (red) and weak permeator (blue). Dashed line in the left panel is produced by a support vector machine classification algorithm.
Fig. 6
Fig. 6. Single descriptor ranges according to class.
Density distribution values across the range of selected individual descriptors associated with a particular target class given by their IC50 ratio, i.e., strong (red) or weak (blue) permeator, for the 501 compounds comprising the predictive group (Fig. 5). The vertical gray line indicates the class threshold estimated by an SVM algorithm. We considered all descriptors from the top 9 clusters from our predictive model (Fig. 4) The descriptors shown hold high predictability scores across general categories (see full list in Supplementary Tables S4 and S5) described as follows: a. Hydrogen bonds in the OM. Top panel uses two vertical scales and an horizontal logarithmic scale. The red vertical scale corresponds to strong permeators (red). All other panels use a single scale for both categories of compounds. b Enthalpy and entropy in the OM, c Molecular structure, d Electric properties and electronic structure, e Graph-based molecular structure indexes, and f DP docking in MexB. The circled number in each panel list the ranking according to their single-descriptor predictability scores (Supplementary Tables S4 and S5).
Fig. 7
Fig. 7. Model testing on additional compounds.
a Ten compounds labeled C0-C9 structurally classified using the color code defined Fig. 1a. b Model prediction associated with the ten compounds (solid black line) against the target class (gray bars) assigned from the IC50 ratio measured experimentally in Pseudomonas aeruginosa. The prediction quantifies the probability that a given testing compound is a strong permeator, p1. Error bars are the standard deviation of 100 model runs. Orange line is the maximum uncertainty (i.e., random) classification value of 0.5. The value of p1 of compound C6 lies very close to this high uncertainty value. c Ranges of high-ranked descriptors as singles (top), duets (center), and triplets (bottom) for the testing compounds and classification given by the model. Each panel shows how these compounds' properties compare to the classification boundary of the training set (dark line or plane).

Similar articles

Cited by

References

    1. World Health Organization. Antibacterial agents in clinical development: An analysis of the antibacterial clinical development pipeline, including tuberculosis. Tech. Rep., (World Health Organization, 2017). http://www.jstor.org/stable/resrep35853.1.
    1. Bush K, Page MGP. What we may expect from novel antibacterial agents in the pipeline with respect to resistance and pharmacodynamic principles. J. Pharmacokinet. Pharmacodyn. 2017;44:113–132. doi: 10.1007/s10928-017-9506-4. - DOI - PubMed
    1. Li X-Z, Plésiat P, Nikaido H. The challenge of efflux-mediated antibiotic resistance in gram-negative bacteria. Clin. Microbiol. Rev. 2015;28:337–418. doi: 10.1128/CMR.00117-14. - DOI - PMC - PubMed
    1. Krishnamoorthy G, et al. Synergy between active efflux and outer membrane diffusion defines rules of antibiotic permeation into gram-negative bacteria. mBio. 2017;8:e01172–17. doi: 10.1128/mBio.01172-17. - DOI - PMC - PubMed
    1. Masi M, Réfregiers M, Pos KM, Pagés J-M. Mechanisms of envelope permeability and antibiotic influx and efflux in gram-negative bacteria. Nat. Microbiol. 2017;2:17001. doi: 10.1038/nmicrobiol.2017.1. - DOI - PubMed