. 2024 Apr 12;14(1):8528.
doi: 10.1038/s41598-024-59083-7.

Protein restriction during pregnancy alters Cdkn1c silencing, dopamine circuitry and offspring behaviour without changing expression of key neuronal marker genes

Affiliations

Protein restriction during pregnancy alters Cdkn1c silencing, dopamine circuitry and offspring behaviour without changing expression of key neuronal marker genes

Chiara Prodani et al. Sci Rep. .

Abstract

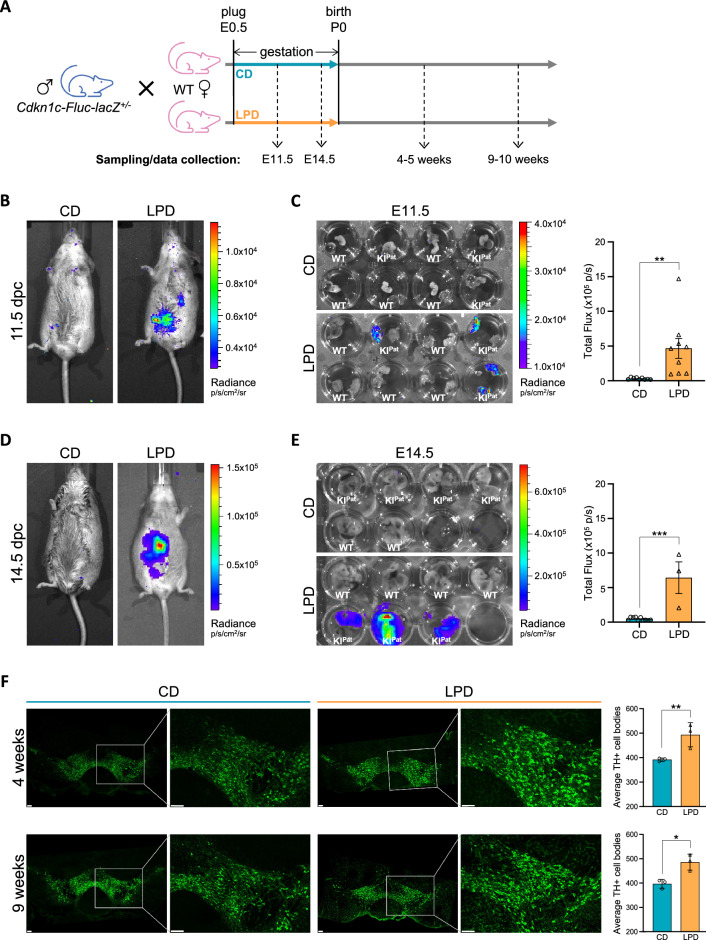
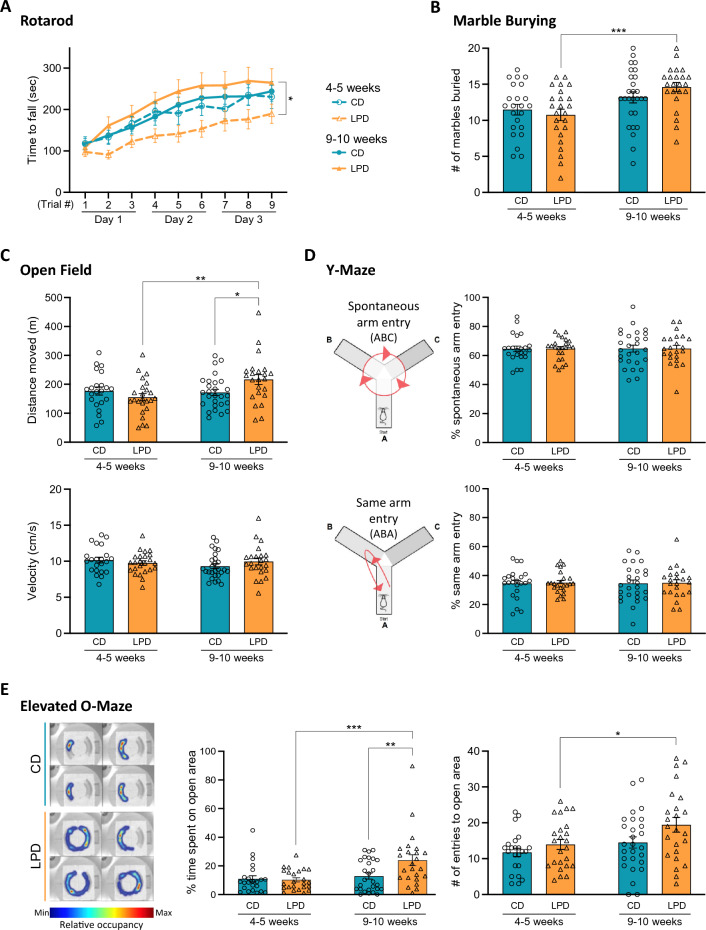
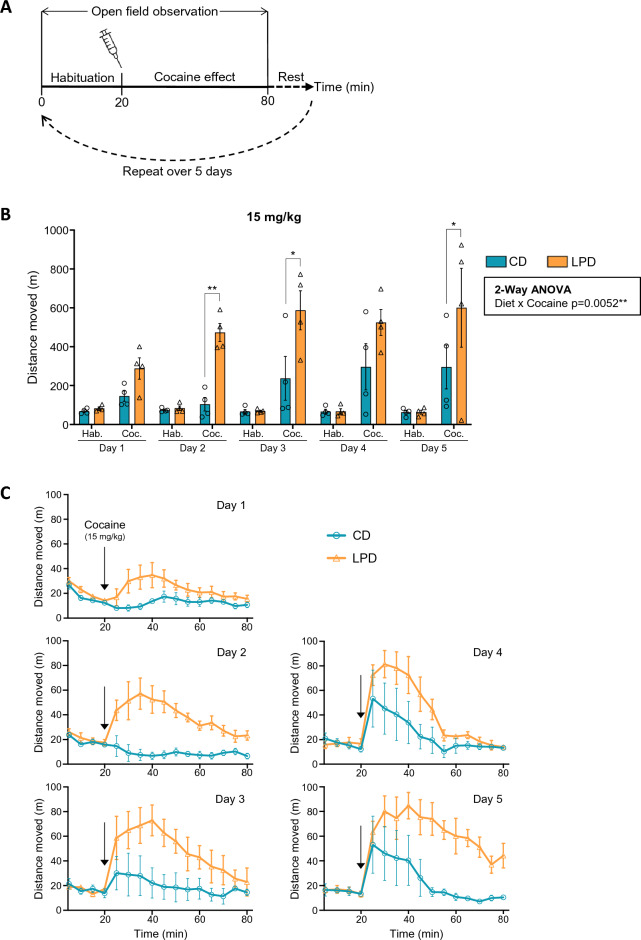
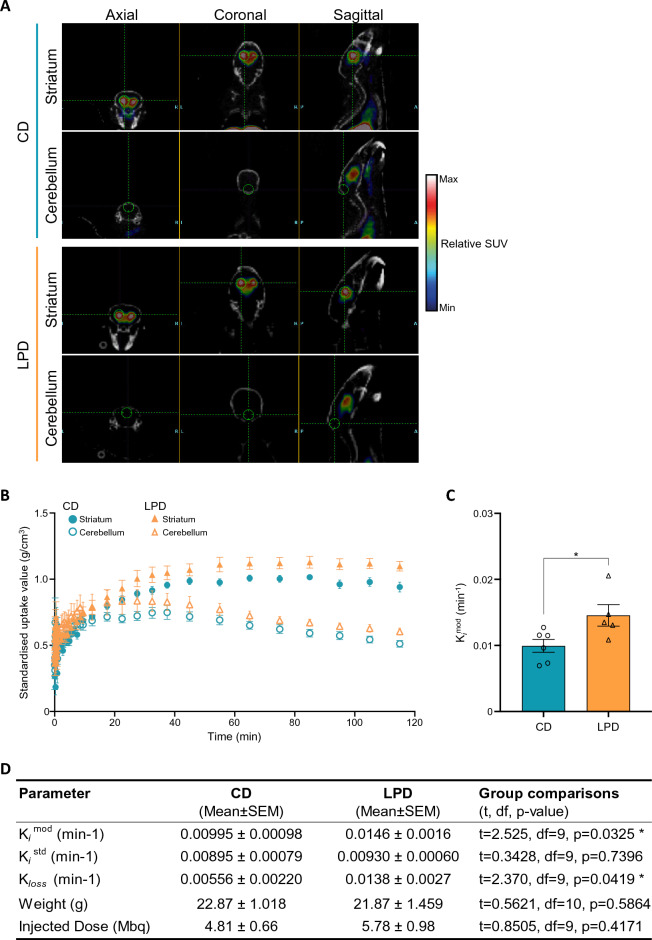
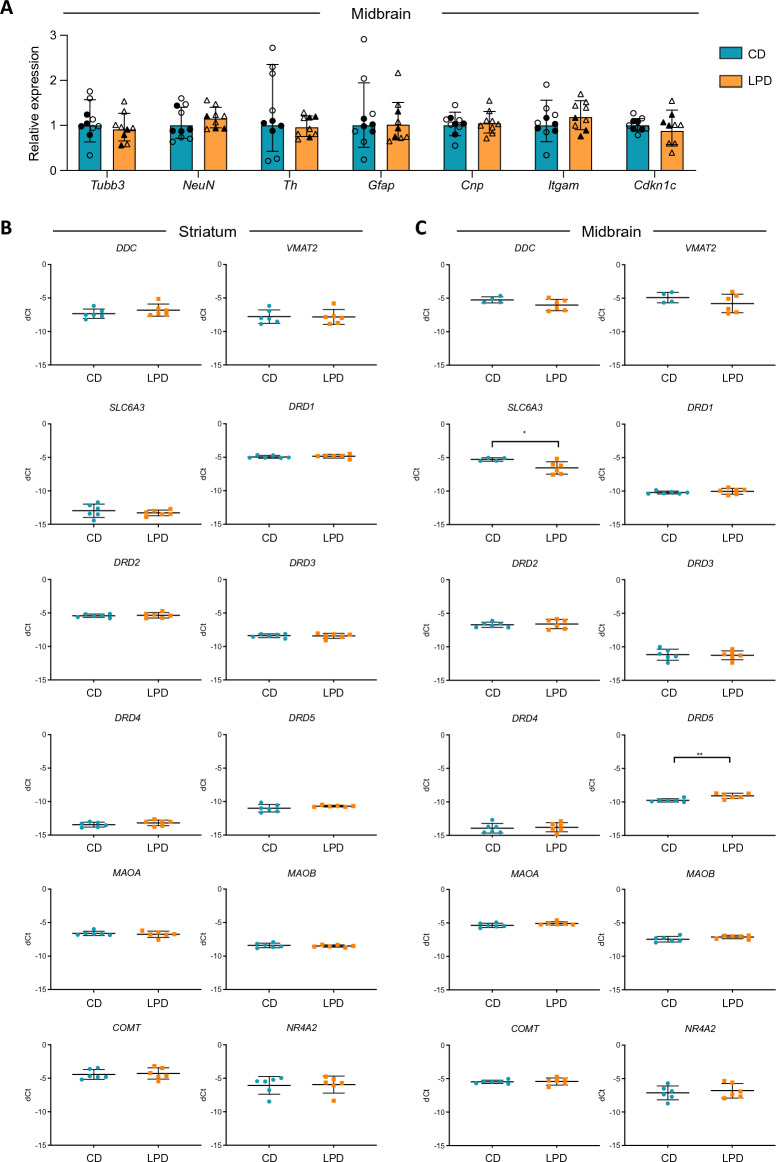
We tracked the consequences of in utero protein restriction in mice throughout their development and life course using a luciferase-based allelic reporter of imprinted Cdkn1c. Exposure to gestational low-protein diet (LPD) results in the inappropriate expression of paternally inherited Cdkn1c in the brains of embryonic and juvenile mice. These animals were characterised by a developmental delay in motor skills, and by behavioural alterations indicative of reduced anxiety. Exposure to LPD in utero resulted in significantly more tyrosine hydroxylase positive (dopaminergic) neurons in the midbrain of adult offspring as compared to age-matched, control-diet equivalents. Positron emission tomography (PET) imaging revealed an increase in striatal dopamine synthesis capacity in LPD-exposed offspring, where elevated levels of dopamine correlated with an enhanced sensitivity to cocaine. These data highlight a profound sensitivity of the developing epigenome to gestational protein restriction. Our data also suggest that loss of Cdkn1c imprinting and p57KIP2 upregulation alters the cellular composition of the developing midbrain, compromises dopamine circuitry, and thereby provokes behavioural abnormalities in early postnatal life. Molecular analyses showed that despite this phenotype, exposure to LPD solely during pregnancy did not significantly change the expression of key neuronal- or dopamine-associated marker genes in adult offspring.


Conflict of interest statement

The authors declare no competing interests.

Figures

Figure 1
Figure 1
In utero exposure to LPD results in paternal Cdkn1c re-expression during embryonic development and elevated numbers of dopaminergic neurons in adult midbrain. (A) Schematic illustrating how Cdkn1c-Fluc-lacZ paternal knock-in (KIpat) and wildtype (WT) offspring were generated, together with the gestational dietary regimes used and the timepoints of experimental sampling. (B) Whole-body bioluminescent imaging of 11.5 dpc pregnant dams exposed to control diet (CD) or low protein diet (LPD) during pregnancy. (C) Ex-vivo bioluminescence imaging of KIpat and WT E11.5 embryos and placentas exposed to CD or LPD during gestation. Graph (right) shows quantification of total flux in KIpat embryos. CD n = 9, LPD n = 9; error bars = SEM; two-tailed unpaired t-test (**p = 0.0077). (D) Bioluminescence imaging of 14.5 dpc pregnant dams exposed to CD or LPD through pregnancy. (E) Ex-vivo bioluminescence imaging of KIpat and WT E14.5 embryos and placentas exposed to CD or LPD during gestation. Graph (right) shows quantification of total flux in KIpat embryos. CD n = 10, LPD n = 3; error bars = SEM; two-tailed unpaired t-test (***p = 0.0002). (F) Immunofluorescence detection of tyrosine hydroxylase (TH) positive cells (green) in representative midbrain tissue sections of juvenile and adult mice (4–5 and 9–10 weeks of age, respectively) exposed to CD or LPD in utero. Scale bars represent 100 µm. Right-hand graphs show the average number of TH positive cells in each condition. N = 3 animals per condition and ≥ 2 tissue sections averaged per animal; error bars = SD; Two-way ANOVA (diet p = 0.0007, age p = 0.9524, interaction p = 0.7399) with Sidak’s multiple comparisons test (**padj = 0.0079, *padj = 0.0159; two comparisons only).
Figure 2
Figure 2
In utero exposure to LPD results in both transient and sustained changes in offspring behaviour. (A) Time course trials of rotarod latency (time to fall) in juvenile (4–5 weeks old, open symbols) and adult (9–10 weeks old, filled symbols) CD- (blue) or LPD- (orange) exposed mice. Two-way repeated measures ANOVA revealed a significant difference between the four groups (p = 0.0339). Sidak’s multiple comparisons test (main group effect) revealed a significant difference between LPD juveniles and adults (*padj = 0.0165; four pre-selected comparisons). CD 4–5 weeks n = 23, LPD 4–5 weeks n = 24, CD 9–10 weeks n = 27, LPD 9–10 weeks n = 23; error bars = SEM. (B) Analysis of marble burying in juvenile and adult CD- (blue) and LPD- (orange) exposed offspring, quantifying the number of marbles out of 20 which were > 2/3 buried after 20 min. Two-way ANOVA (age p = 0.0003, diet p = 0.6396, interaction p = 0.1494) with Sidak’s multiple comparisons test (***padj = 0.0009; two families of two comparisons). CD 4–5 weeks n = 23, LPD 4–5 weeks n = 24, CD 9–10 weeks n = 27, LPD 9–10 weeks n = 23; error bars = SEM. (C) Open field assessment of juvenile and adult CD- and LPD-exposed offspring over 60 min, quantifying total distance moved (upper) and velocity (lower). Two-way ANOVAs: distance (age p = 0.0405, diet p = 0.4028, interaction p = 0.0181), velocity (age p = 0.3943, diet p = 0.7514, interaction p = 0.1711); Sidak’s multiple comparisons tests (*padj = 0.0421, **padj = 0.0045; two families of two comparisons per analysis). CD 4–5 weeks n = 22, LPD 4–5 weeks n = 24, CD 9–10 weeks n = 27, LPD 9–10 weeks n = 23; error bars = SEM. (D) Y-maze performance of juvenile and adult CD- or LPD-exposed offspring, assessed as the percentage of spontaneous arm entries (ABC pattern, upper) and alternate arm entries (ABA pattern, lower). Two-way ANOVA analyses revealed no significant effects on %ABC entries (diet p = 0.9842; age p = 0.9404; interaction p = 0.9772) or %ABA entries (diet p = 0.8309, age p = 0.9866, interaction p = 0.9627). CD 4–5 weeks n = 23, LPD 4–5 weeks n = 24, CD 9–10 weeks n = 27, LPD 9–10 weeks n = 23; error bars = SEM. Schematics adapted from (CC BY 4.0; http://creativecommons.org/licenses/by/4.0/). (E) Elevated O-maze testing of juvenile and adult CD- or LPD-exposed mice. Representative occupancy heatmaps (left) illustrate movement of four individual CD and LPD adults. Open area occupancy was quantified by time spent (middle) or number of entries (right). Diet had a significant impact on open area occupancy by both measures (two-way ANOVAs: time spent (diet p = 0.0423, age p = 0.0028, interaction p = 0.0235), entries (diet p = 0.0271, age p = 0.0109, interaction p = 0.3957); Sidak’s multiple comparisons tests (*padj = 0.0347, **padj = 0.0044, ***padj = 0.0006; two families of two comparisons per analysis). CD 4–5 weeks n = 23, LPD 4–5 weeks n = 24, CD 9–10 weeks n = 27, LPD 9–10 weeks n = 24; error bars = SEM.
Figure 3
Figure 3
Increased cocaine sensitivity in offspring exposed to LPD in utero. (A) Diagram illustrating 5 day cocaine administration and observation regime. (B) Quantification of distance moved during a 5 day trial involving daily administration of 15 mg/kg cocaine, for CD- or LPD-gestationally exposed adult offspring. Two-way repeated measures ANOVA revealed a significant interaction between diet and cocaine (p = 0.0052), with Sidak’s multiple comparisons test revealing no differences during habituation on any days (padj > 0.05), but significantly increased activity in LPD mice post-cocaine on days 2 (**padj = 0.0058), 3 (*padj = 0.0104) and 5 (*padj = 0.0382). CD n = 4, LPD n = 4; error bars = SEM. (C) Time course comparisons (5 min intervals) of distance moved during habituation (first 20 min) and post-cocaine administration (60 min) in adult CD or LPD-exposed mice during 5 days of cocaine sensitisation, using 15 mg/kg cocaine. CD n = 4, LPD n = 4; error bars = SEM.
Figure 4
Figure 4
Altered striatal dopamine function in offspring exposed to LPD in utero, measured by PET imaging. (A) Representative PET images of axial, coronal and sagittal views of adult male CD- or LPD-exposed mouse brains showing regions of interest drawn around the striatum and cerebellum. (B) Time activity curves of mean striatal (filled shapes) and cerebellar (open shapes) [18F]FDOPA radioactivity signal in CD-exposed (circles) or LPD-exposed male mice (triangles), sampled during a 2 h PET scan. Radioactivity is presented as standardised uptake values (SUVs), corrected for mouse body weight, injected radiotracer dose and time of injection. CD n = 6, LPD n = 5; error bars = SEM. (C) Comparison of CD and LPD Kimod values, a measure of striatal dopamine synthesis capacity which corrects for loss of radioactive metabolites from the striatum throughout the scan. Each data point represents an animal (CD n = 6, LPD n = 5, with two striatal values averaged per animal); error bars = SEM; two-tailed unpaired t-test (*p = 0.0325); large effect size (Cohen’s d = 1.495). (D) Summary of μPET Parameters. CD n = 6, LPD n = 5; two-tailed unpaired t-tests (*p < 0.05).
Figure 5
Figure 5
Comparison of gene expression in adult mouse brain of offspring exposed to CD or LPD during gestation. (A) Quantitative RT-PCR analysis of Tubb3 (immature neurons), NeuN (mature neurons), Th (dopaminergic neurons), Gfap (astrocytes), Cnp (oligodendrocytes), Itgam (microglia) and Cdkn1c transcript expression in dissected adult (8–12 weeks old) midbrain of mice that had been exposed to LPD (orange) or CD (blue) in utero. Expression was normalised to β-actin and is plotted relative to CD. Results combine animals previously subjected to behavioural challenge (CD n = 6, LPD n = 6, open symbols) and those not previously exposed (CD n = 4, LPD n = 3, filled symbols). Bars show geometric mean; error bars = geometric SD; unpaired t-tests were used to compare CD with LPD, no significant differences were detected (p > 0.05). (B,C) Relative expression of genes encoding proteins that are particularly relevant to dopamine uptake and metabolism in adult (8–12 weeks old) mouse striatal (B) and midbrain samples (C) are shown. Expression is shown as average delta-CT relative to β-actin. Decreased expression of SLC6A3, encoding DAT (*p = 0.0298), and increased expression of DRD5, encoding dopamine receptor D5 (**p = 0.0050), was detected (two-tailed unpaired t-tests; n = 6 for each diet group; error bars = SD).

References

    1. Ishidate T, Elewa A, Kim S, Mello CC, Shirayama M. Divide and differentiate: CDK/cyclins and the art of development. Cell Cycle. 2014;13:1384–1391. doi: 10.4161/cc.28656. - DOI - PMC - PubMed
    1. Morgan DO. Cyclin-dependent kinases: Engines, clocks, and microprocessors. Annu. Rev. Cell Dev. Biol. 1997;13:261–291. doi: 10.1146/annurev.cellbio.13.1.261. - DOI - PubMed
    1. Campbell GJ, Hands EL, Van de Pette M. The role of CDKs and CDKIs in murine development. Int. J. Mol. Sci. 2020 doi: 10.3390/ijms21155343. - DOI - PMC - PubMed
    1. Sherr CJ, Roberts JM. CDK inhibitors: Positive and negative regulators of G1-phase progression. Genes Dev. 1999;13:1501–1512. doi: 10.1101/gad.13.12.1501. - DOI - PubMed
    1. Malumbres M, Barbacid M. Cell cycle, CDKs and cancer: A changing paradigm. Nat. Rev. Cancer. 2009;9:153–166. doi: 10.1038/nrc2602. - DOI - PubMed

LinkOut - more resources