Case Reports
. 2024 May;25(5):764-777.
doi: 10.1038/s41590-024-01817-w. Epub 2024 Apr 12.

Biallelic human SHARPIN loss of function induces autoinflammation and immunodeficiency

Hirotsugu Oda #  1   2   3 Kalpana Manthiram #  4   5 Pallavi Pimpale Chavan  4 Eva Rieser  6   7 Önay Veli  6 Öykü Kaya  6 Charles Rauch  6   7 Shuichiro Nakabo  8 Hye Sun Kuehn  9 Mariël Swart  6 Yanli Wang  6 Nisa Ilgim Çelik  6 Anne Molitor  10   11 Vahid Ziaee  12   13   14   15 Nasim Movahedi  13   14   16 Mohammad Shahrooei  17   18 Nima Parvaneh  13   19 Nasrin Alipour-Olyei  10   11 Raphael Carapito  10   11   20 Qin Xu  5 Silvia Preite  5 David B Beck  4   21   22 Jae Jin Chae  4 Michele Nehrebecky  4 Amanda K Ombrello  4 Patrycja Hoffmann  4 Tina Romeo  4 Natalie T Deuitch  4 Brynja Matthíasardóttir  4 James Mullikin  4 Hirsh Komarow  5 Jennifer Stoddard  9 Julie Niemela  9 Kerry Dobbs  5 Colin L Sweeney  5 Holly Anderton  23   24 Kate E Lawlor  23   24   25   26 Hiroyuki Yoshitomi  27   28   29 Dan Yang  30 Manfred Boehm  30 Jeremy Davis  31 Pamela Mudd  32 Davide Randazzo  8 Wanxia Li Tsai  8 Massimo Gadina  8 Mariana J Kaplan  8 Junya Toguchida  27   28 Christian T Mayer  31 Sergio D Rosenzweig  9 Luigi D Notarangelo  5 Kazuhiro Iwai  29 John Silke  23   24 Pamela L Schwartzberg  5 Bertrand Boisson  33   34   35 Jean-Laurent Casanova  33   34   35   36   37 Seiamak Bahram  10   11   20 Anand Prahalad Rao  38 Nieves Peltzer  6   39   40 Henning Walczak  6   7   41 Najoua Lalaoui  42   43   44 Ivona Aksentijevich  45 Daniel L Kastner  46
Affiliations
Case Reports

Biallelic human SHARPIN loss of function induces autoinflammation and immunodeficiency

Hirotsugu Oda et al. Nat Immunol. 2024 May.

Abstract

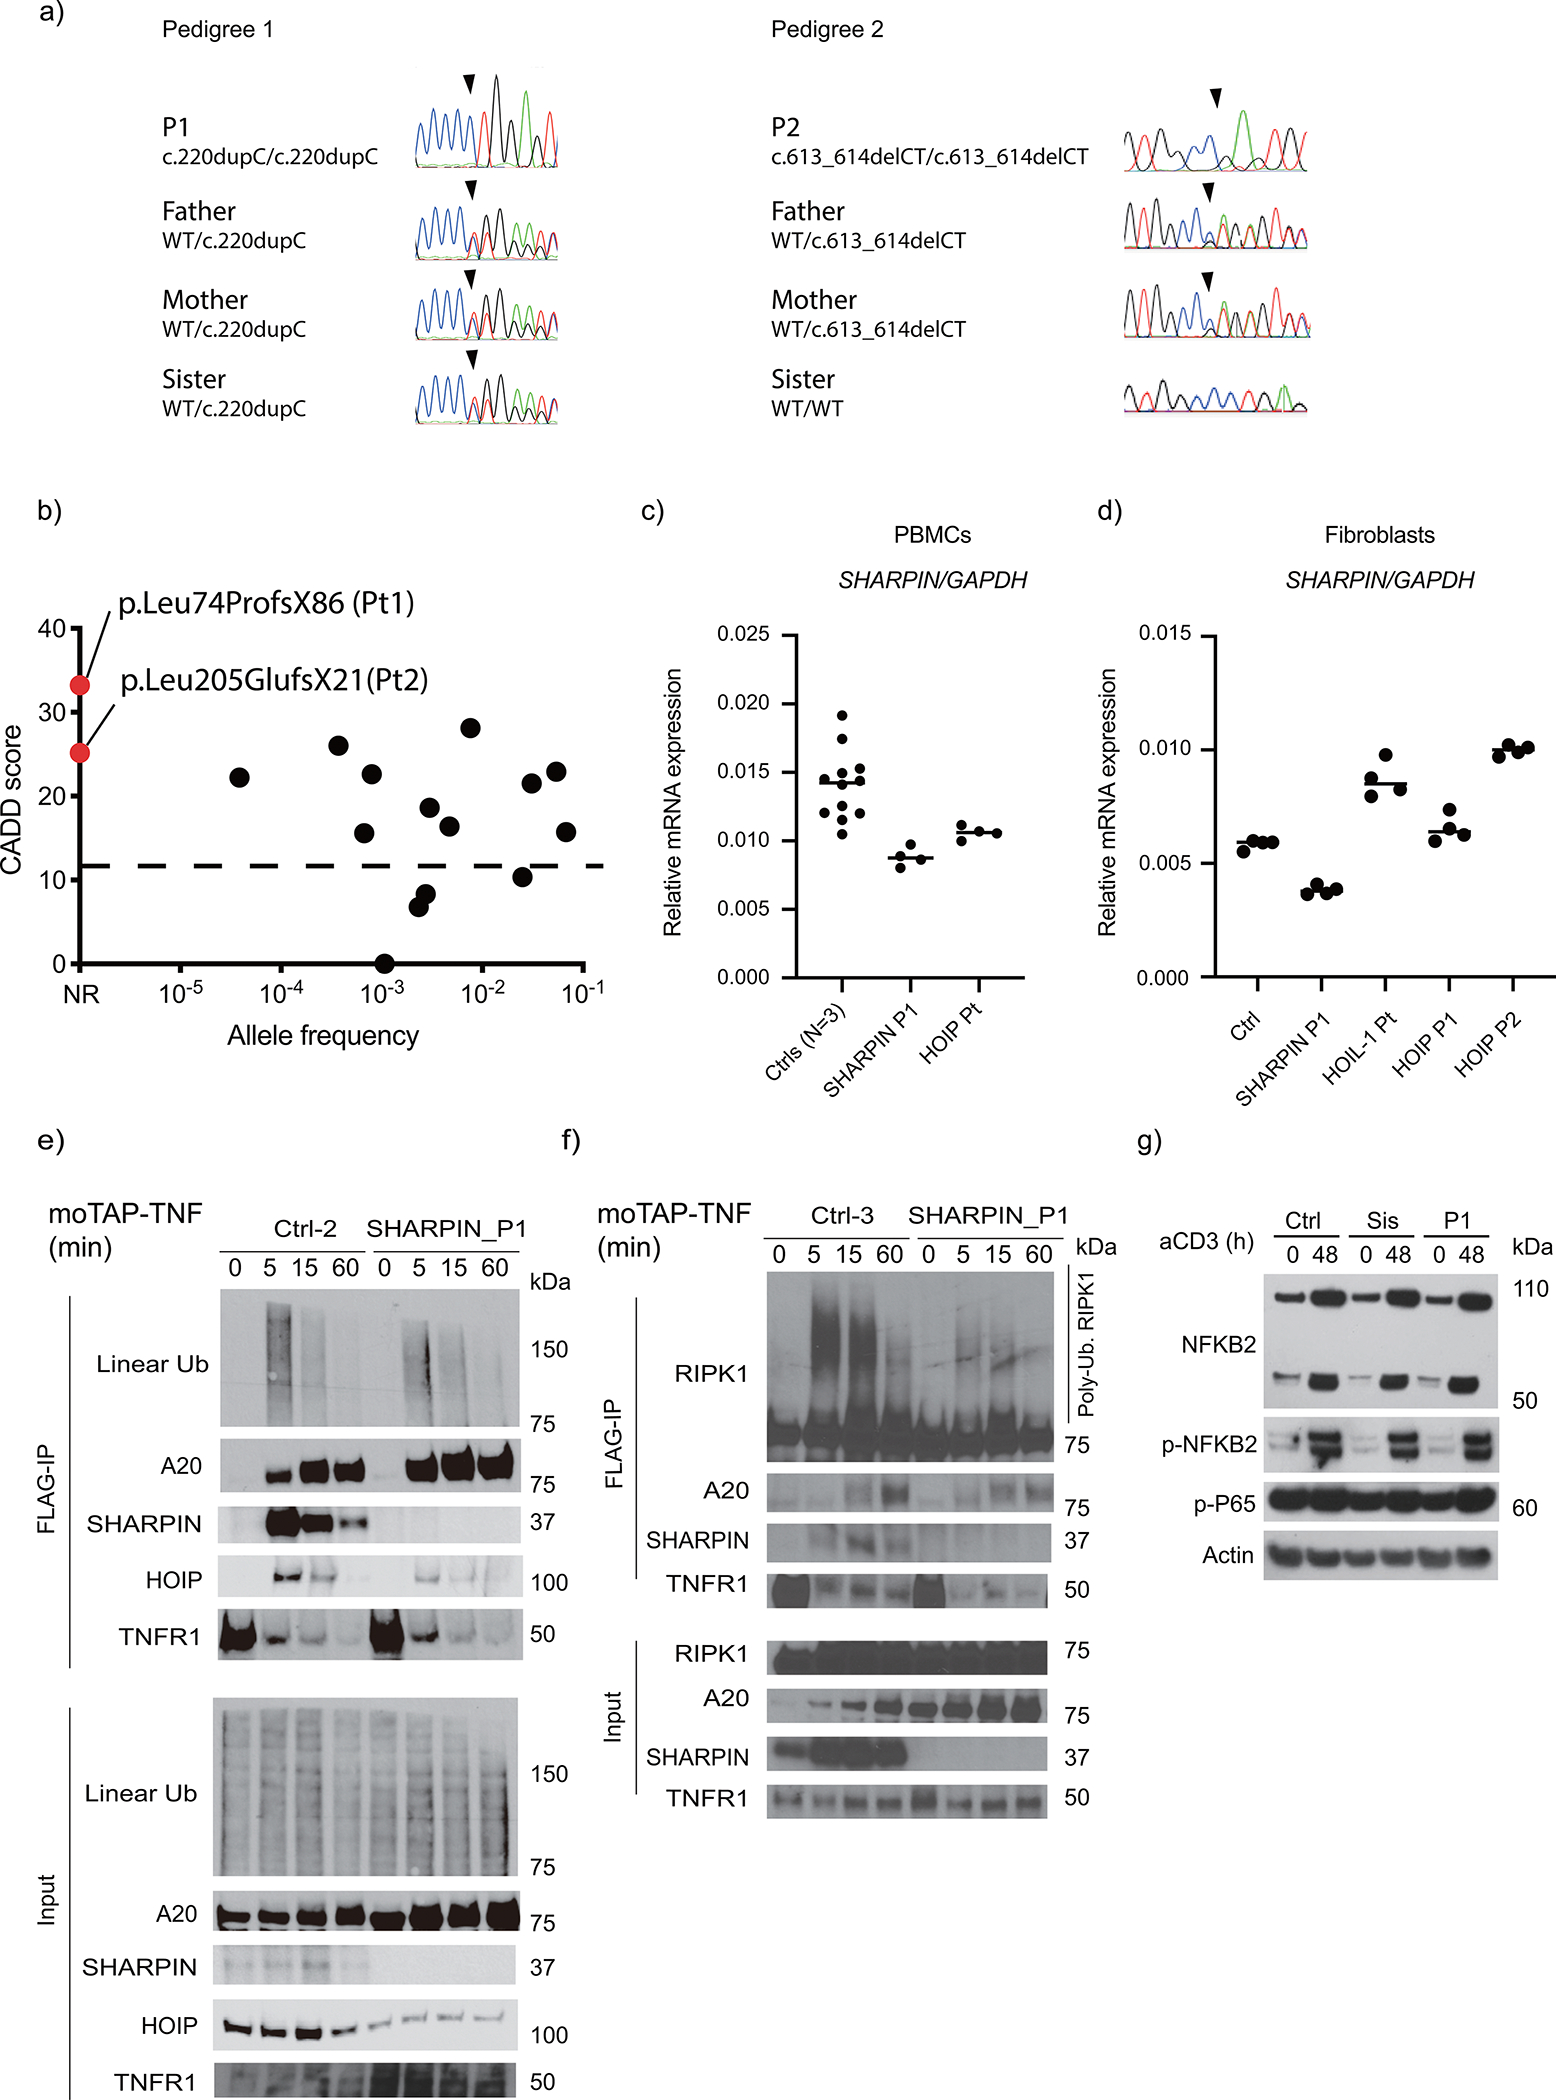
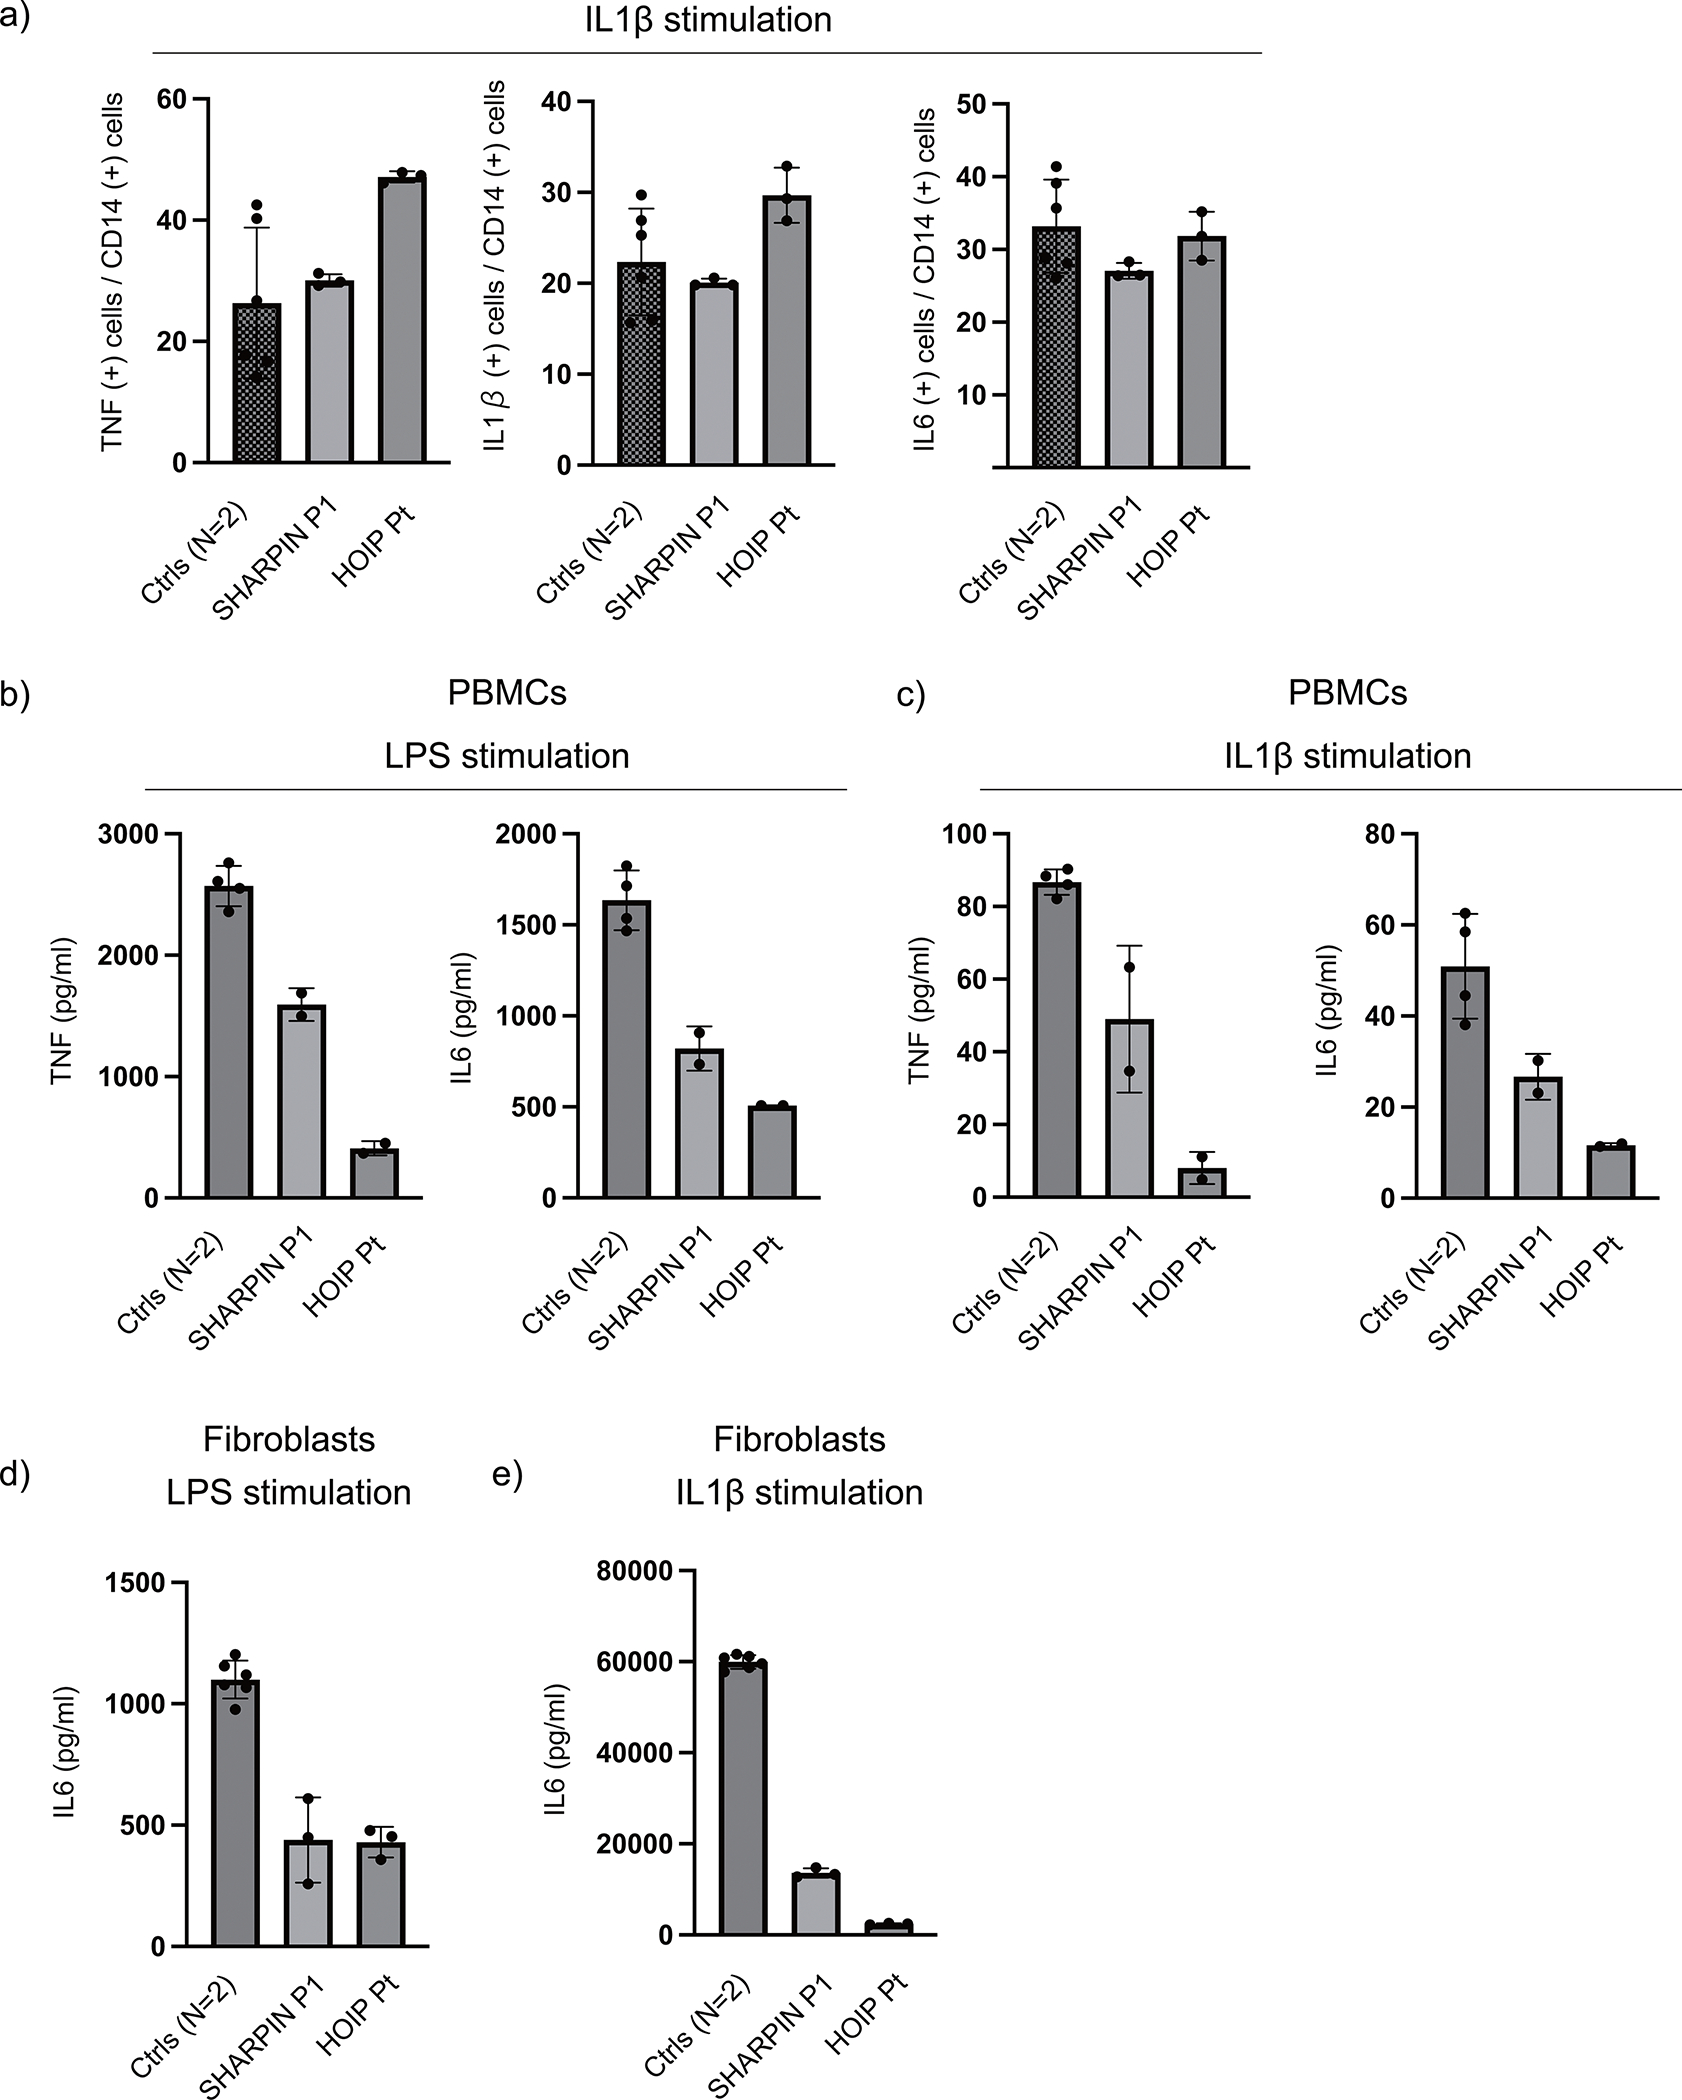
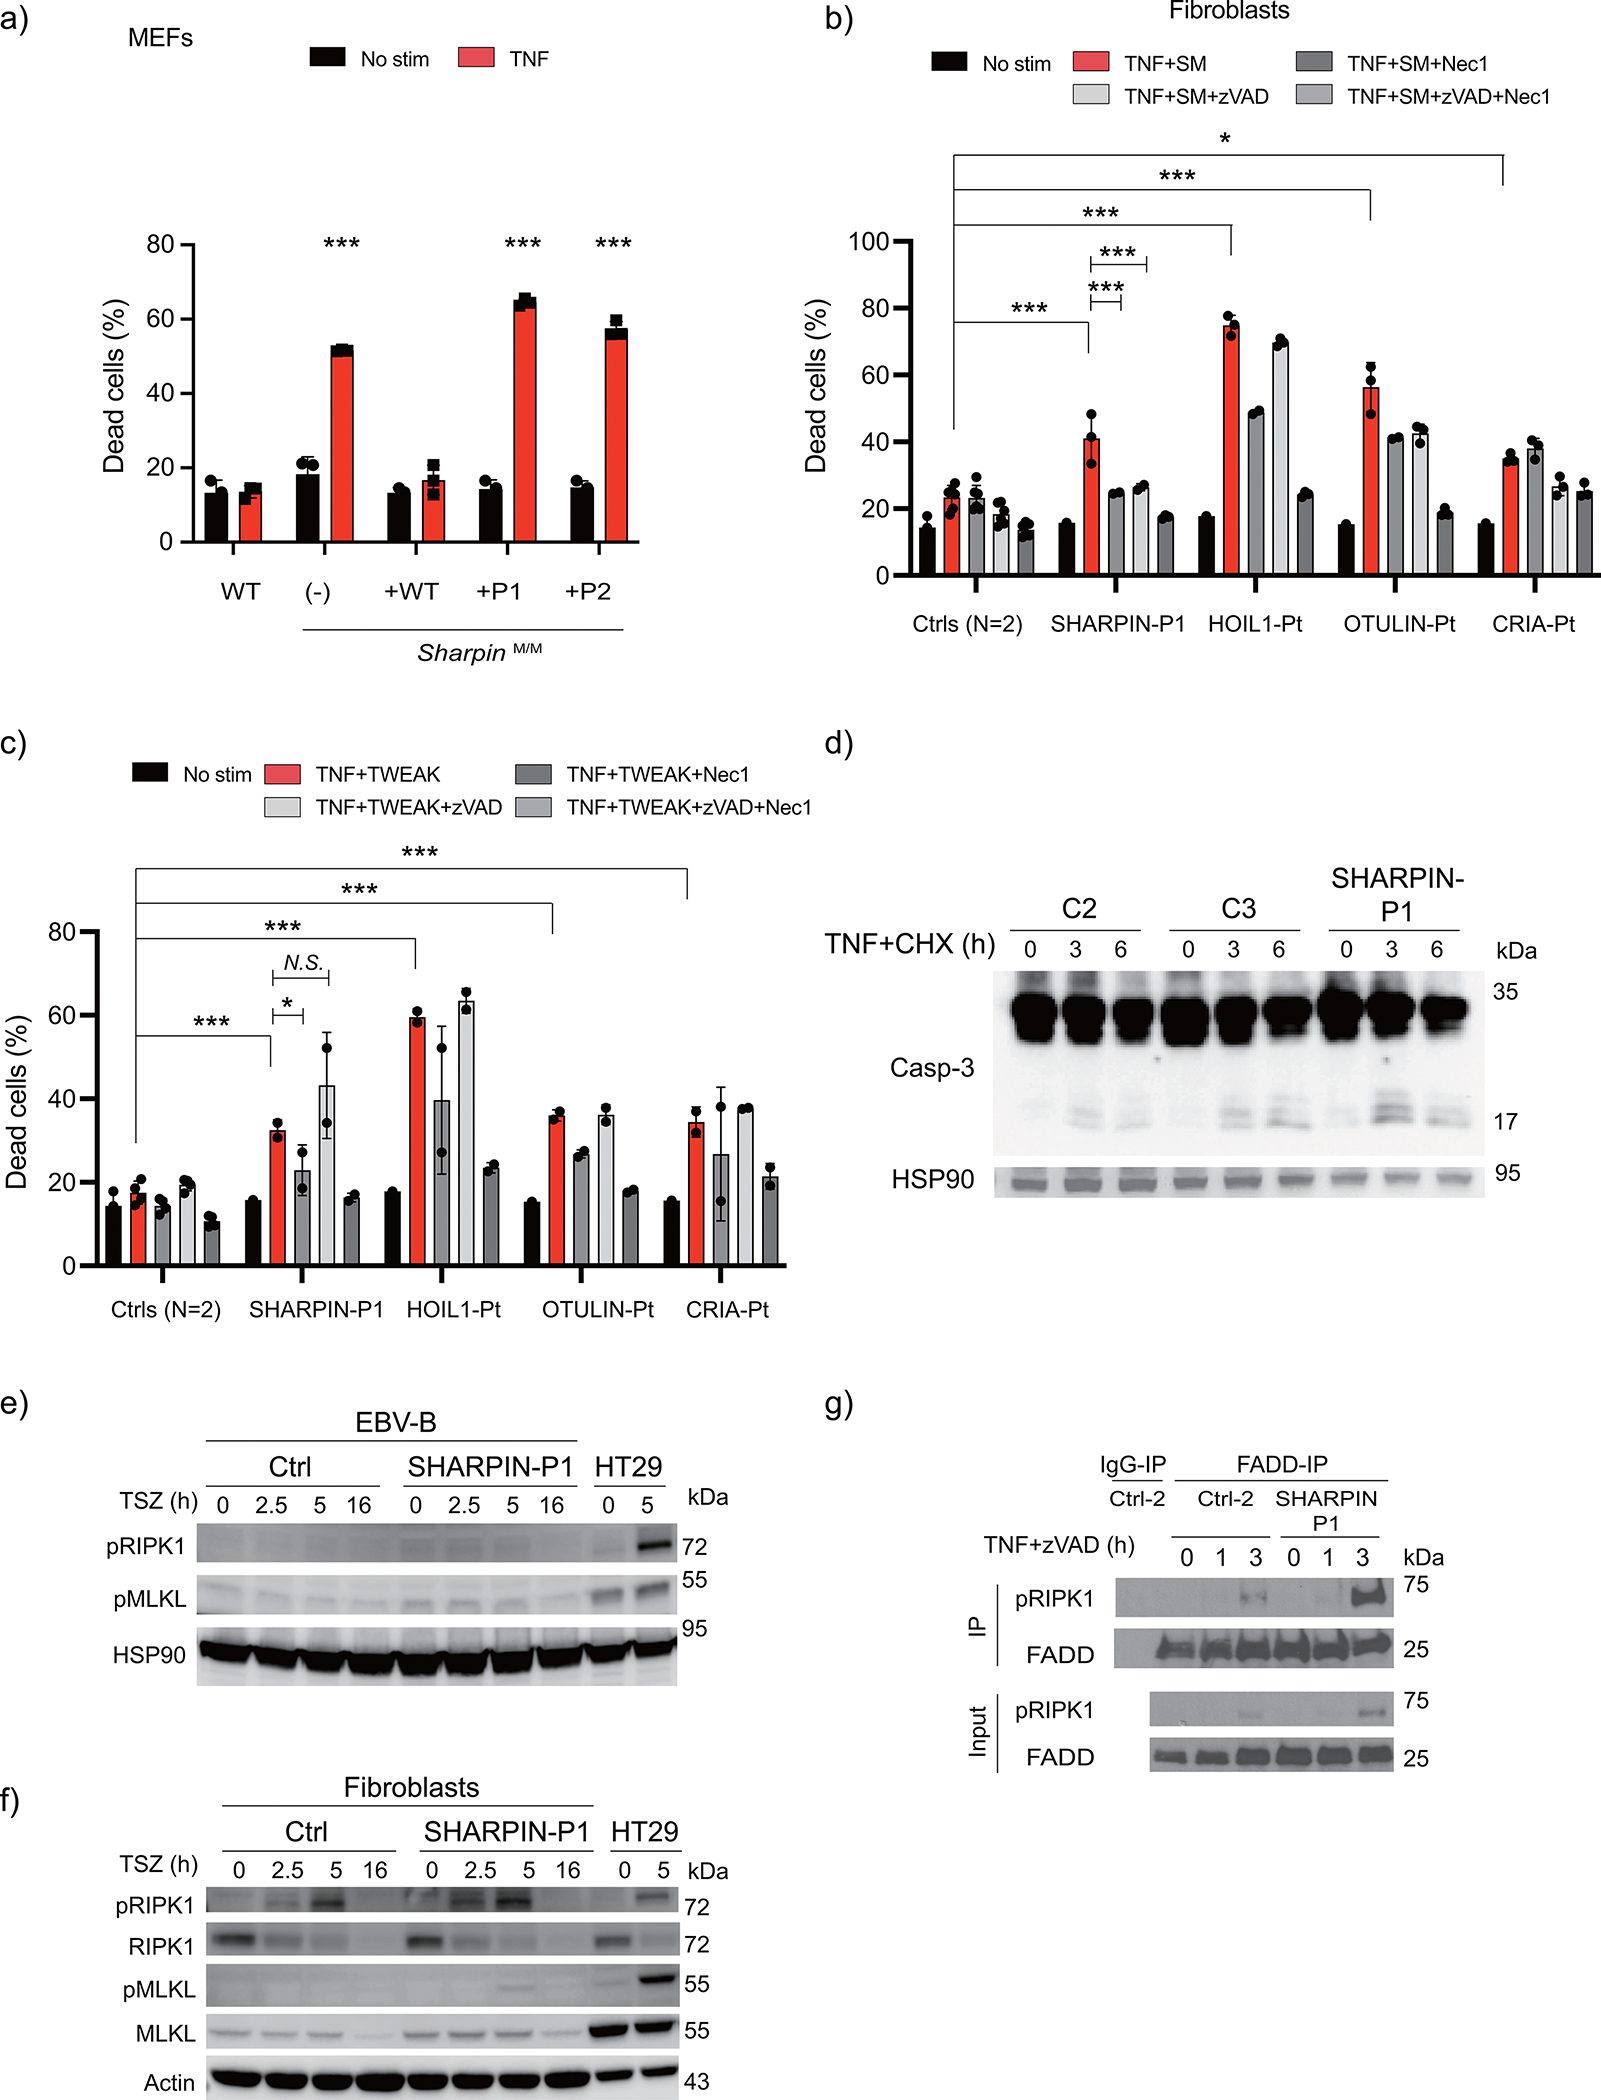
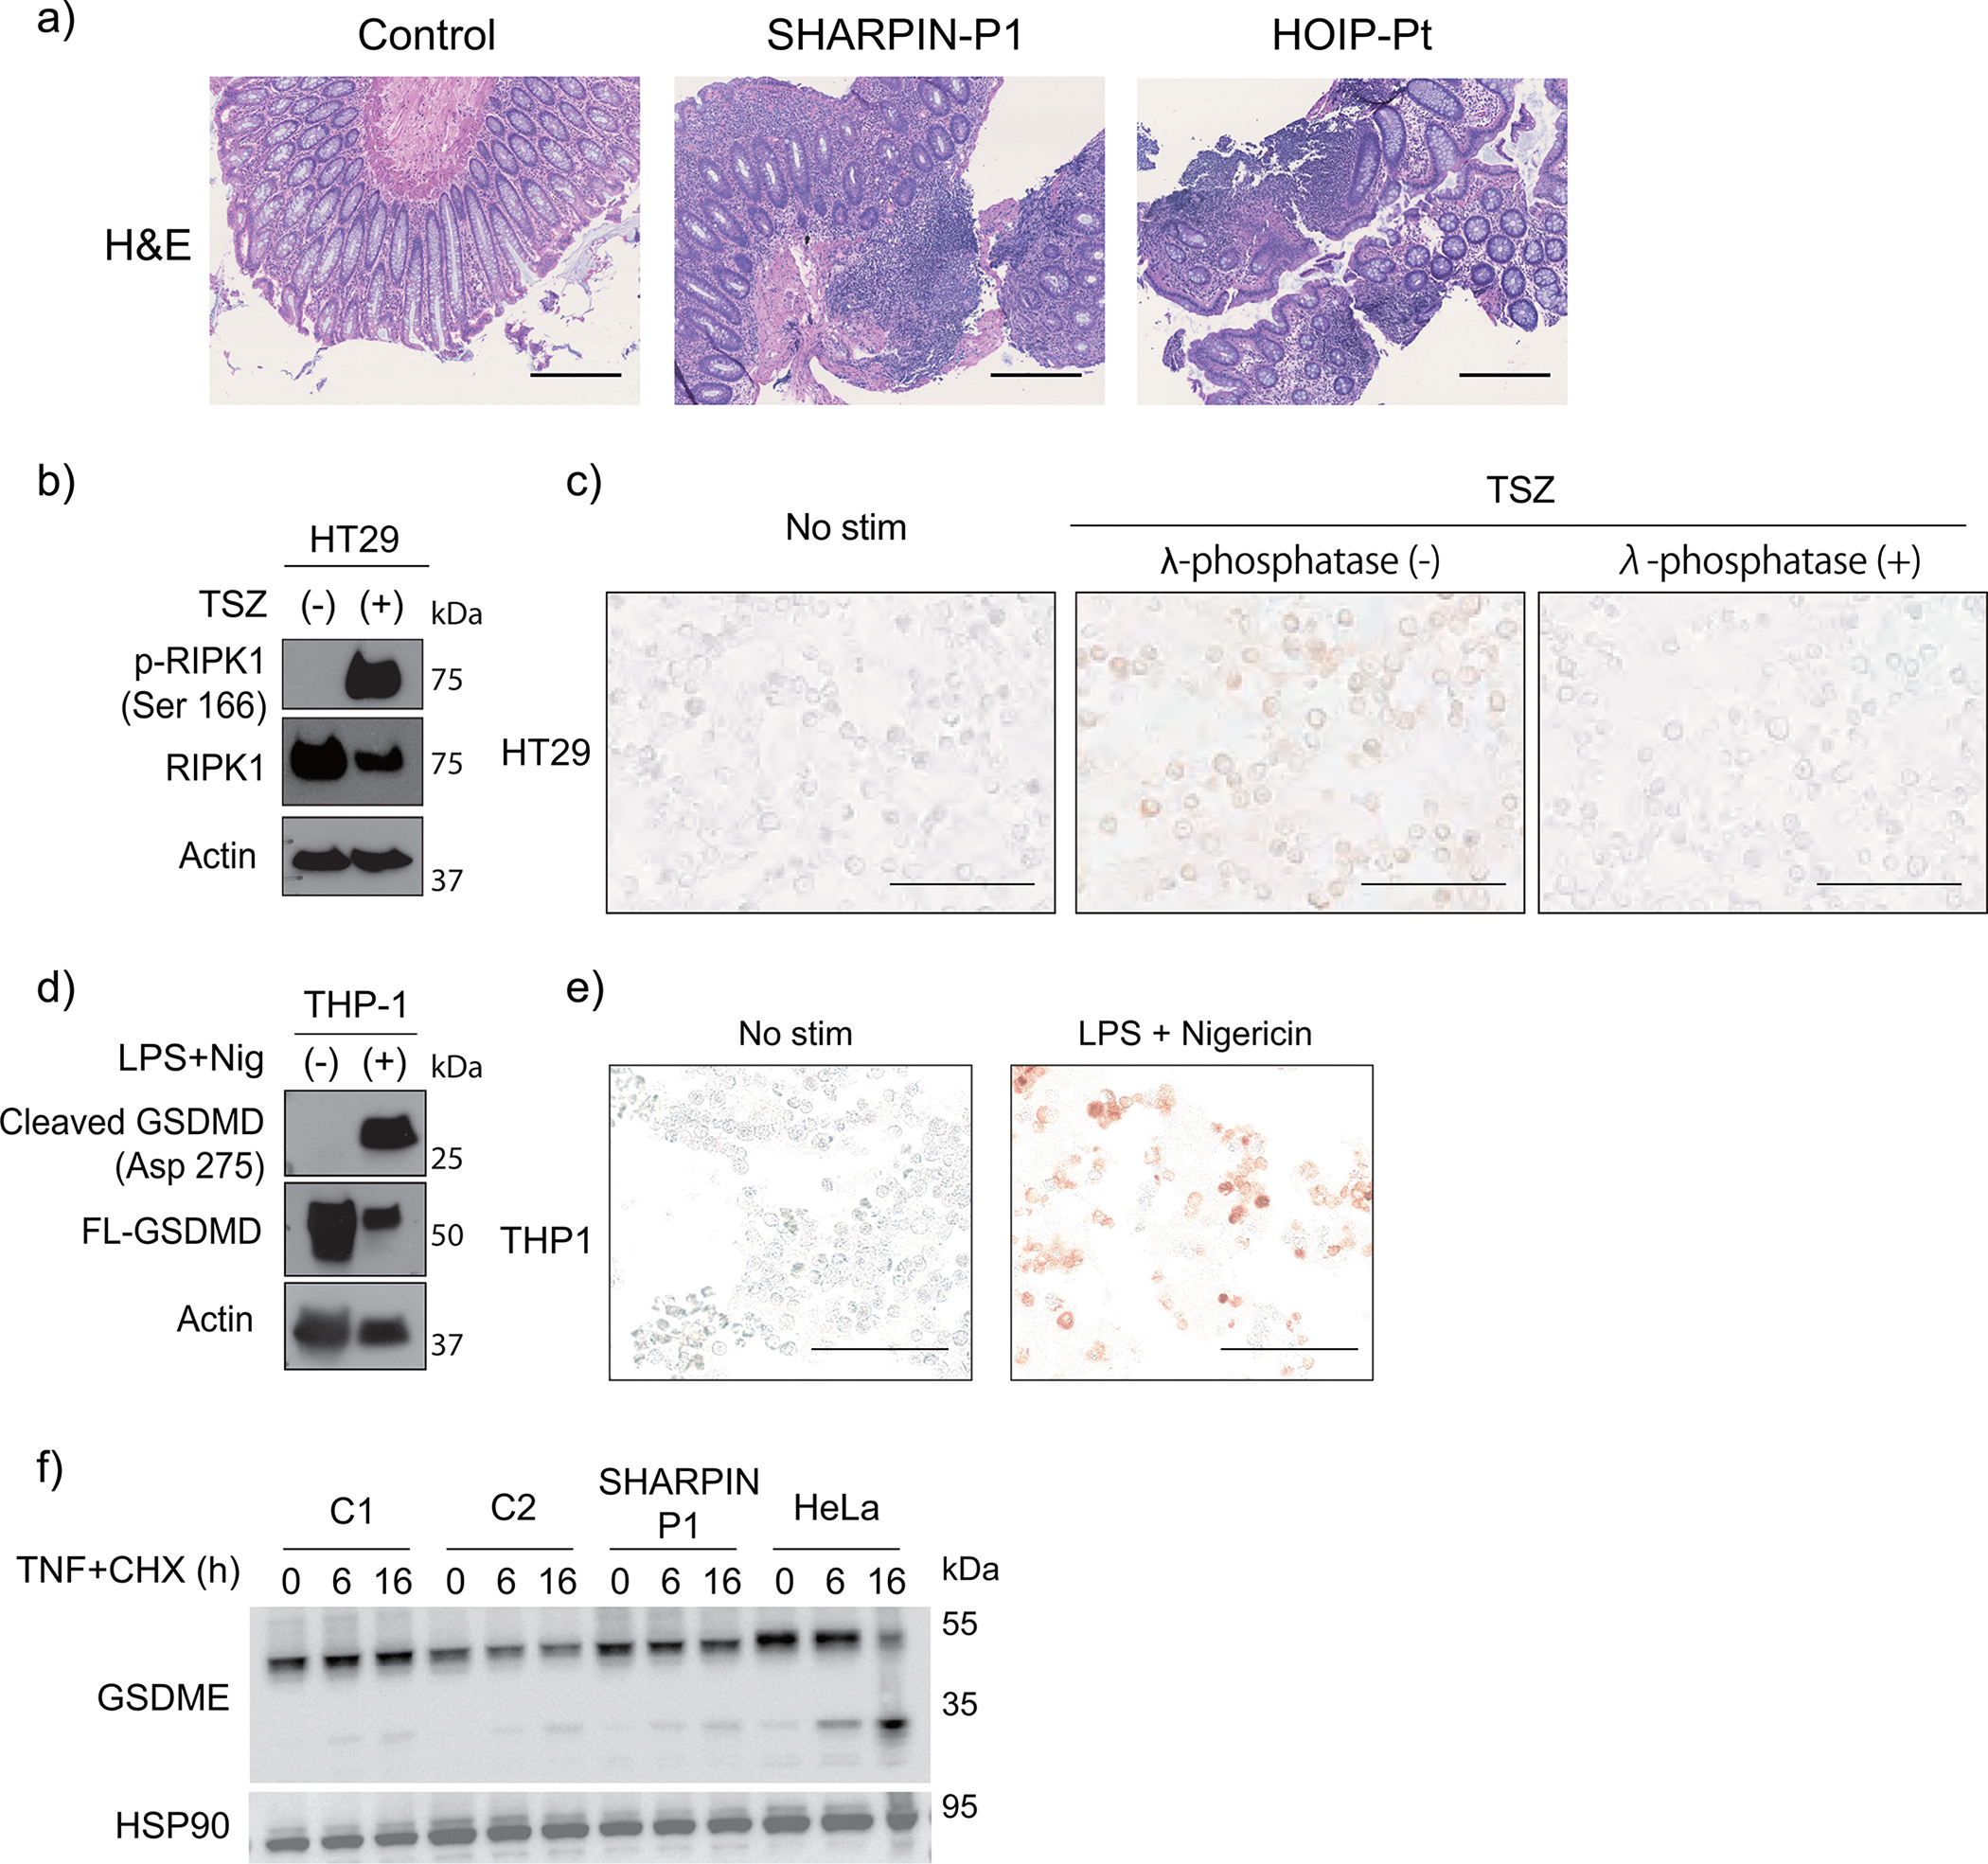
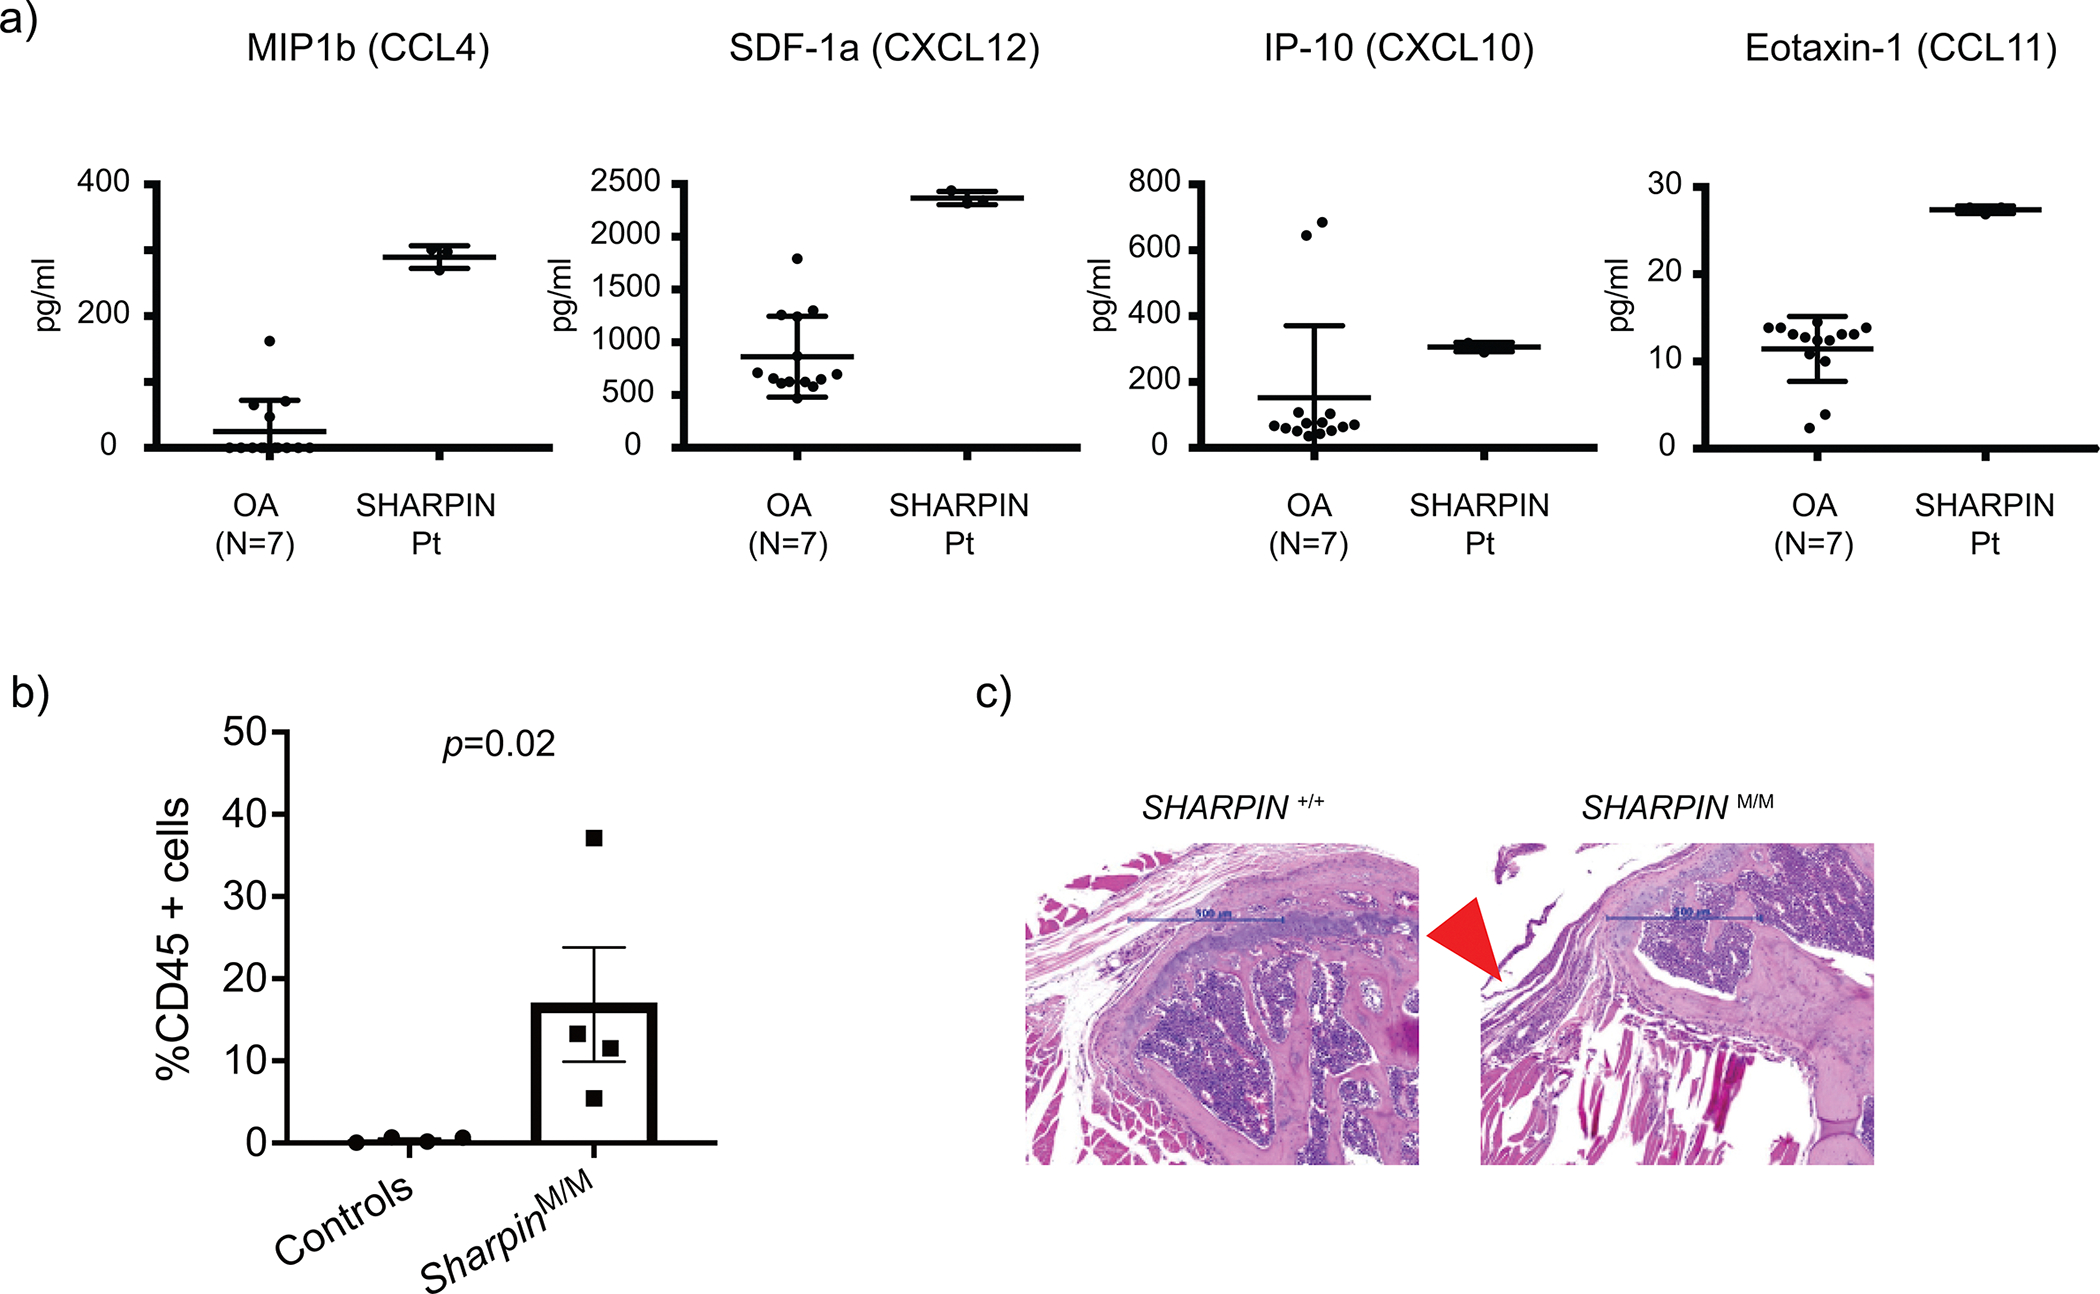
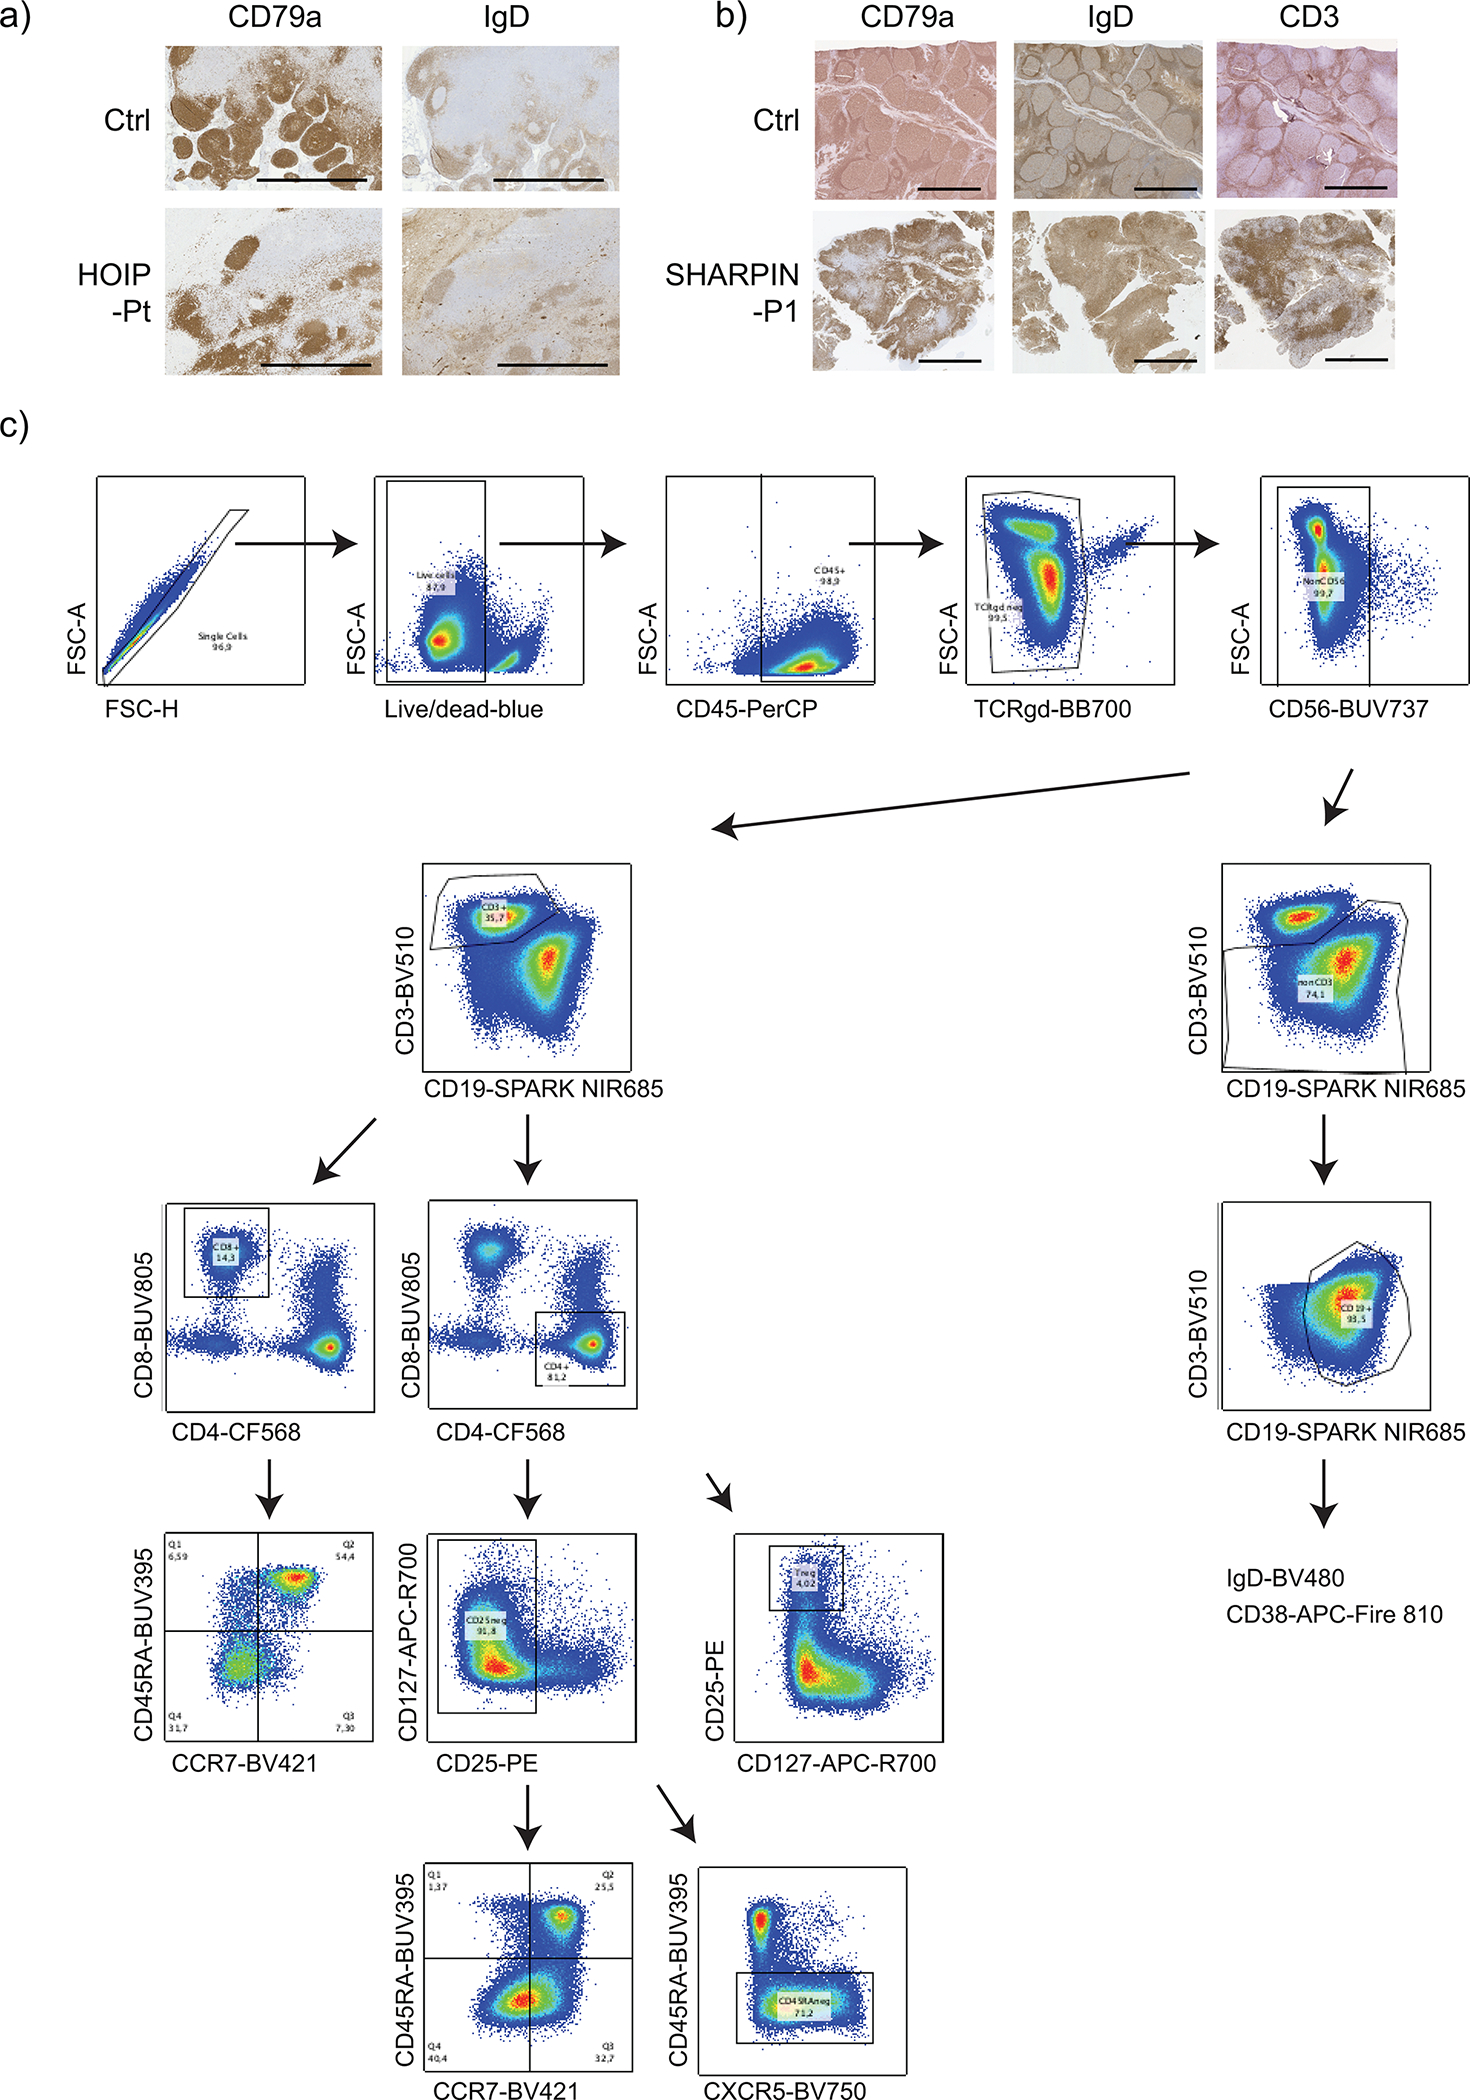
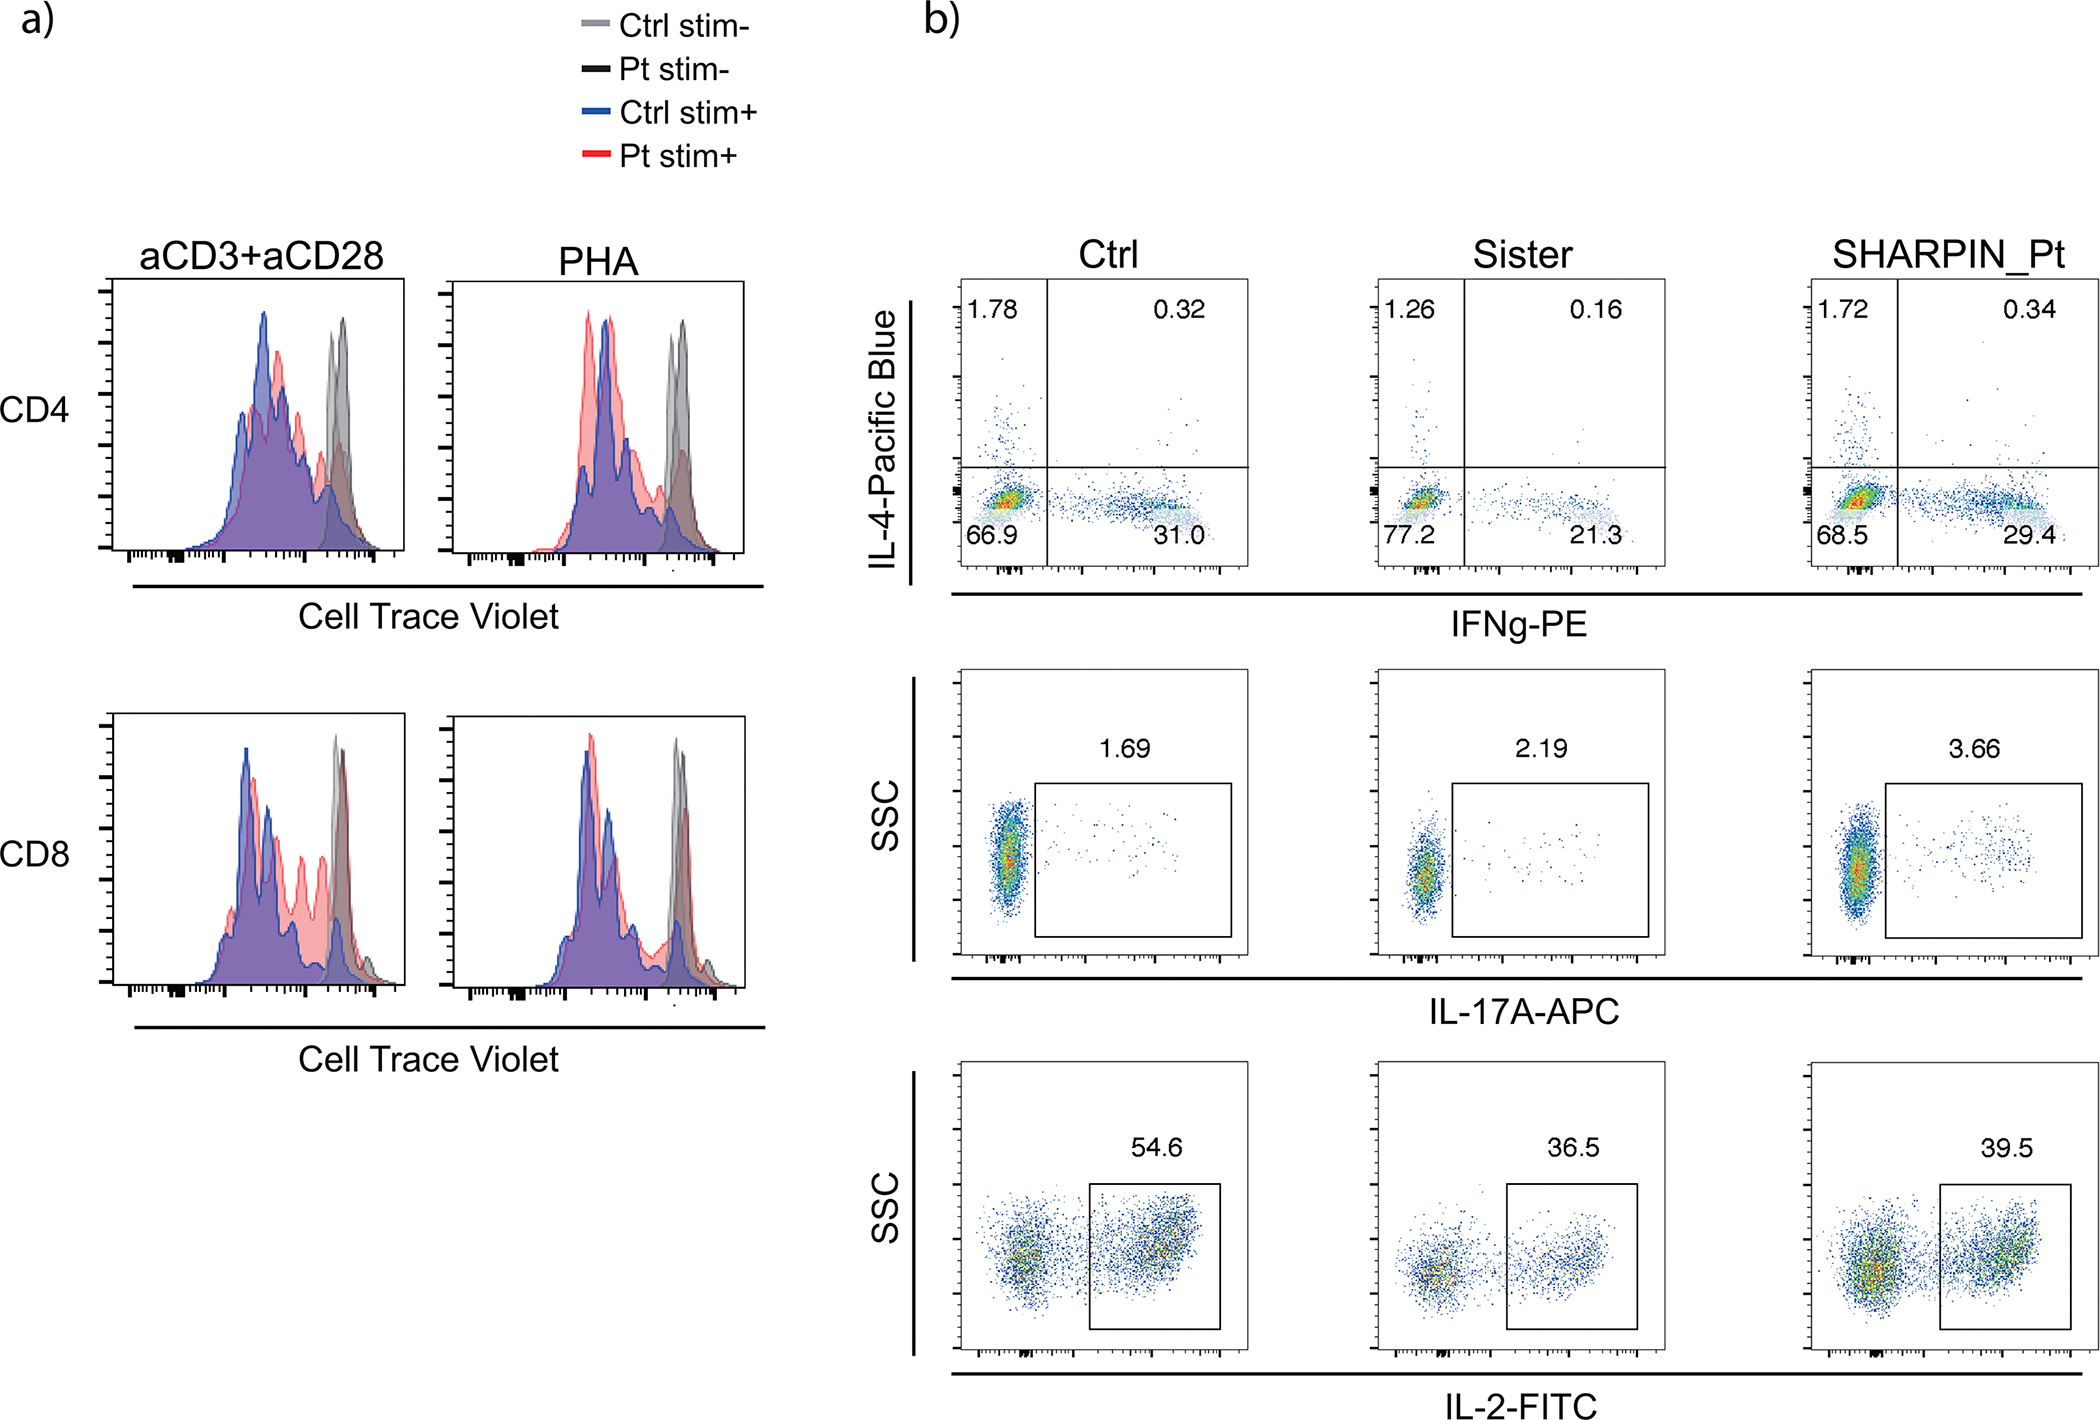
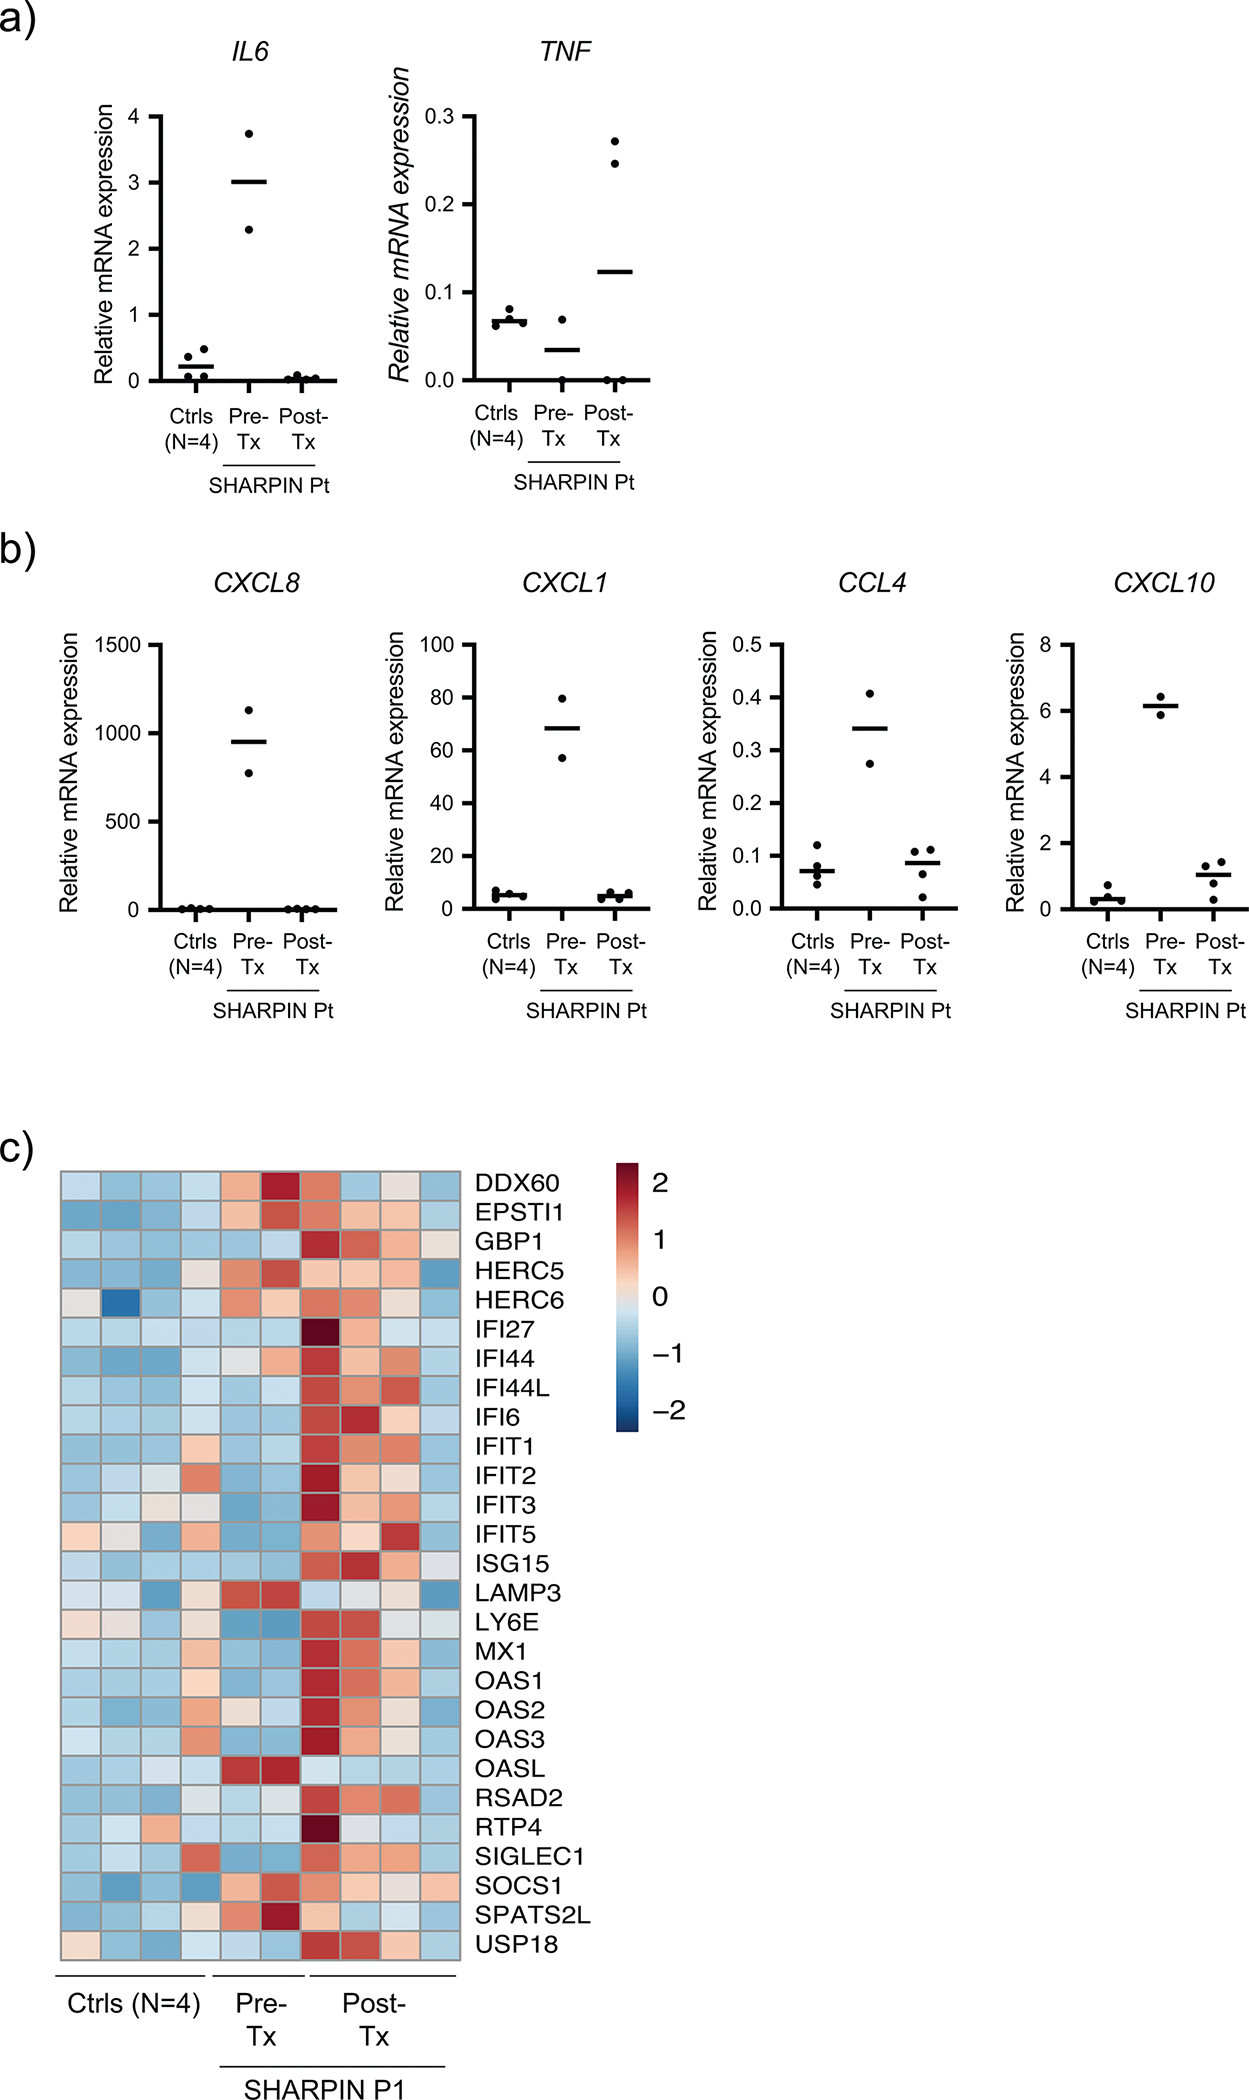
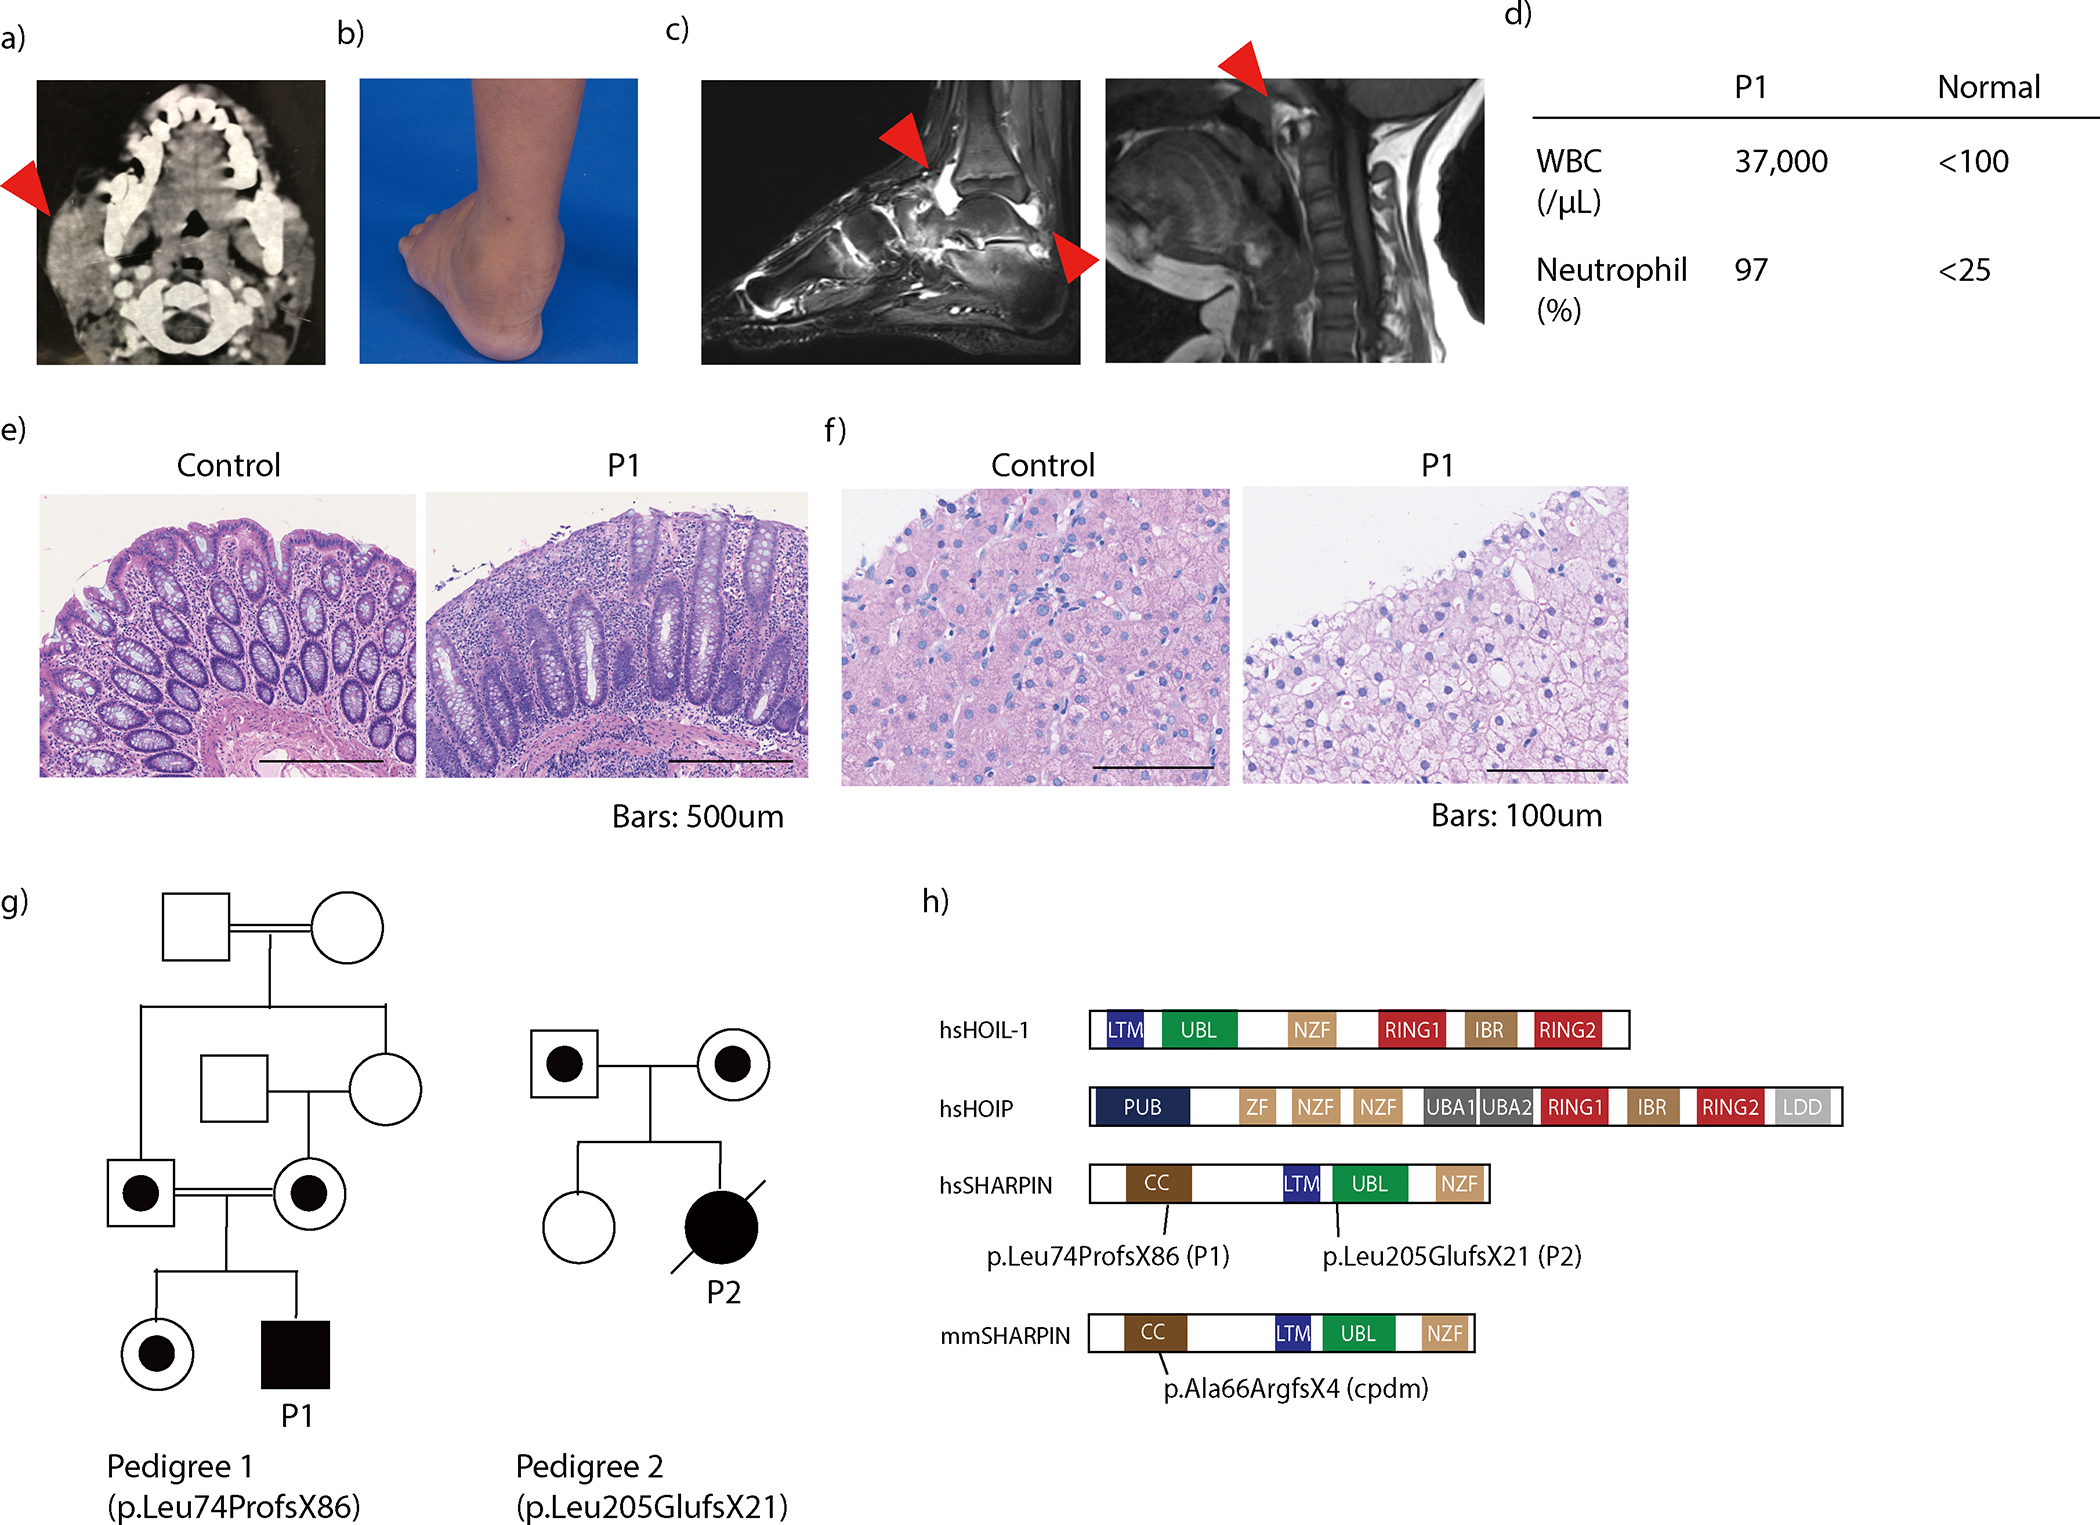
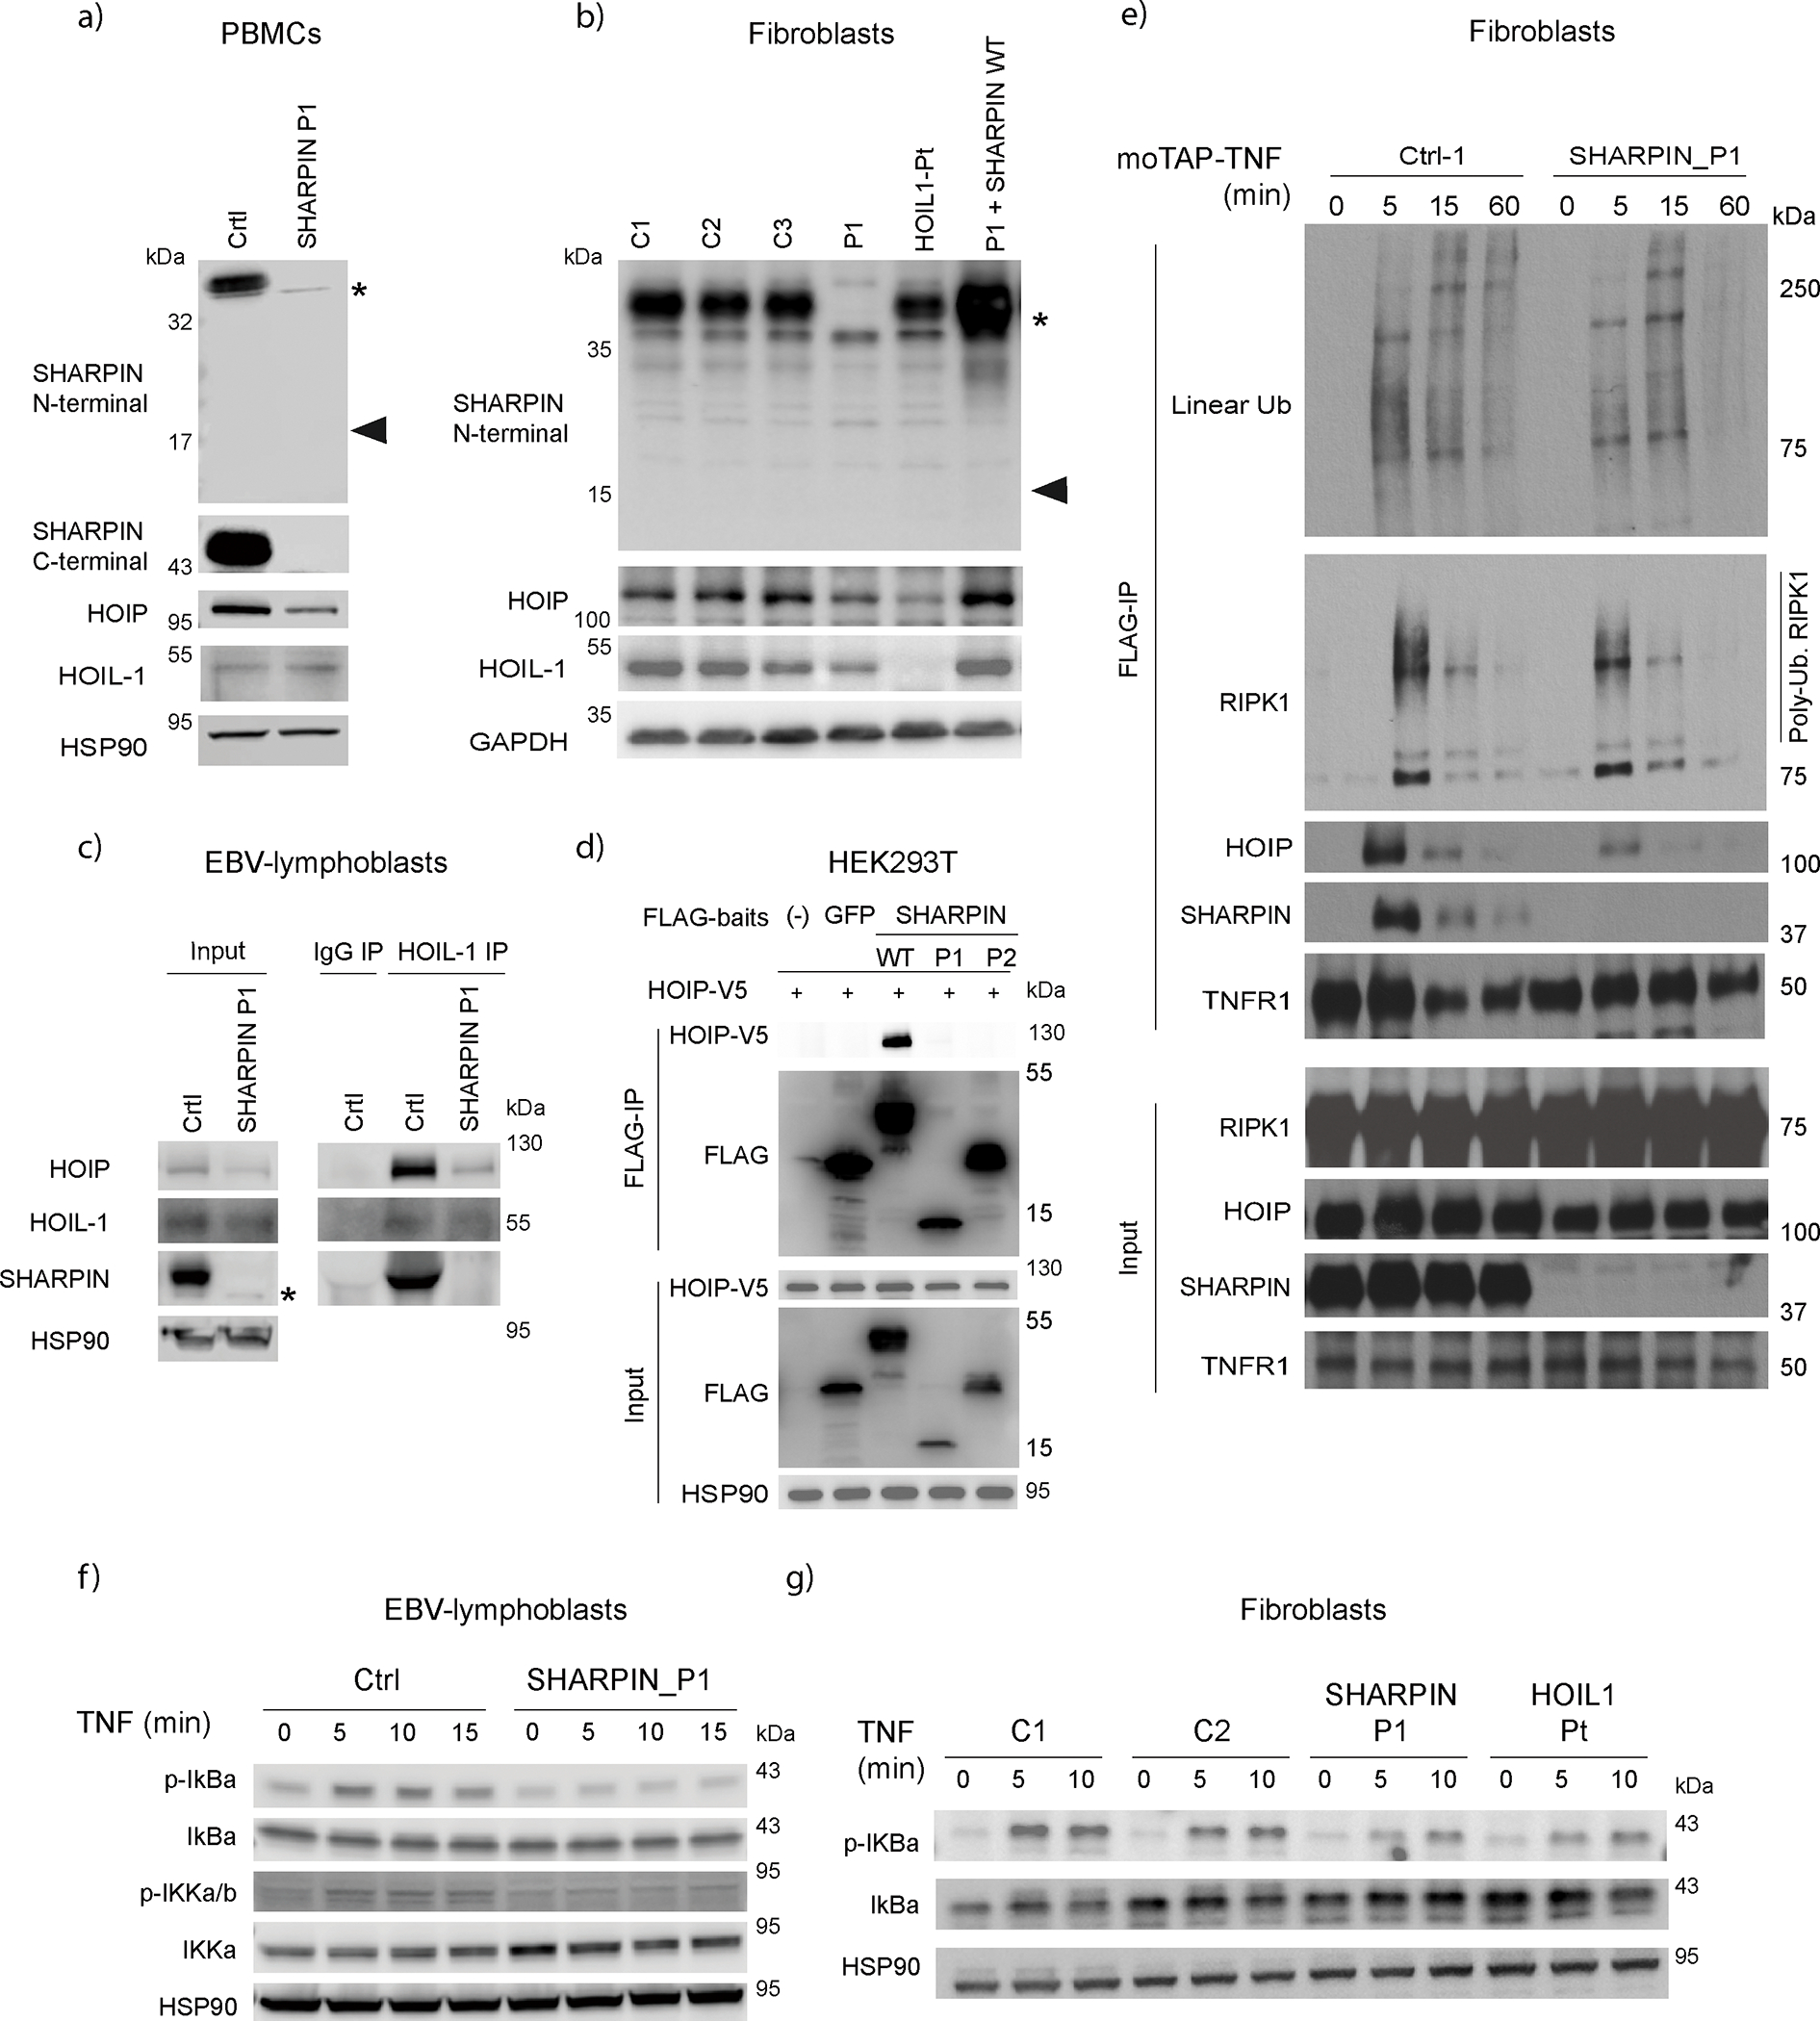
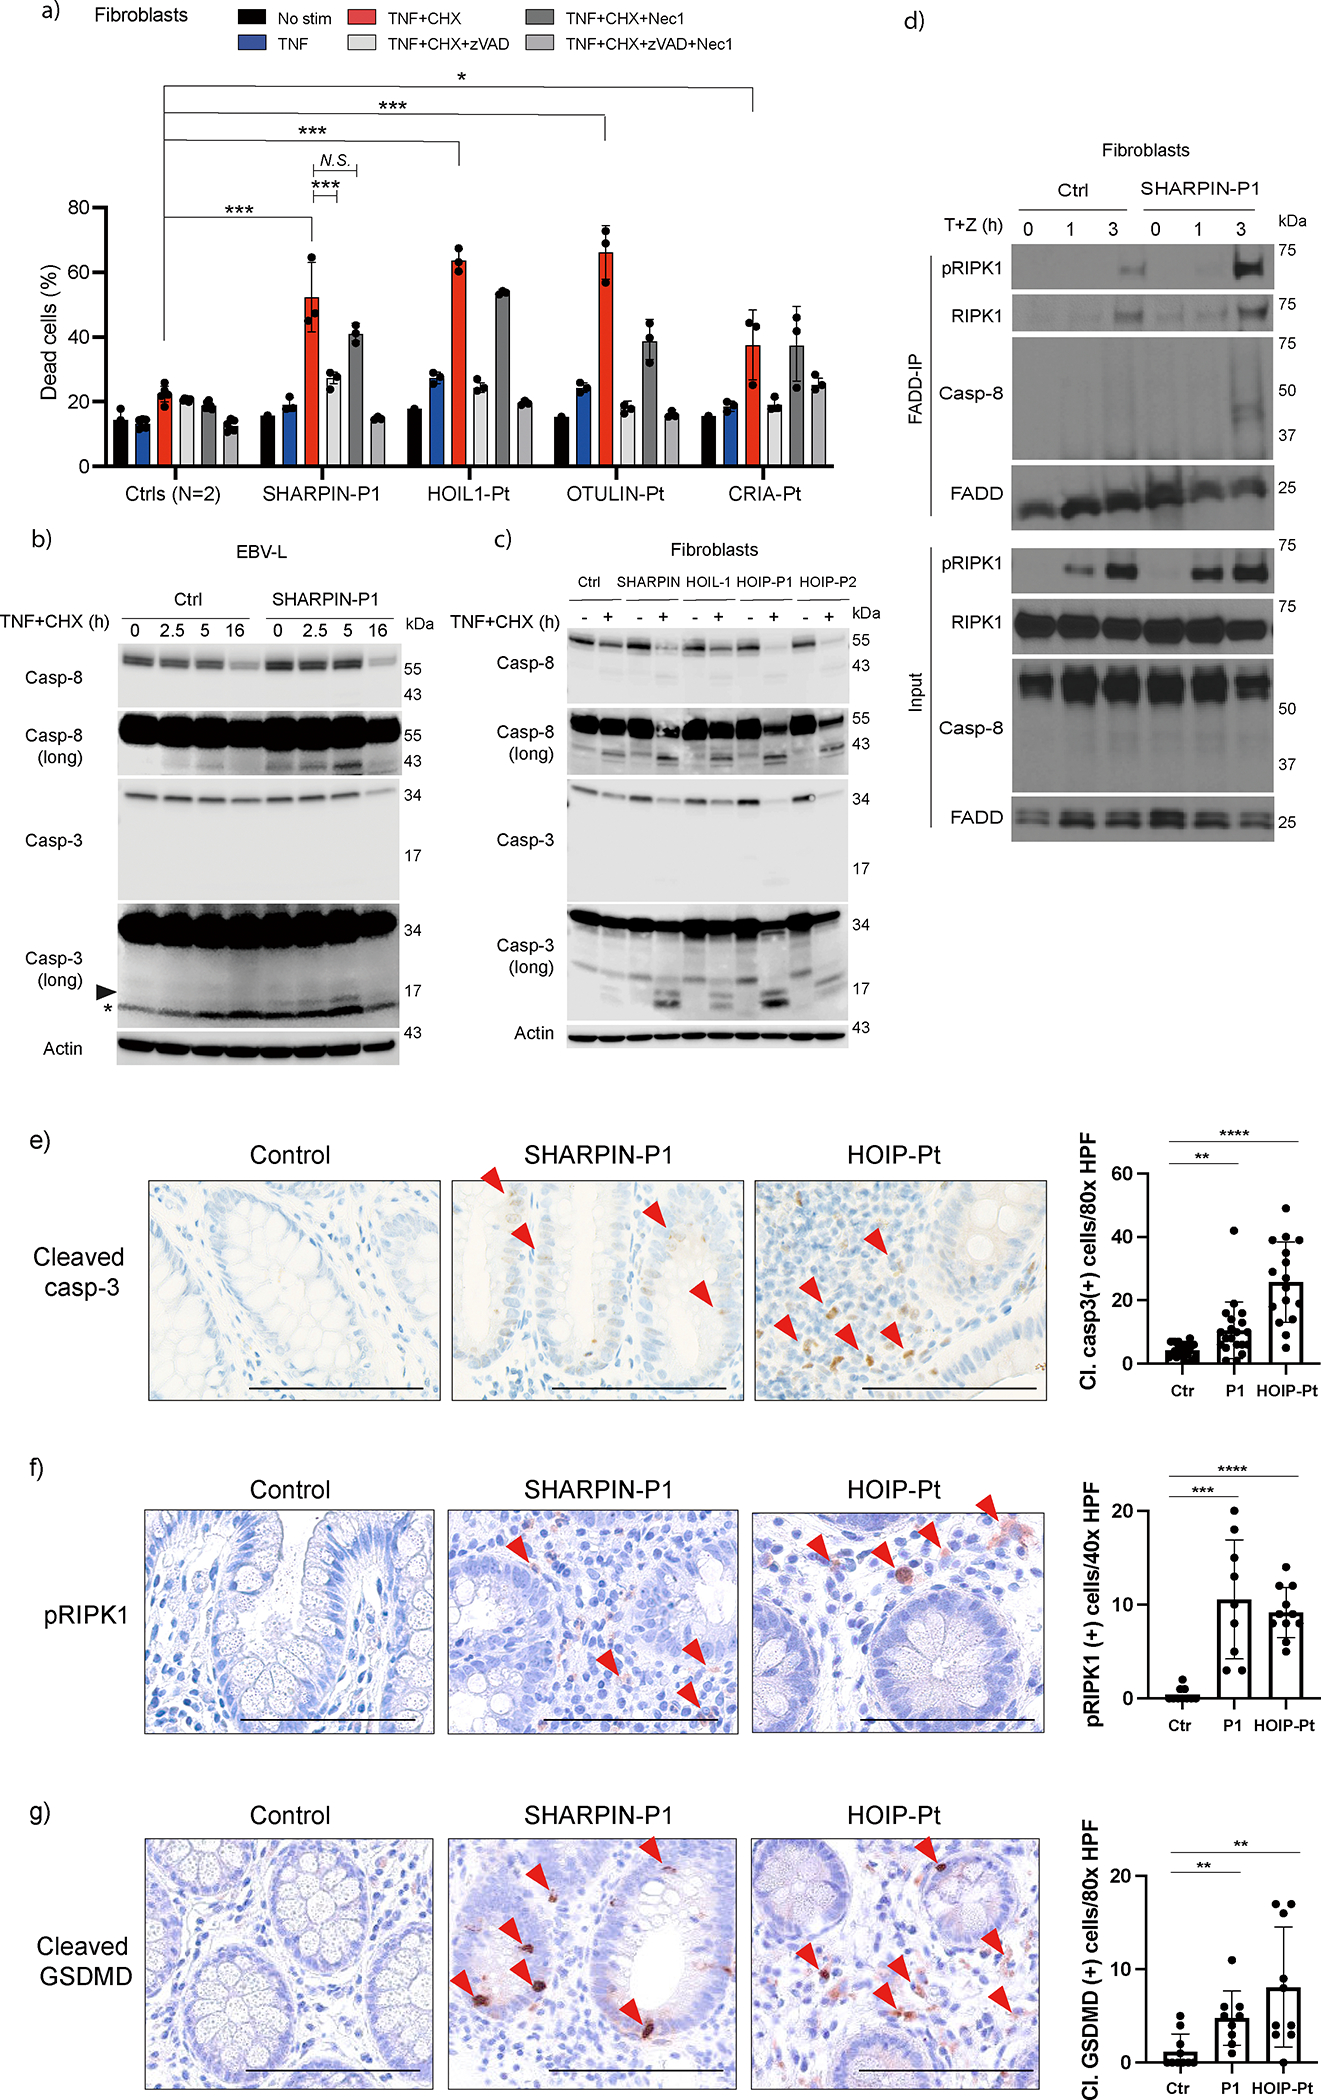
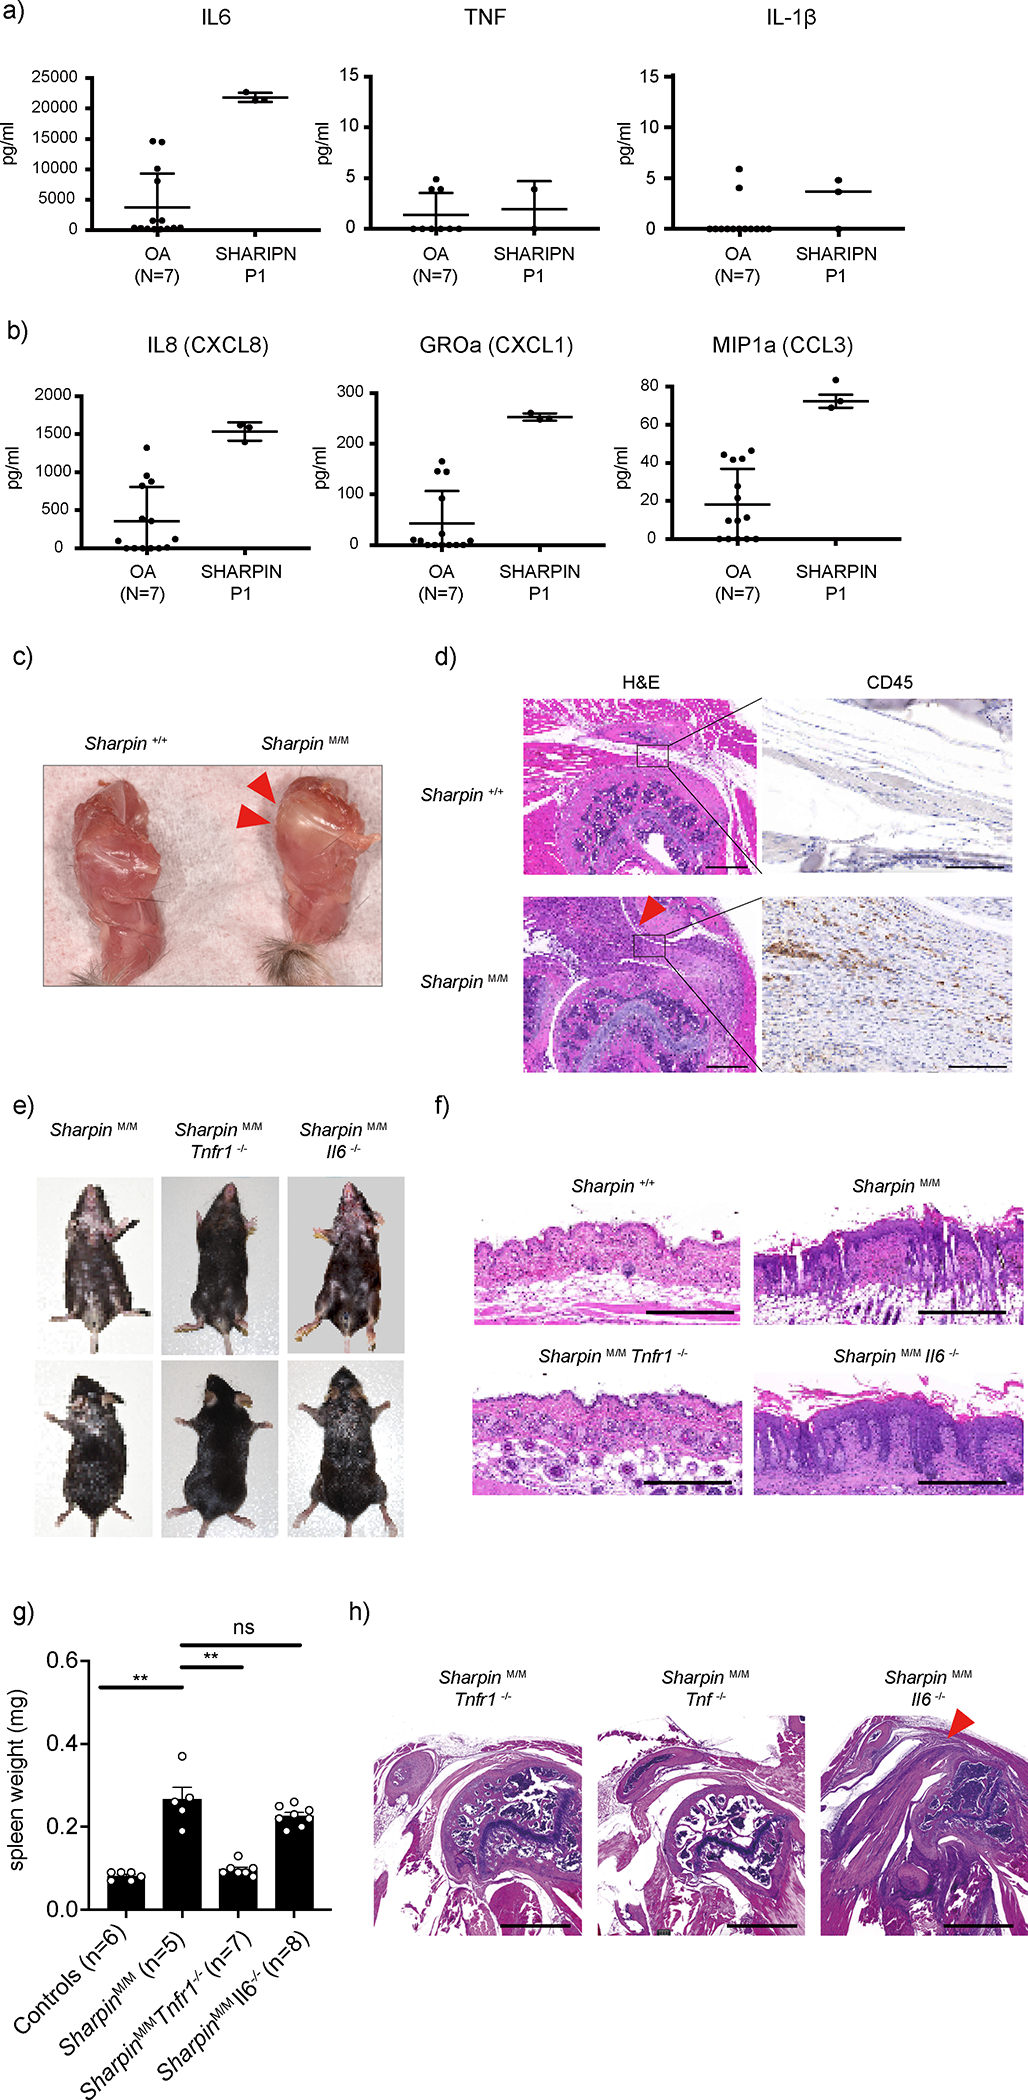
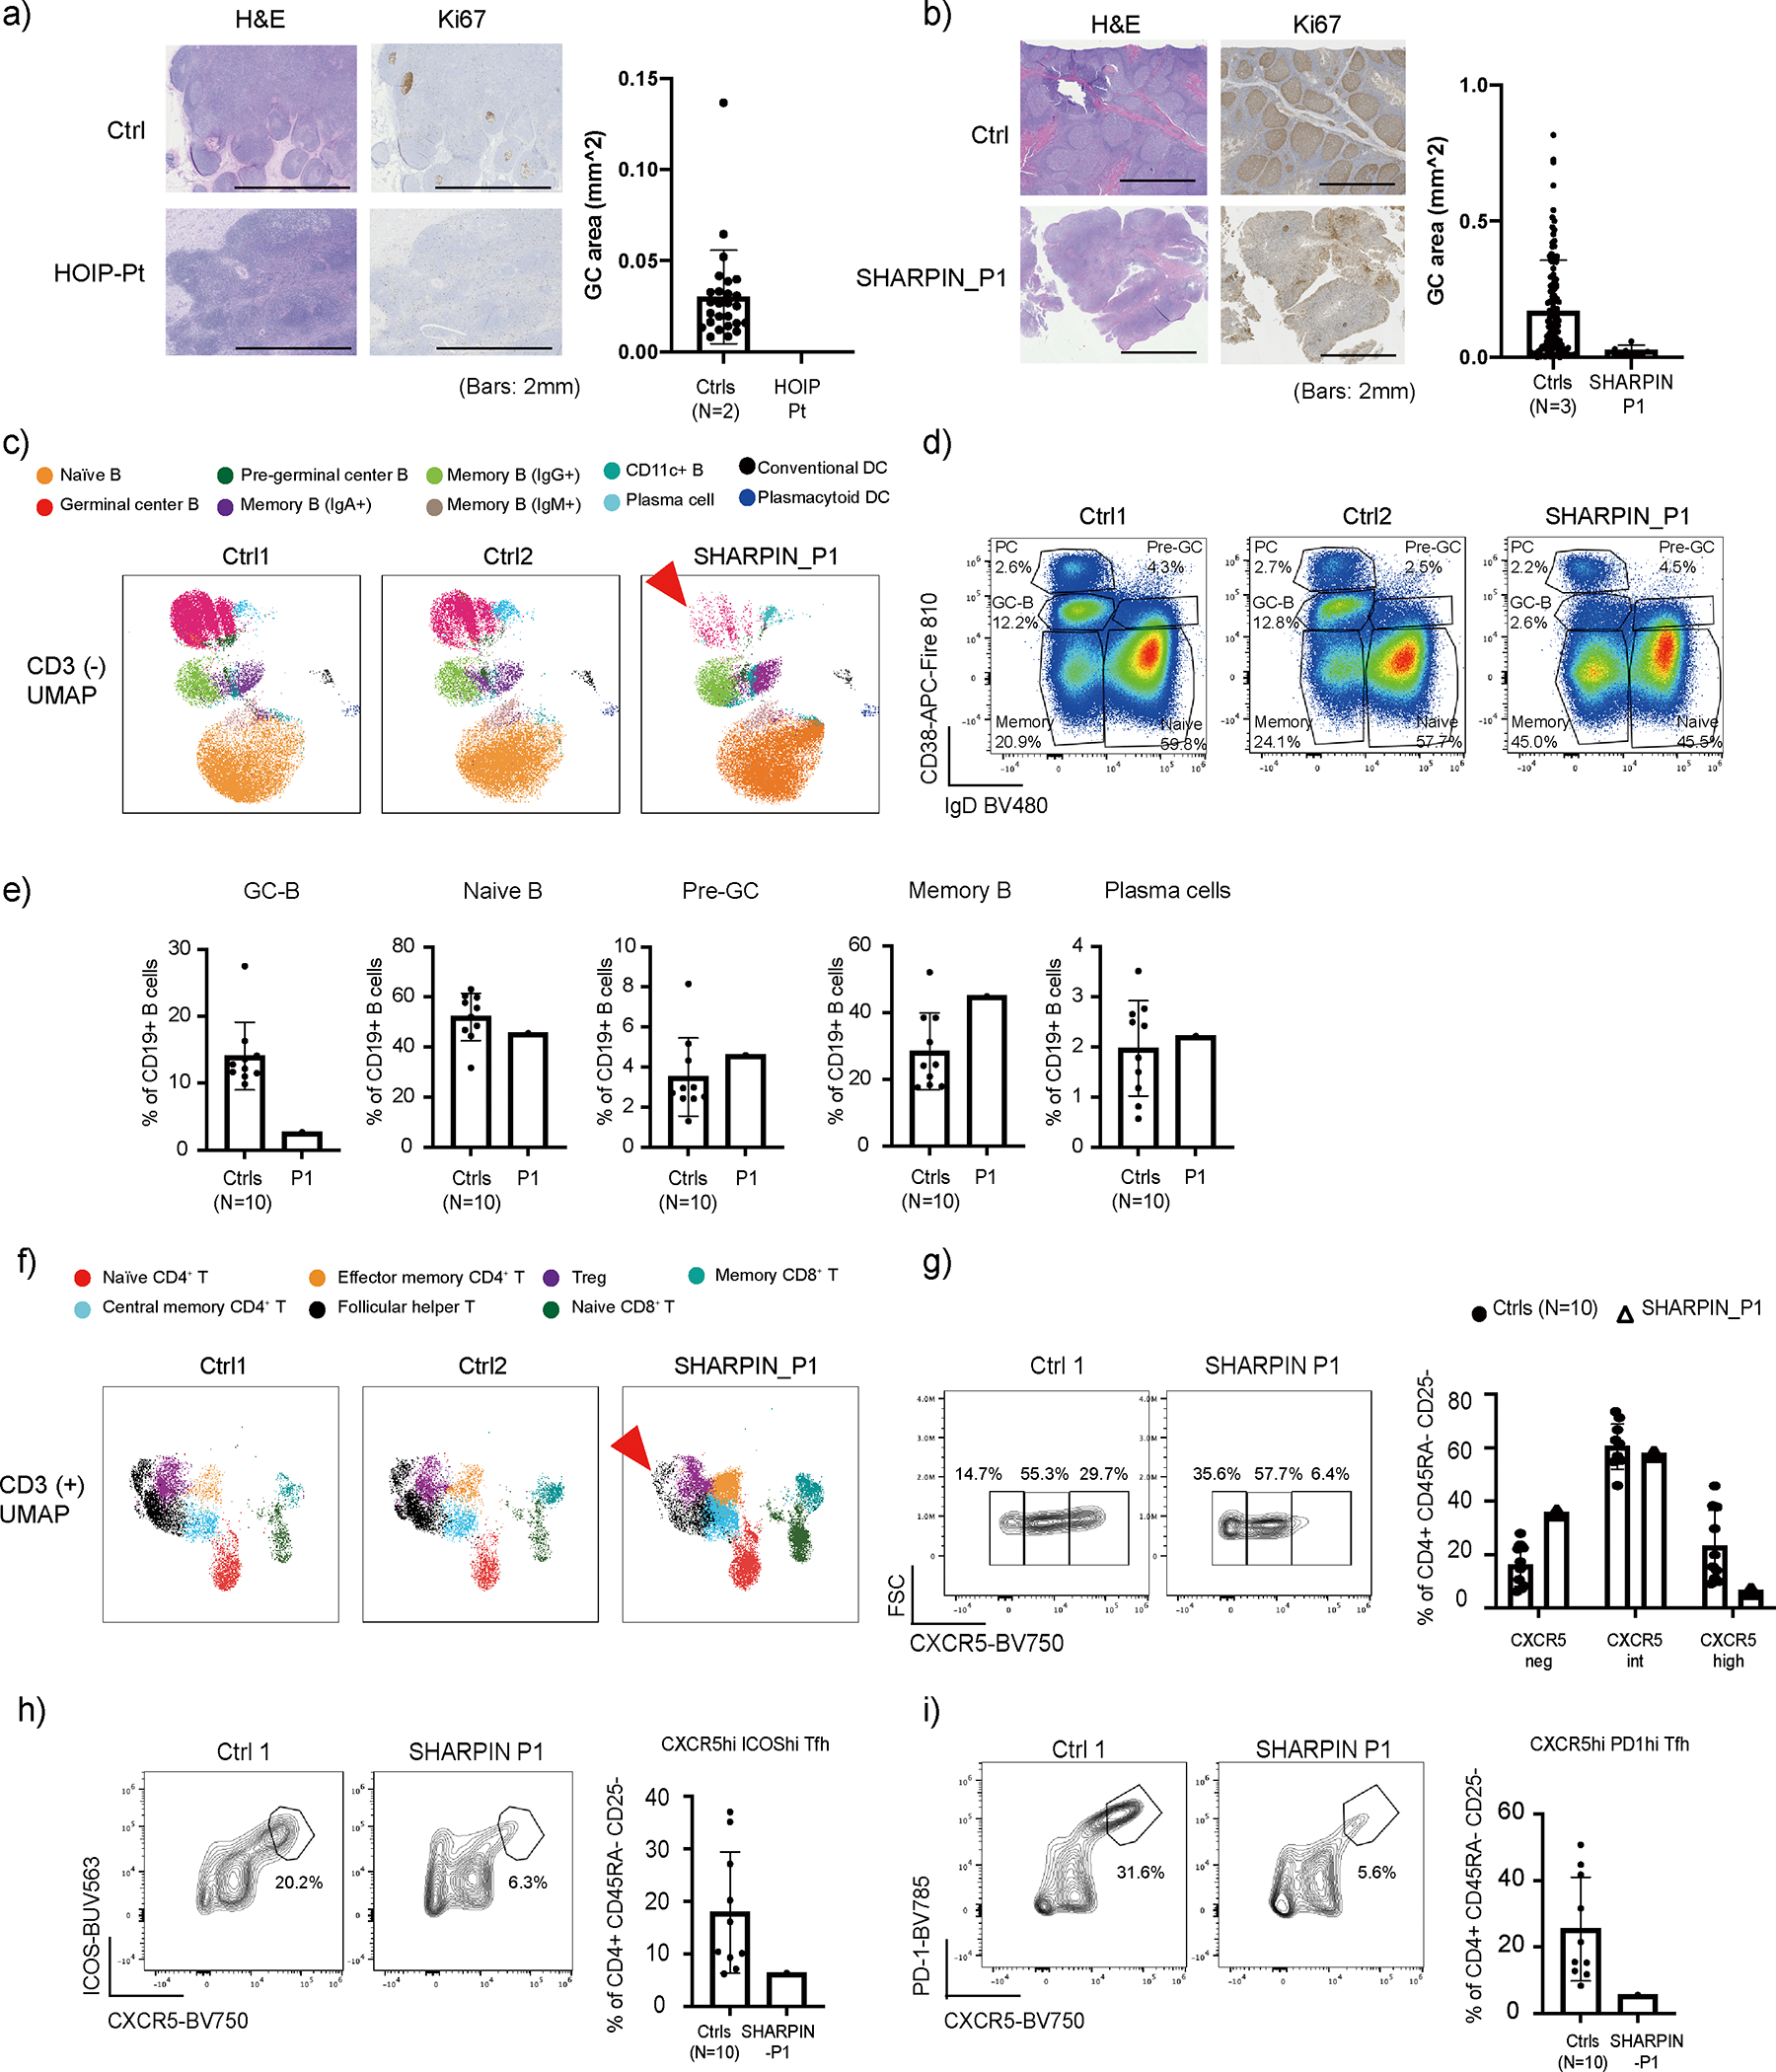
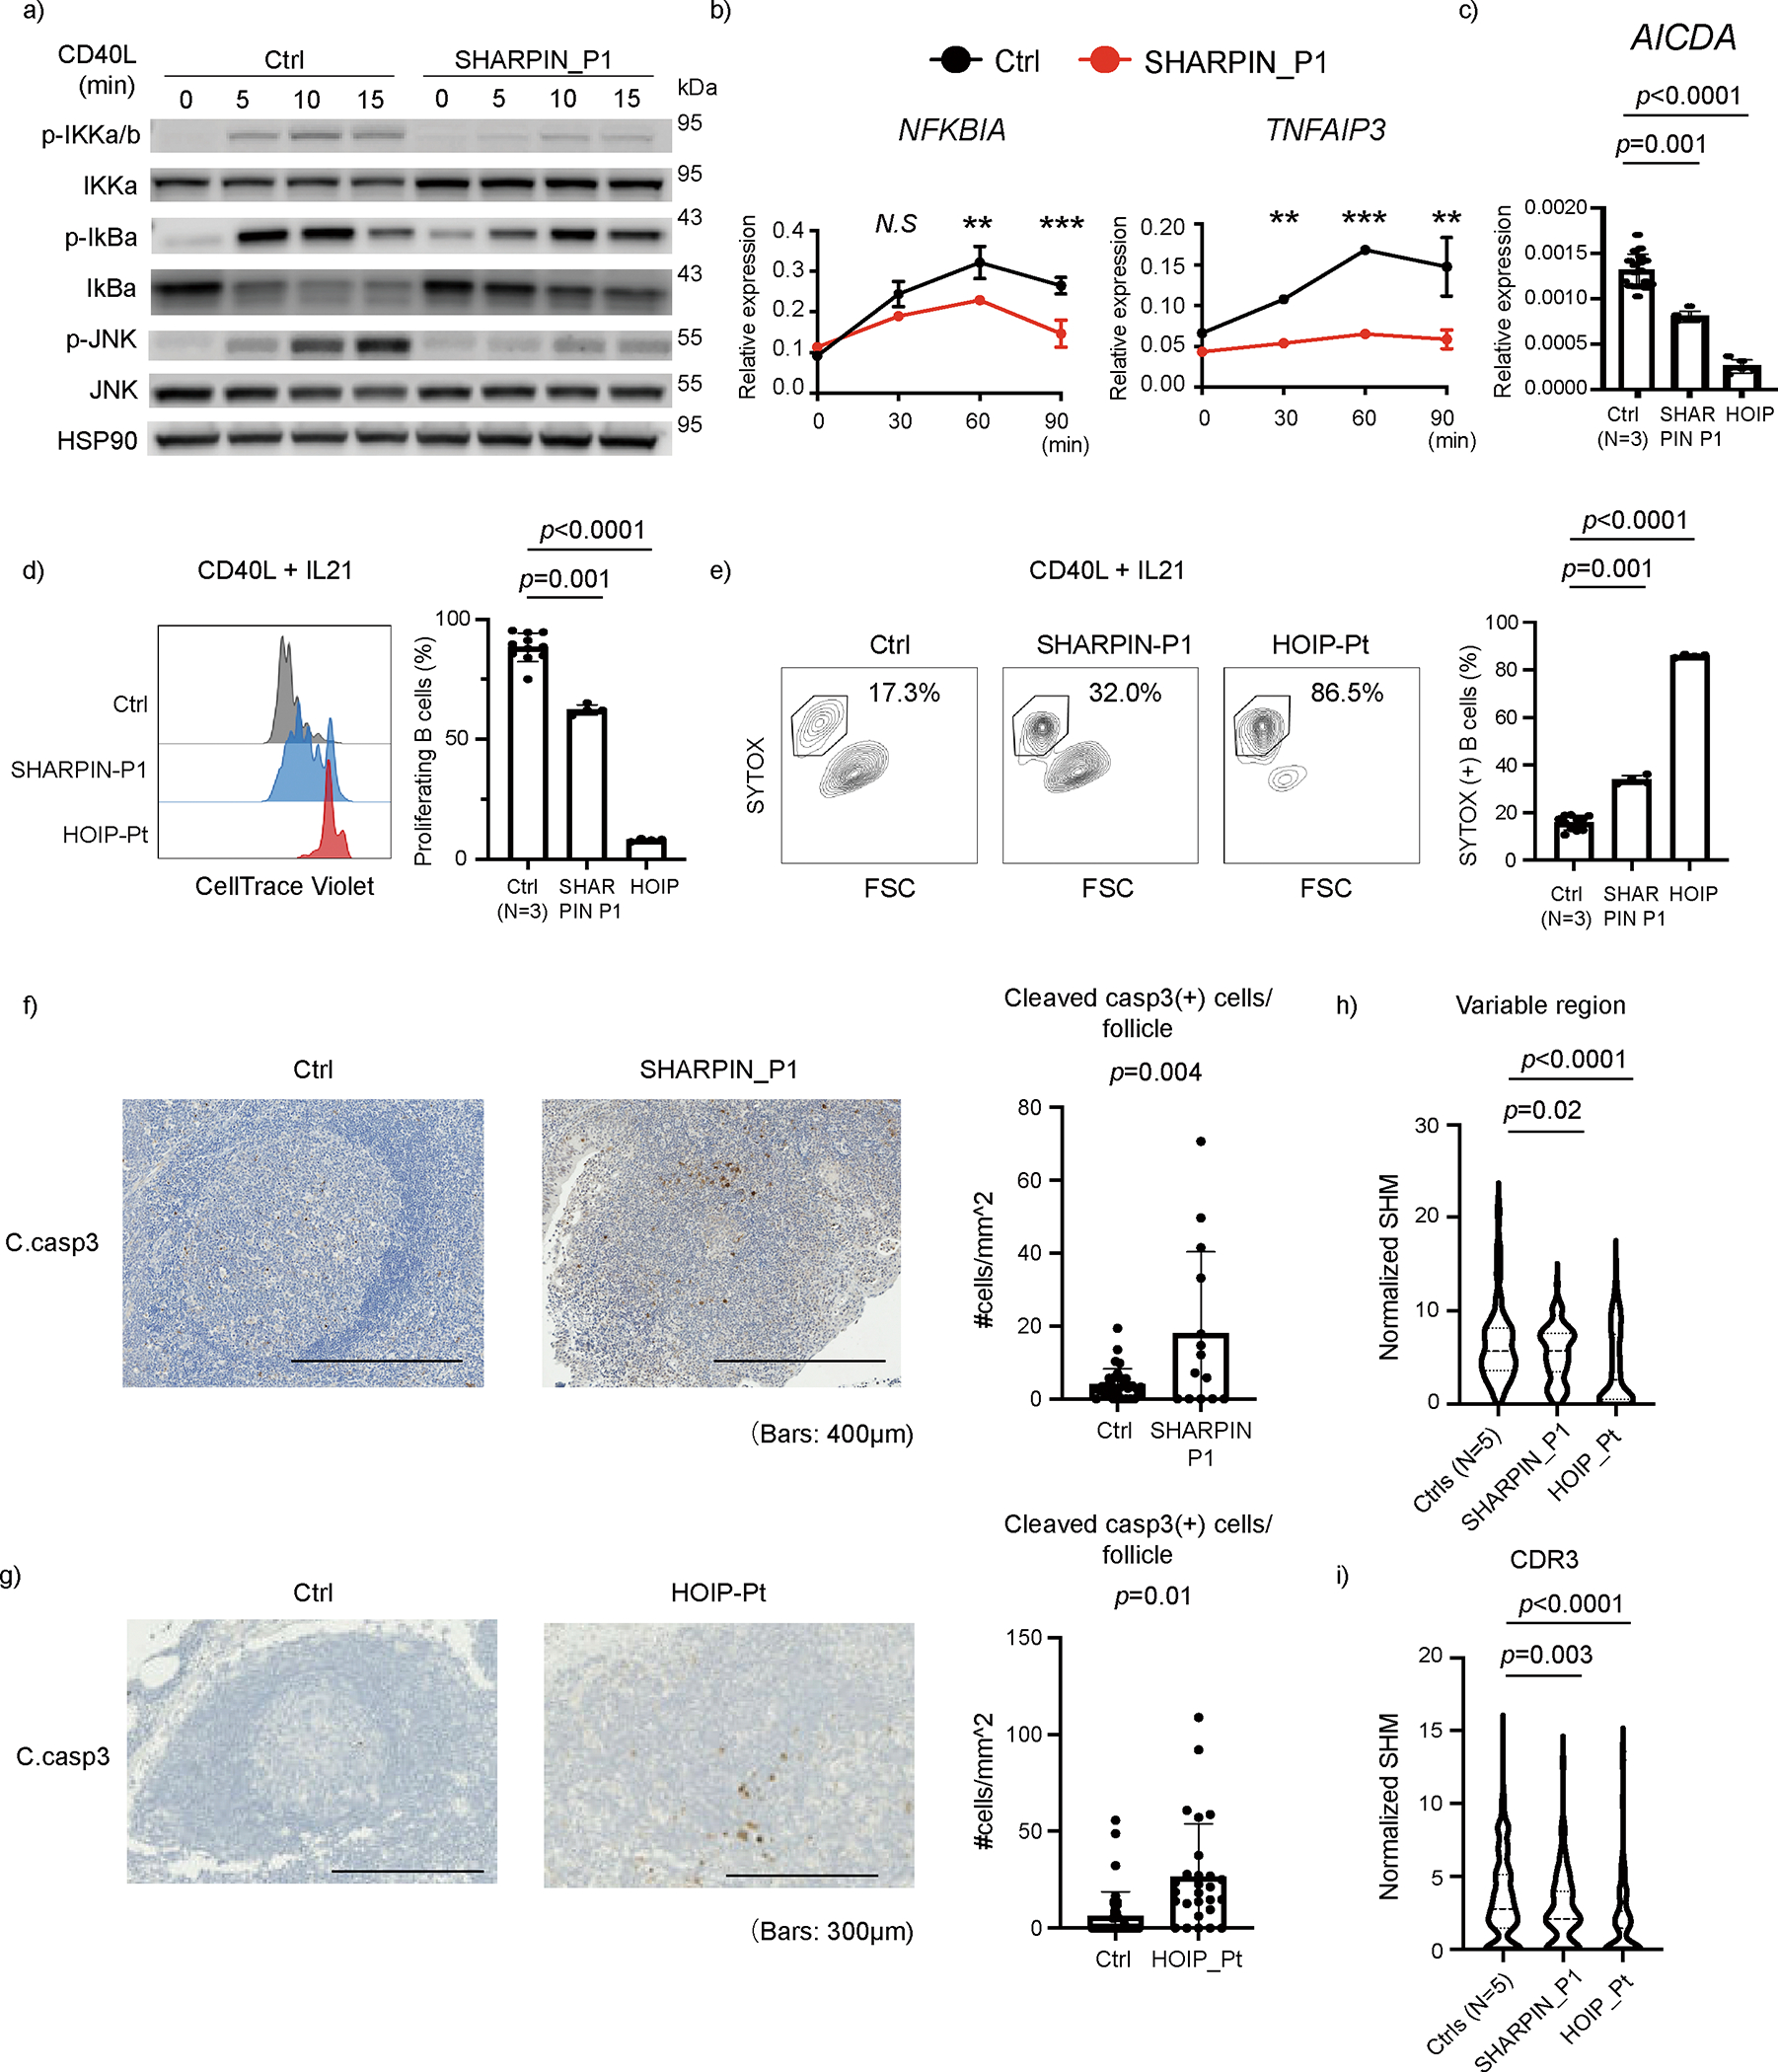
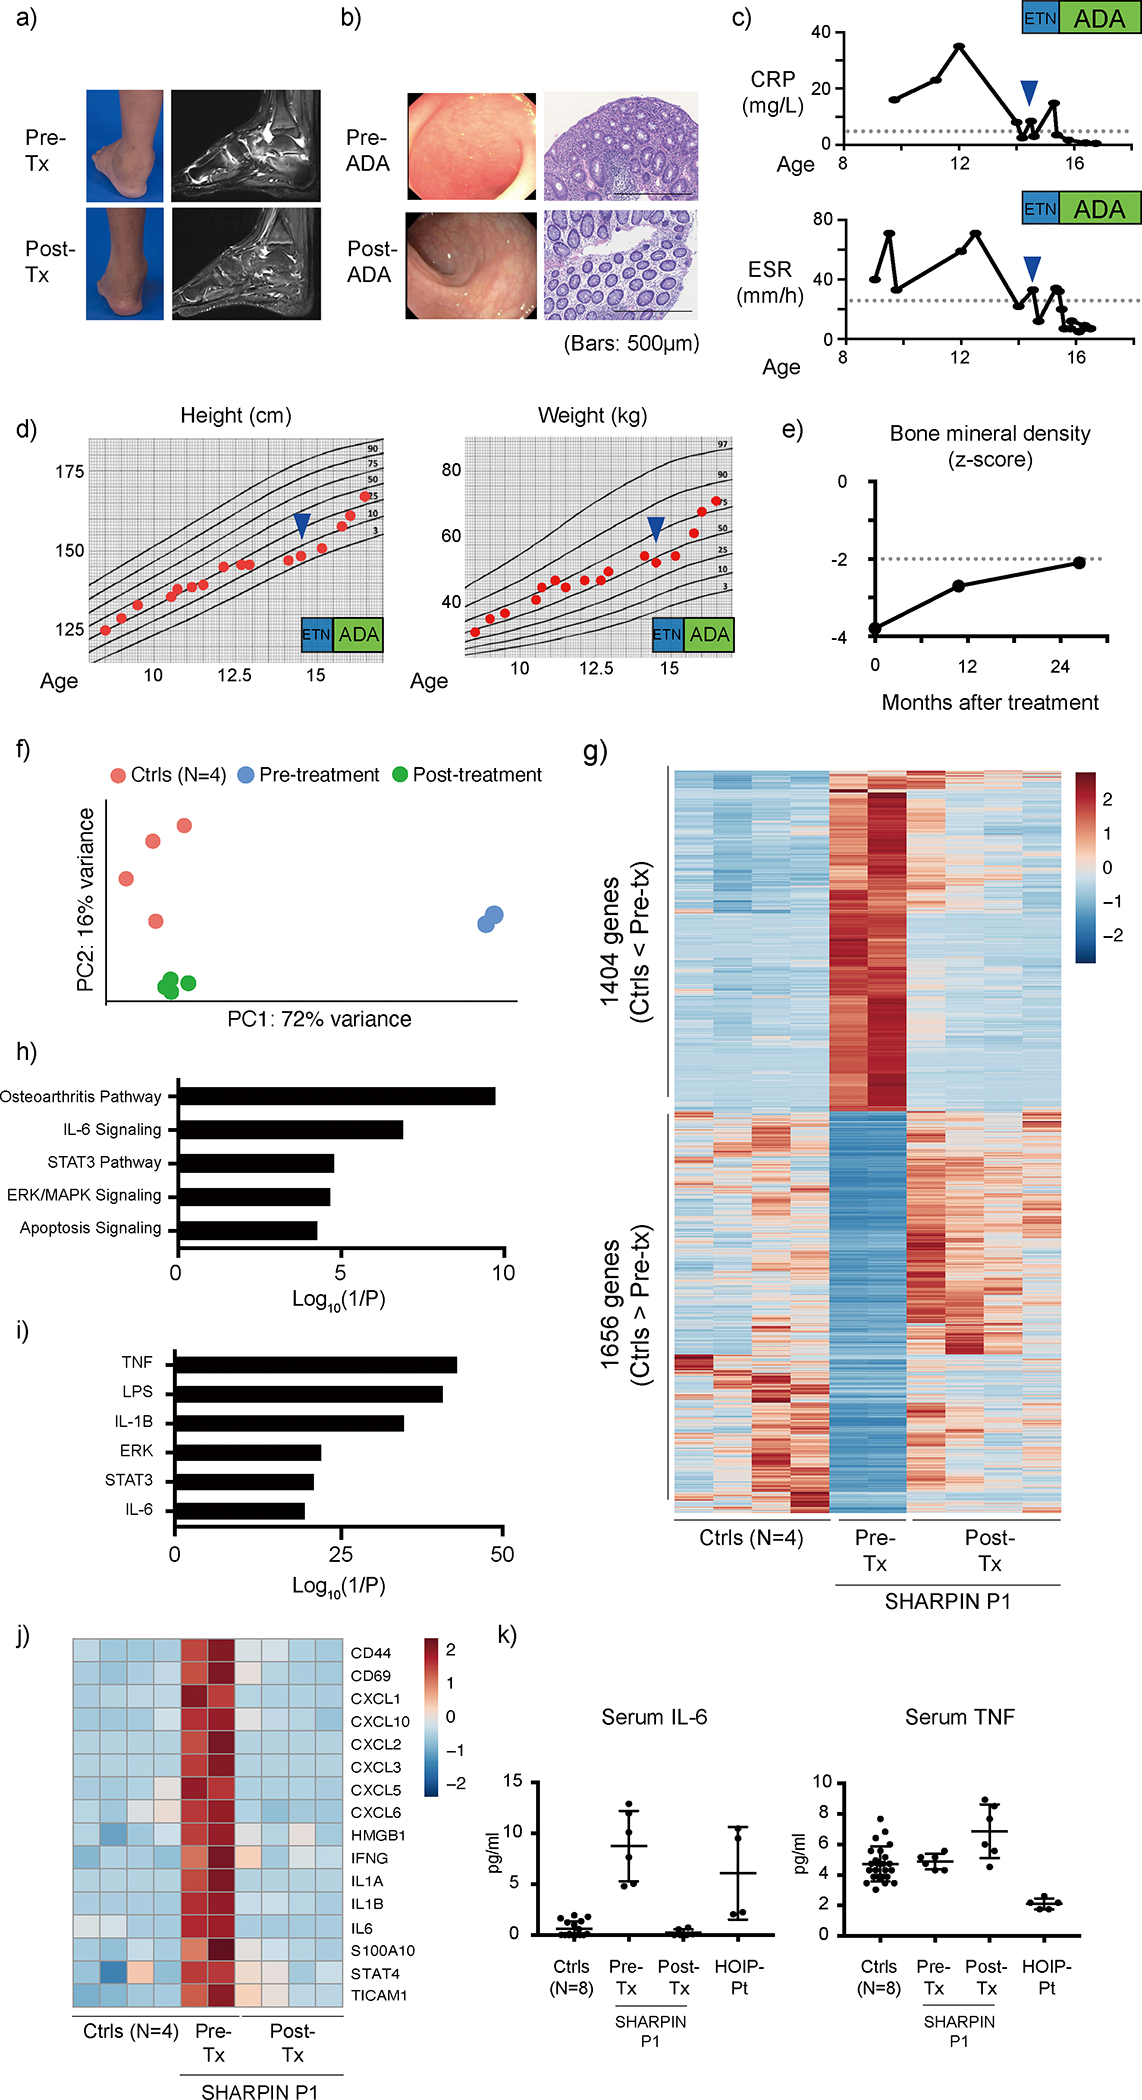
The linear ubiquitin assembly complex (LUBAC) consists of HOIP, HOIL-1 and SHARPIN and is essential for proper immune responses. Individuals with HOIP and HOIL-1 deficiencies present with severe immunodeficiency, autoinflammation and glycogen storage disease. In mice, the loss of Sharpin leads to severe dermatitis due to excessive keratinocyte cell death. Here, we report two individuals with SHARPIN deficiency who manifest autoinflammatory symptoms but unexpectedly no dermatological problems. Fibroblasts and B cells from these individuals showed attenuated canonical NF-κB responses and a propensity for cell death mediated by TNF superfamily members. Both SHARPIN-deficient and HOIP-deficient individuals showed a substantial reduction of secondary lymphoid germinal center B cell development. Treatment of one SHARPIN-deficient individual with anti-TNF therapies led to complete clinical and transcriptomic resolution of autoinflammation. These findings underscore the critical function of the LUBAC as a gatekeeper for cell death-mediated immune dysregulation in humans.


Conflict of interest statement

DISCLOSURE

S.P. is currently an employee of AstraZeneca and may own stock or stock options. All the other authors declare that they have no conflicts of interest.

Figures

Extended Data Figure 1:
Extended Data Figure 1:. Genetic analysis, SHARPIN expression, complex I formation and non-canonical NF-κB activation.
(a) Sanger sequence electropherograms demonstrating homozygous frameshift variants in the patients. (b) Population allele frequency and CADD score for SHARPIN variants homozygous in public databases. The two SHARPIN variants appear in red. CADD-Mutation Significance Score (MSC) cutoff for SHARPIN (90% confidence interval) was indicated by dashed line. NR: not reported. (c-d) Normalized mRNA levels of SHARPIN in (c) PBMCs and (d) fibroblasts from LUBAC-deficient patients and healthy controls. RNA was extracted from each sample and was measured with technical quadruplicates. Mean value is displayed as a bar. (e-f) TNFR1-signaling complex (TNFR1-SC) formation in fibroblasts from P1 and two unrelated healthy controls. Fibroblasts were stimulated with modified tandem affinity purification (moTAP)-tagged TNF (1 μg/ml) for the indicated times. TNFR1-SC was purified with anti-FLAG immunoprecipitation, and analyzed by western blotting. Supporting data for Fig. 2e. (g) Normal induction of non-canonical NF-κB in P1. Total PBMCs were stimulated with anti-CD3 (aCD3) for the indicated durations, and the expression of NFKB2 p100 (full length) and p52 (active form) was detected by western blot. Sis: P1’s sister carrying a heterozygous p.Leu74ProfsX86 variant. Representative result of two independent experiments.
Extended Data Figure 2:
Extended Data Figure 2:. Cytokine expression studies ex vivo in LUBAC-deficient patients.
(a) Cytokine expression in LUBAC-deficient monocytes. PBMCs from SHARPIN (P1)- and HOIP-deficient patients and two healthy controls were stimulated with IL-1β (10 ng/ml) for 6h, and the intracellular accumulation of cytokines in CD14+ monocytes were quantified by flow cytometry. (b-c) Cytokine secretion from LUBAC-deficient PBMCs. PBMCs from SHARPIN and HOIP-deficient patients and two healthy controls were stimulated with (b) LPS (1 μg/ml) or (c) IL-1β (10 ng/ml) for 6h, and secreted cytokines were measured by ELISA. (d-e) Cytokine secretion from LUBAC-deficient fibroblasts. Fibroblasts from SHARPIN (P1)- and HOIP-deficient patients and two healthy controls were stimulated with (d) LPS (1 μg/ml) or (e) IL-1β (10 ng/ml) for 24h, and secreted cytokines were measured by ELISA. (a-e) The experiments were performed with biological triplicates (a,d,e) or duplicates (b,c), and shown are the representative of two independent experiments. Mean values ± s.d are displayed.
Extended Data Figure 3:
Extended Data Figure 3:. Cell death induction assays
(a) Cell death assay using immortalized mouse embryonic fibroblasts from Sharpin-deficient mice stably reconstituted with wild type SHARPIN or patient-derived SHARPIN mutants. (b-c) Cell death assay using fibroblasts from a SHARPIN-deficient patient (P1), a patient with HOIL1 deficiency, otulipenia and cleavage resistant RIPK1-induced autoinflammation (CRIA), and two unrelated healthy controls. The cells were stimulated with TNF (100 ng/ml) combined with (b) smac mimetic (SM: compound A: 100nM) or (c) human recombinant TWEAK (50 ng/ml), in the presence or absence of zVAD (pan-caspase inhibitor: 20 μM) or Nec1 (RIPK1 inhibitor: 50 μM). The dead cell percentages after 16 h of treatment are shown. (a-c) The experiments were performed with biological triplicates (a, b) or duplicates (c), and shown are representative of two (a, c) or five (b) independent experiments. Mean values ± s.d are displayed. Quantitative data were analyzed using one-way ANOVA followed by Tukey-Kramer test. *p < 0.05, **p < 0.01, ***p < 0.001, ****p < 0.0001, N.S., not significant. (d) Western blot analysis of caspase-3 cleavage in cell lysates from fibroblasts from SHARPIN-deficient patient and two unrelated healthy controls. The cells were stimulated with TNF (100ng/ml) and cycloheximide (CHX 50 μg/ml) for the indicated times. Supporting data for Fig. 3c. (e-f) Necroptosis induction assay using EBV-immortalized lymphoblastoid cells (e) and fibroblasts (f) from SHARPIN-deficient patient. The fibroblasts were stimulated with TSZ (TNF, smac mimetic (compound A) and zVAD) for the indicated time. HT29 cells were used as a positive control for the phospho-antibodies. Representative result of two independent experiments. (g) Complex II immunoprecipitation in fibroblasts from SHARPIN-deficienct P1 compared with an unrelated healthy control. Fibroblasts were stimulated with TNF + zVAD for the indicated times, and the lysates were subjected to immunoprecipitation. Supporting data for Fig. 3d.
Extended Data Figure 4:
Extended Data Figure 4:. In vivo and in vitro characterization of cell death in human LUBAC deficiency.
(a) Hematoxylin and eosin (H&E) staining of colon biopsy samples from LUBAC-deficient patients. Bars: 0.4mm. These images were obtained as a part of clinical testing and were not repeated. (b-c) Supporting data for Fig. 3g to validate the specificity of p-RIPK1 antibody to detect RIPK1 Ser166 phosphorylation with (b) western blot and (c) immunocytochemistry. HT29 cells were stimulated with TSZ (TNF + smac mimetic (BV6) + zVAD) for 4h. Note that TSZ-stimulated cells show positive staining of pRIPK1, which was removed by λ-phosphatase treatment. (d-e) Supporting data for Fig. 3h to validate the antibody specificity for cleaved GSDMD (Asp275) with (d) western blot and (e) immunocytochemistry. THP1 cells were pre-incubated with LPS for 3h and were further stimulated with nigericin for another 1h. (b-e) These experiments were aimed to confirm the specificity of the antibodies and were not repeated. (f) Cleavage of GSDME in dermal fibroblasts stimulated with TNF (100 ng/ml) + CHX (50 μg/ml) for the indicated times. HeLa cells were used as a positive control. Representative result of two independent experiments.
Extended Data Figure 5:
Extended Data Figure 5:. Characterization of joint inflammation in SHARPIN deficiency.
(a) Multiplex ELISA measurement of chemokines in the sterile synovial fluid from P1 before the initiation of anti-TNF treatment and osteoarthritis (OA) control donors (N=7). The samples were measured in technical triplicate (P1) or duplicate (OA), respectively. Mean values ± s.d are displayed. (b) Quantification of CD45 positive cells in tendons of shoulder joints of control and Sharpin-deficient mice (n=4 for each group). Statistical method? Data are represented as mean values + SEM. (c) Representative hematoxylin and eosin (H&E) staining sections of elbow joints from Sharpin-deficient mice (N=) and wild type littermate control (N= _. Arrowhead indicates inflamed ligament.
Extended Data Figure 6:
Extended Data Figure 6:. Characterization of secondary lymphoid organ abnormalities in LUBAC deficiencies.
(a-b) Aberrant formation of lymphoid follicles and paracortex in secondary lymphoid organs from LUBAC deficient patients. (a) Lymph node histology of a HOIP-deficient patient compared with a control specimen from an unrelated donor. (b) Adenoid histology of SHARPIN-deficient P1 compared with a control specimen from an unrelated donor. The immunohistochemistry staining was not repeated due to the limited amount of clinical specimens. (c) Gating strategy for the adenoid spectral flow cytometry analysis. All cells were gated on singlet live CD45+ cells.
Extended Data Figure 7:
High dimensional spectral flow cytometry analysis of human adenoid samples. Adenoid single-cell suspensions from SHARPIN-deficient P1 and 10 unrelated pediatric control donors were analyzed. (a) Quantification of CD3+, CD4+, CD8+ and CD20+ populations in adenoid samples. (b-c) Surface immunoglobulin expression in GC-B (b) and memory B (c) populations. (d-e) Quantification of T cell subpopulations in the adenoid samples. Mean values ± s.d are displayed. The experiment was not repeated due to the limited amount of clinical specimens.
Extended Data Figure 8:
Extended Data Figure 8:. Normal T cell phenotyping results in the SHARPIN-deficient patient ex vivo.
(a) T cell proliferation assay. PMBCs were incubated with Cell Trace Violet, stimulated with anti-CD3/28 or PHA for 72h and analyzed by flow cytometer. (b) Intracellular cytokine staining for Th1, Th2 and Th17 populations. PBMCs were stimulated with PMA (100 ng/ml) and ionomycin (1 μM) for 5h with Brefeldin A. Stimulated cells were surface stained, fixed and permeabilized with BD Cytofix/Cytoperm kit. Cells were further stained for intracellular cytokines and analyzed by flow cytometry. Ctrl: unrelated healthy control, Sister: sister carrying the heterozygous frameshift SHARPIN variant p.Leu74ProfsX86. Representative result of two independent experiments.
Extended Data Figure 9:
Extended Data Figure 9:. Whole blood RNA sequencing.
(a-b) mRNA expression of selected cytokines (a) and chemokines (b) in the pre- and post-anti-TNF treatment P1 whole blood RNA samples as well as four age-matched healthy controls. (c) A heatmap demonstrating the changes of genes representative for type I interferon-stimulated gene signature in pre- and post-treatment samples from the SHARPIN-deficient P1.
Figure 1.
Figure 1.. Human SHARPIN deficiency causes autoinflammation and hepatic glycogenosis.
(a) Computed tomography imaging demonstrating the swelling of the right parotid gland (arrowhead) of patient 1 (P1) at age 5. (b) Swelling of P1’s left ankle before initiation of treatment with etanercept. (c) Magnetic resonance imaging demonstrating joint inflammation of P1’s ankle joint (left) and atlanto-axial joint (right). Arrowheads indicate inflammatory changes. (d) Pre-treatment sterile synovial fluid analysis from the ankle joint of P1. (e) Colitis in P1. (f) Hematoxylin and eosin staining of liver biopsy from P1 suggestive of glycogenosis. (g) Family pedigrees. (h) Schematic domain structures of the three LUBAC subunits. hs: Homo sapiens; mm: Mus musculus. (e-f) Representative of three biopsy specimens.
Figure 2.
Figure 2.. Human SHARPIN deficiency impairs canonical NF-κB mediated signaling
(a) LUBAC subunit expression in PBMCs from SHARPIN-deficient patient (P1) and an unrelated healthy donor. (b) LUBAC subunit expression in fibroblasts from three unrelated healthy donors, SHARPIN (P1)- and HOIL1-deficient patients, and in P1 fibroblasts complemented with wild type SHARPIN. (a-b) Note that the expected truncated SHARPIN protein (18kDa: arrowhead) was not observed. * indicates non-specific bands. (c) Western blot of immunoprecipitated extracts from EBV-immortalized lymphoblastic cells of P1 and a healthy donor. (d) Immunoprecipitation of LUBAC in HEK293T. V5-HOIP and FLAG-baits (SHARPIN or GFP) were transiently overexpressed in HEK293T, and immunoprecipitation using anti-FLAG beads was performed. The eluates were subjected to western blotting. (e) TNFR1-signaling complex (TNFR1-SC) formation in fibroblasts from P1 and a healthy donor. Fibroblasts were stimulated with modified tandem affinity purification (moTAP)-tagged TNF (1 μg/ml) for the indicated times. TNFR1-SC was purified with anti-FLAG immunoprecipitation, and analyzed by western blotting. (f-g) P1’s (f) EBV-immortalized lymphoblastic cells and (g) fibroblasts showed attenuated induction of NF-κB after TNF stimulation (20 ng/ml). These data are representative of three (a, b, e, g) or two (c, d, f) independent experiments.
Figure 3.
Figure 3.. Human LUBAC deficiencies trigger excessive TNF-induced cell death
(a) Cell death assay using fibroblasts from a SHARPIN-deficient patient (P1), a patient with HOIL1 deficiency, otulipenia and cleavage resistant RIPK1-induced autoinflammation (CRIA), and two unrelated healthy donors. The dead cell percentage after 16 h of treatment is shown. The experiments were performed with biological triplicates. Mean values ± s.d are displayed. Significance calculated with one-way ANOVA followed by Tukey-Kramer test. (b-c) Western blot analysis of caspase-3 and -8 activity in cell lysates from EBV-immortalized lymphoblasts (b) and fibroblasts (c) from LUBAC-deficient patients. Long: long exposure. (a-c) The cells were stimulated with TNF (100ng/ml) and cycloheximide (CHX:50 μg/ml) for the indicated times in the presence or absence of zVAD (pan-caspase inhibitor, 20 μM) or Nec1 (RIPK1 inhibitor, 50 μM). (d) Complex II immunoprecipitation in fibroblasts from SHARPIN-deficienct P1 compared with a healthy donor. Fibroblasts were stimulated with TNF + zVAD for the indicated times, and the lysates were subjected to immunoprecipitation. (e-g) Immunohistochemistry examination of (e) cleaved caspase-3, (f) pRIPK1 (Ser166) and (g) cleaved GSDMD (Asp275) using colon biopsy samples from LUBAC-deficient patients compared with an unrelated control donor specimen. The number of staining-positive cells per high power field (HPF) was quantified. Bars indicate 100μm. (a, e, f, g) Mean values ± s.d are displayed. Significance calculated with one-way ANOVA followed by Tukey-Kramer test. *p < 0.05, **p < 0.01, ***p < 0.001, ****p < 0.0001, N.S., not significant. (a-d) The ex vivo results are representative of five (a), three (c), or two (b, d) independent experiments. (e-g) These images are representative of three biopsy specimens per donor.
Figure 4.
Figure 4.. Loss of SHARPIN causes joint inflammation in human and mouse
(a-b) Multiplex ELISA measurement of (a) cytokines and (b) neutrophil-recruiting chemokines in the sterile synovial fluid of SHARPIN-deficient patient (P1) before the initiation of anti-TNF treatment, compared with osteoarthritis (OA) patients as a control (N=7). The samples were measured in technical triplicate (P1) or duplicate (OA), respectively. Mean values ± s.d are displayed. (c) A representative photo of shoulder joints from Sharpin-deficient mice (Sharpin M/M) compared with wild-type littermate control. Representative of 5 mice for each genotype. Arrowheads indicate an inflamed shoulder joint capsule. (d) Hematoxylin and eosin (H&E) and immunohistochemistry (CD45) staining sections of shoulder joints from Sharpin M/M and wild-type littermate control. Arrowhead indicates inflamed ligament indicative of enthesitis. Bars: 1mm (H&E) and 100μm (CD45). Representative of 4 mice for each genotype. (e) Dermatologic findings of Sharpin M/M crossed with Tnfr1- or Il6-deficient mice. Representative of more than 30 mice for each genotype. (f) H&E staining sections of the skin from wild-type and Sharpin M/M, crossed with Tnfr1- or Il6-deficient mice. Bars: 0.5mm. Representative of 3 mice for each genotype. (g) Spleen weights of mice of indicated genotypes. Spleen weights were taken at ~12 week-old mice. Data are represented as mean values + SEM. Significance calculated with a two-tailed Mann-Whitney test. **p < 0.01. (h) Representative H&E staining sections of shoulder joints from Sharpin-deficient mice crossed with Tnf- (n=4), Tnfr1- (n=2) or Il6-deficient (n=2) mice. Bars: 1mm.
Figure 5.
Figure 5.. Human LUBAC deficiencies cause defective germinal center formation
(a) Lymph node histology of a HOIP deficient patient. (b) Adenoid histology of a SHARPIN-deficient patient. (a-b) Ki67 staining positive areas on histology slides were measured as germinal centers (GC). Lymph nodes from two unrelated donors and adenoids from three unrelated donors were used as controls. Mean values ± s.d are displayed. (c) UMAP plot of CD3 population demonstrating reduction of germinal center B (GC-B) fraction (arrowhead) in SHARPIN-deficient P1 compared to unrelated control donors (N=10). (d) Dot plot analysis of CD19+ population with reduced CD19+ CD38int IgD GC-B cells in the patient. (e) Quantification of Fig. 6d. Mean values ± s.d are displayed. (f) UMAP plot of CD3+ population demonstrating reduction of follicular helper T cell fraction (arrowhead) in the SHARPIN deficient patient compared to unrelated control donors (N=10). (g) Reduction of GC-Tfh (CD4+ CD45RA CD25 CXCR5hi) cell population in the SHARPIN-deficient patient. (h-i) Reduced surface expression of ICOS (h) and PD1 (i) on GC-Tfh cells in the SHARPIN-deficient patient. (g-i) Mean values ± s.d are displayed. (a-i) The experiments were not repeated due to the limited clinical specimens.
Figure 6:
Figure 6:. Human LUBAC deficiencies cause dysregulation in B cell activation and death
(a) NF-κB induction assay. EBV-immortalized lymphoblast (EBV-B) cells from SHARPIN deficient P1 showed attenuated phosphorylation of IKKα/β, IκBα and JNK after CD40L stimulation. (b) mRNA expression of NF-κB target genes in EBV-B cells after CD40L stimulation. The experiment was performed in biological triplicates, and the expression levels were normalized to GAPDH. Mean values ± s.d are displayed. Significance calculated with two-tailed Student’s t-test. (c) mRNA expression of AICDA gene (encoding AID), normalized to GAPDH. CD19+ primary B cells were enriched by anti-CD19 magnetic beads and stimulated with CD40L for 24h. (d) Proliferation assay using primary B cells from LUBAC deficient patients. PBMCs were stained with CellTrace Violet, cultured with CD40L and IL21 for 96 h and analyzed by flow cytometer. (e) Cell death assay by SYTOX staining of primary B cells from LUBAC deficient patients. PBMCs were cultured with CD40L and IL-21 for 96 h. (c-e) The experiments were performed using biological quadruplicates from a SHARPIN- and a HOIP-deficient patient, and the results were compared with samples from three unrelated healthy donors. Mean values ± s.d are displayed. Significance calculated with one-way ANOVA followed by Tukey-Kramer test. (f-g) Cleaved caspase-3 immunohistochemistry staining of (f) adenoid from SHARPIN deficient patient and (g) axillary lymph node from a HOIP deficient patient, compared with tissues from control donors. The number of cleaved caspase-3 positive cells per follicle was quantified and normalized by follicle area size. Mean values ± s.d are displayed. (h-i) Somatic hypermutation (SHM) quantification in FACS-sorted memory B cells from peripheral blood. SHM in the entire V region (h) and the CDR3 region (i) of the t gene were normalized by the nucleotide length of each clonotype. Normalized SHM of top 100 IGHG clonotypes per each sample are demonstrated. Significance calculated with one-way ANOVA followed by Tukey-Kramer test. (a-e) These ex vivo data are representative of two independent experiments. (f-i) The experiments were not repeated due to the limited clinical specimens.
Figure 7:
Figure 7:. TNF inhibitors resolve the systemic inflammation of SHARPIN deficiency
(a-b) Clinical evaluation of (a) joint inflammation and (b) colonic inflammation to TNF blockade in P1. (b) The histology images are representative of three biopsy specimens. (c) P1’s response of inflammatory markers to TNF blocking therapies. (a-c) CRP: C-reactive protein; ESR: erythrocyte sedimentation rate; ETN: etanercept; ADA: adalimumab. (d) Growth recovery of P1 after TNF blockade. (e) Recovery of bone mineral density in P1 after TNF blockade. (f) Principal component analysis using RNA sequencing data of pre- and post-treatment whole blood RNA samples from P1. (g) A heatmap showing differentially expressed genes between healthy donors (N=4) and biological replicate samples from P1 pre-treatment (N=2) and post-treatment (N=4). (h-i) Gene enrichment analysis of 1404 genes upregulated in pre-treatment P1 using Ingenuity Pathway Analysis software. (h) Pathway analysis; (i) upstream molecule analysis. (j) A heatmap demonstrating the upregulation of representative inflammation-related genes in pre-treatment samples from P1 and the response to treatment with TNF inhibitors. (k) Response of serum IL-6 and TNF to TNF blockade therapies in P1. Cytokine measurements were performed in technical duplicates from pre- and post-treatment serum samples from SHARPIN-deficient P1, and the results were compared with a HOIP-deficient patient and eight healthy unrelated donors. Mean values ± s.d are displayed. A representative data of two independent experiments.

References

    1. Iwai K, Fujita H & Sasaki Y Linear ubiquitin chains: NF-kappaB signalling, cell death and beyond. Nat Rev Mol Cell Biol 15, 503–508 (2014). 10.1038/nrm3836 - DOI - PubMed
    1. Fuseya Y et al. The HOIL-1L ligase modulates immune signalling and cell death via monoubiquitination of LUBAC. Nat Cell Biol 22, 663–673 (2020). 10.1038/s41556-020-0517-9 - DOI - PubMed
    1. Kelsall IR, Zhang J, Knebel A, Arthur JSC & Cohen P The E3 ligase HOIL-1 catalyses ester bond formation between ubiquitin and components of the Myddosome in mammalian cells. Proc Natl Acad Sci U S A 116, 13293–13298 (2019). 10.1073/pnas.1905873116 - DOI - PMC - PubMed
    1. Boisson B et al. Human HOIP and LUBAC deficiency underlies autoinflammation, immunodeficiency, amylopectinosis, and lymphangiectasia. J Exp Med 212, 939–951 (2015). 10.1084/jem.20141130 - DOI - PMC - PubMed
    1. Boisson B et al. Immunodeficiency, autoinflammation and amylopectinosis in humans with inherited HOIL-1 and LUBAC deficiency. Nat Immunol 13, 1178–1186 (2012). 10.1038/ni.2457 - DOI - PMC - PubMed

METHOD-ONLY REFERENCES

    1. Matsumoto ML et al. Engineering and structural characterization of a linear polyubiquitin-specific antibody. J Mol Biol 418, 134–144 (2012). 10.1016/j.jmb.2011.12.053 - DOI - PubMed
    1. Zinngrebe J et al. Compound heterozygous variants in OTULIN are associated with fulminant atypical late-onset ORAS. EMBO Mol Med 14, e14901 (2022). 10.15252/emmm.202114901 - DOI - PMC - PubMed
    1. Samson AL et al. A toolbox for imaging RIPK1, RIPK3, and MLKL in mouse and human cells. Cell Death Differ 28, 2126–2144 (2021). 10.1038/s41418-021-00742-x - DOI - PMC - PubMed
    1. Wang K et al. Structural Mechanism for GSDMD Targeting by Autoprocessed Caspases in Pyroptosis. Cell 180, 941–955 e920 (2020). 10.1016/j.cell.2020.02.002 - DOI - PubMed

Publication types

MeSH terms

LinkOut - more resources