. 2024 May;25(5):886-901.
doi: 10.1038/s41590-024-01814-z. Epub 2024 Apr 12.

Blimp-1 and c-Maf regulate immune gene networks to protect against distinct pathways of pathobiont-induced colitis

Affiliations

Blimp-1 and c-Maf regulate immune gene networks to protect against distinct pathways of pathobiont-induced colitis

Marisol Alvarez-Martinez et al. Nat Immunol. 2024 May.

Abstract

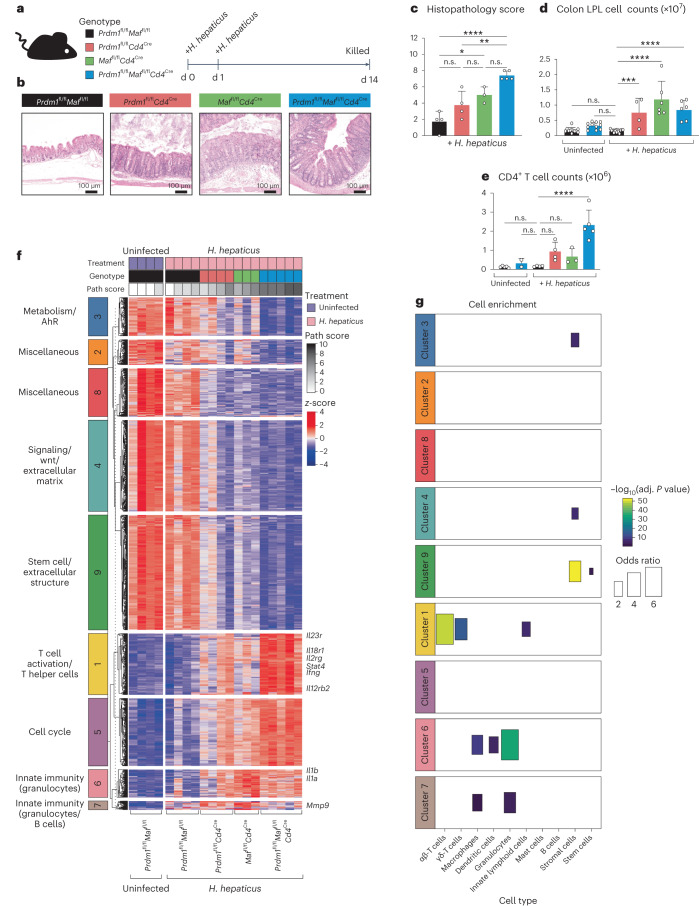
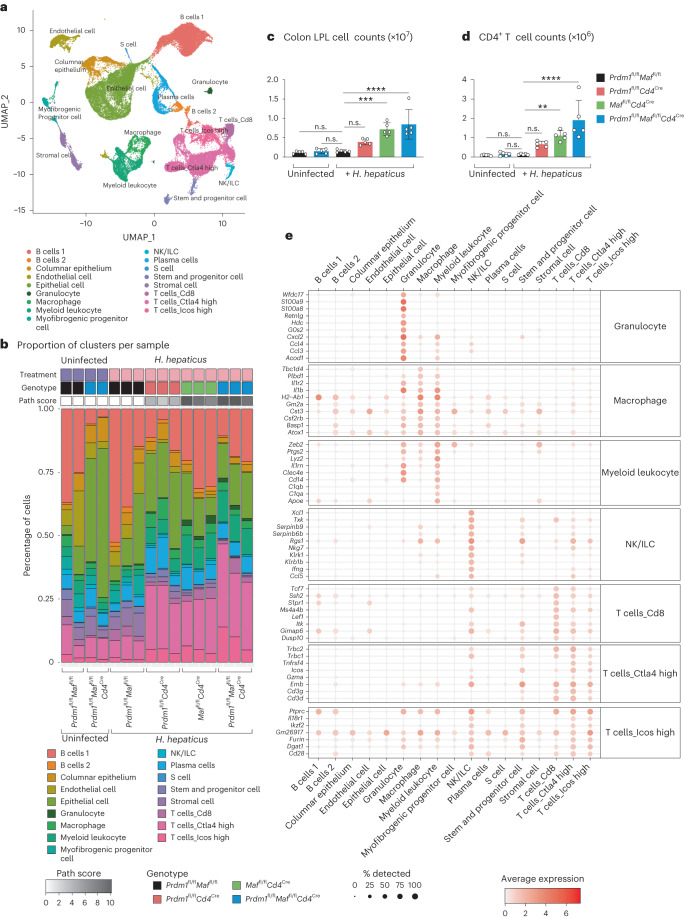
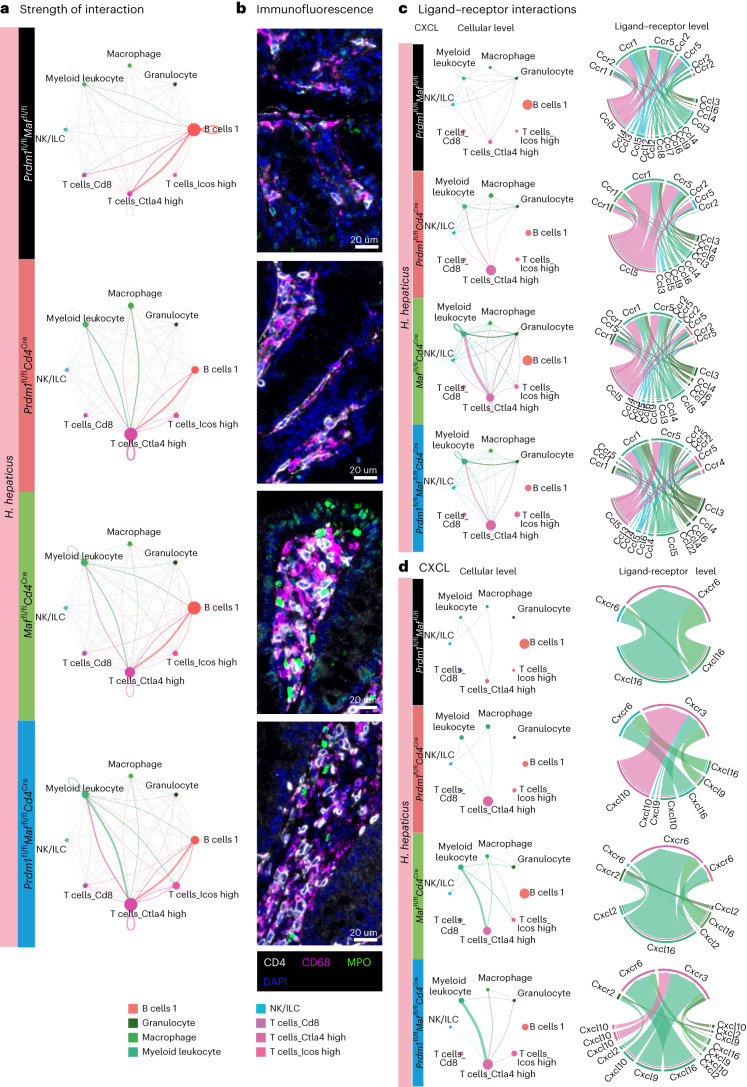
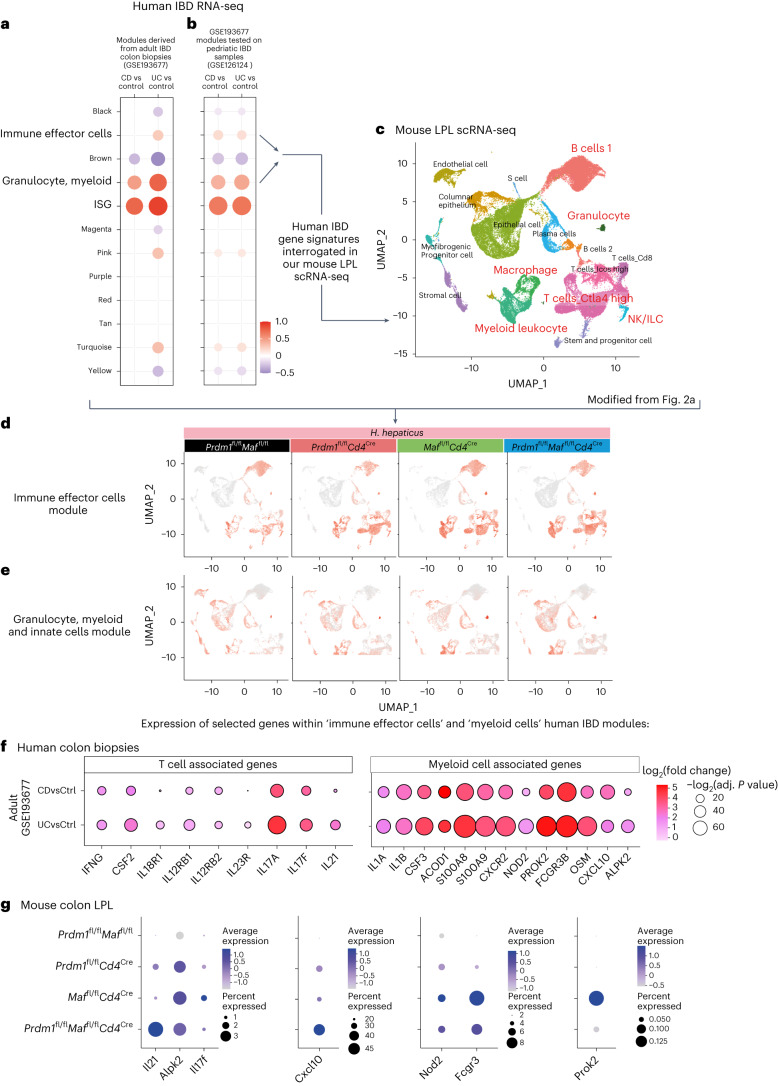
Intestinal immune responses to microbes are controlled by the cytokine IL-10 to avoid immune pathology. Here, we use single-cell RNA sequencing of colon lamina propria leukocytes (LPLs) along with RNA-seq and ATAC-seq of purified CD4+ T cells to show that the transcription factors Blimp-1 (encoded by Prdm1) and c-Maf co-dominantly regulate Il10 while negatively regulating proinflammatory cytokines in effector T cells. Double-deficient Prdm1fl/flMaffl/flCd4Cre mice infected with Helicobacter hepaticus developed severe colitis with an increase in TH1/NK/ILC1 effector genes in LPLs, while Prdm1fl/flCd4Cre and Maffl/flCd4Cre mice exhibited moderate pathology and a less-marked type 1 effector response. LPLs from infected Maffl/flCd4Cre mice had increased type 17 responses with increased Il17a and Il22 expression and an increase in granulocytes and myeloid cell numbers, resulting in increased T cell-myeloid-neutrophil interactions. Genes over-expressed in human inflammatory bowel disease showed differential expression in LPLs from infected mice in the absence of Prdm1 or Maf, revealing potential mechanisms of human disease.


Conflict of interest statement

F.P. received grant funding or consultancy fees from Roche, Genentech, GSK, Janssen, Novartis and T Cypher. The other authors declare no competing interests.

Figures

Fig. 1
Fig. 1. T cell-specific Blimp-1 and c-Maf control intestinal responses.
a, Schematic of experimental method used to infect mice with H. hepaticus by oral gavage. b–e, Representative H&E colon sections from each genotype following infection with H. hepaticus for 14 days (b) with the corresponding colon histopathology scores (detailed in Methods) (c), colon LPL cell counts for each H. hepaticus-infected group compared to uninfected controls (d) and total CD4+ T cell counts for each H. hepaticus-infected group compared to uninfected controls (e). Each dot within the bar plots represents an individual mouse analyzed. Graph shows means, error bars, s.d. Analyzed by one-way ANOVA followed by Dunnett post-hoc test (*P ≤ 0.05, **P ≤ 0.01, ***P ≤ 0.001, ****P ≤ 0.0001). Scale bar, 100 μm. Bulk tissue RNA-seq was performed on total colon LPLs isolated from uninfected Prdm1fl/flMaffl/fl control and H. hepaticus-infected Prdm1fl/flMaffl/fl mice as well as mice with Cd4Cre-mediated deletion of either Prdm1, Maf or both Prdm1 and Maf. f, Heatmap of expression values (represented as z-scores) of DEGss identified in H. hepaticus-infected mice compared to uninfected Prdm1fl/flMaffl/fl controls (fold change ≥1.5 and Benjamini–Hochberg (BH)-adjusted P < 0.05), partitioned into nine clusters using k-means clustering. Pathology scores associated with each mouse are shown at the top of the heatmap. g, Enrichment of cell-type signatures (taken from a previous publication) was assessed for each of the clusters in f using a Fisher’s exact test. Only statistically significant enriched signatures (BH-adjusted P < 0.05) were plotted for visualization. Data from n = 3–5 mice.
Fig. 2
Fig. 2. scRNA-seq reveals in-depth colonic gene regulation by Prdm1 and Maf.
scRNA-seq was performed on total colon LPL isolated from uninfected Prdm1fl/flMaffl/fl and Prdm1fl/flMaffl/flCd4Cre control mice, and H. hepaticus-infected Prdm1fl/flMaffl/fl mice as well as mice with Cd4Cre-mediated deletion of either Prdm1, Maf or both Prdm1 and Maf. a, Uniform manifold approximation and projection (UMAP) visualization of the integrated scRNA-seq from all conditions, colored by the identified/assigned cell cluster. b, Bar plots representing the proportion of cells in each of the cell clusters per biological replicate within each experimental condition and corresponding histopathological scores (detailed in Methods). c, Colon LPL cell counts for each H. hepaticus-infected group compared to uninfected controls. d, Total CD4+ T cell counts for each group in the experiment for each H. hepaticus-infected group compared to uninfected controls. Each dot within the bar plots represents an individual mouse analyzed. Graph shows means; error bars, s.d. Analyzed by one-way ANOVA followed by Dunnett post-hoc test (*P ≤ 0.05; **P ≤ 0.01; ***P ≤ 0.001; ****P ≤ 0.0001). Data from n = 5 mice. e, Dot plot of the top ten differentially expressed marker genes of relevant cell clusters from a, colored by the average gene expression across all cell clusters. The dot size represents the percentage of cells per cell cluster expressing the gene in question.
Fig. 3
Fig. 3. Prdm1 and Maf induce Il10 and control T effector cytokines.
a,b, RNA-seq gene expression of Il10 (a) and Ifng, Il17a, Il22 and Csf2 (b) in sorted CD4+ T cells from colon LPLs isolated from uninfected Prdm1fl/flMaffl/fl mice and H. hepaticus-infected Prdm1fl/flMaffl/fl mice as well as mice with Cd4Cre-mediated deletion of either Prdm1, Maf or both Prdm1 and Maf. c, Gene expression of Ifng, Il17a and Il22 in bulk tissue total colon LPLs isolated from uninfected and H. hepaticus-infected mice. In ac, DEGs in each condition against uninfected Prdm1fl/flMaffl/fl mice were marked for statistical significance as follows, *BH-adjusted P ≤ 0.05; **BH-adjusted P ≤ 0.01; ***BH-adjusted P ≤ 0.001; ****BH-adjusted P ≤ 0.0001. d, Dot plot of scRNA-seq gene expression of selected genes Ifng, Il17a, Il22, Il18r1, Il12rb2, Il12rb1, Il23r, Cxcr3 and Csf2 in colon LPLs from H. hepaticus-infected Prdm1fl/flMaffl/fl or mice with Cd4Cre-mediated deletion of either Prdm1, Maf or both Prdm1 and Maf. The dot size represents the percentage of cells per cell cluster expressing the gene in question and the expression level indicated by the color scale. e, Expression of Foxp3 as assessed by scRNA-seq within the UMAP visualization of annotated scRNA-seq datasets within each of H. hepaticus-infected genotypes. fj, Expression at the single-cell level of Il10 (f), Ifng (g), Csf2 (h), Il17a (i) and Il22 (j) in the 'Ctla4 high' cells expressing Foxp3 (Foxp3+) or not (Foxp3). The distribution of expression in cells within each condition is shown by the violin plots; the dot plot (top panels) displays the proportion of cells expressing the gene in question, with the expression level indicated by the color scale.
Fig. 4
Fig. 4. Multi-omic integration identifies binding sites for Blimp-1 and c-Maf.
a, ATAC-seq was performed on sorted CD4+ T cells from colon LPLs isolated from uninfected Prdm1fl/flMaffl/fl control and H. hepaticus-infected Prdm1fl/flMaffl/fl mice as well as mice with Cd4Cre-mediated deletion of either Prdm1, Maf or both Prdm1 and Maf. Genome browser tracks of ATAC-seq data from each condition together with publicly available c-Maf (green) and Blimp-1 (red) ChIP-seq datasets in the Il10, Ifng, Il17a, Il22 and Csf2 loci. Statistically significant ChIP-seq peaks (q < 0.05) are represented by a green or red bar underneath the normalized read coverage tracks for c-Maf and Blimp-1, respectively. b,c, IPA was used to overlay sorted CD4+ T cells RNA-seq onto the TH1 (b) and TH17 (c) pathways. Gene expression fold changes in each H. hepaticus-infected condition relative to the uninfected Prdm1fl/flMaffl/fl control were overlayed onto the TH1 and TH17 pathways. A fixed scale of −5 (blue) to 3.5 (red) was kept between all conditions, and Prdm1 was colored black in the Prdm1-deficient T cells.
Fig. 5
Fig. 5. Increased myeloid gene expression in the absence of Maf in T cells.
ad, Violin plots summarizing the expression values (quantified as z-scores) and boxplots of example genes of innate immunity-associated genes found in cluster 6 (a,b) and neutrophil activation associated genes found in cluster 7 (c,d) of the bulk tissue LPL RNA-seq data analysis from Fig. 1f. DEGs in each condition against uninfected Prdm1fl/flMaffl/fl mice were marked as follows (all P values BH-adjusted): *P ≤ 0.05; **P ≤ 0.01; ***P ≤ 0.001; ****P ≤ 0.0001. e, Expression of selected innate immunity and granulocyte-associated genes queried in the granulocyte, macrophage and myeloid leukocyte cell clusters across all H. hepaticus-infected conditions within the colon LPL scRNA-seq dataset. f, Representative flow plots and gating strategy used for the flow cytometry analysis of neutrophils (Live CD90.2TCR-βCD19 CD11+Ly6G+) across uninfected Prdm1fl/flMaffl/fl and Prdm1fl/flMaffl/flCd4Cre, and H. hepaticus-infected Prdm1fl/flMaffl/fl mice as well as mice with Cd4Cre-mediated deletion of either Prdm1, Maf or both Prdm1 and Maf. g, Bar plots of percentage from live (top panels) and absolute cell counts (bottom panels) of neutrophils and Ly6GCD11b+ cells from lamina propria of the colon. Each dot within the bar plots represents an individual mouse analyzed. Graph shows means, error bars, s.d. Analyzed by one-way ANOVA followed by Dunnett post-hoc test (*P ≤ 0.05; **P ≤ 0.01; ***P ≤ 0.001; ****P ≤ 0.0001). Data from n = 4–5 mice. h, Dot plot of scRNA-seq gene expression of selected genes Il1b, Ncf2, Acod1, Csf2ra, Csf2rb, Csf3r, Il1a, Osm, S100a8, S100a9, Csf3 and Cxcr2, in the colon LPLs from H. hepaticus-infected control Prdm1fl/flMaffl/fl mice and mice with Cd4Cre-mediated deletion of either Prdm1, Maf or both Prdm1 and Maf. The dot size represents the percentage of cells per cell cluster expressing the gene in question, and the expression level is indicated by the color scale.
Fig. 6
Fig. 6. Increased interaction between T cells, macrophages and neutrophils.
Cell-to-cell communication networks inferred using CellChat software from gene expression of ligands and their receptors in immune cell clusters of interest from the colonic LPL scRNA-seq dataset. a, Strength of interaction of cell-to-cell interactions, represented in the edge width, in H. hepaticus-infected Prdm1fl/flMaffl/fl mice and mice with Cd4Cre-mediated deletion of either Prdm1, Maf or both Prdm1 and Maf. b, Representative images (n = 4–5) of colon sections by immunofluorescence, staining for CD4+ T cells (CD4, white), mononuclear phagocytes (CD68, magenta), neutrophils (MPO, green) and nuclear staining (DAPI, blue) from H. hepaticus-infected Prdm1fl/flMaffl/fl mice and mice with Cd4Cre-mediated deletion of either Prdm1, Maf or both Prdm1 and Maf. Scale bar, 20 μm. c,d, Cell-to-cell communication networks underlying CCL (c) and CXCL (d) pathways across all H. hepaticus-infected Prdm1fl/flMaffl/fl mice and mice with Cd4Cre-mediated deletion of either Prdm1, Maf or both Prdm1 and Maf. The chord plot has receiver cells at the top (incoming signaling) and transmitter cells (outgoing signaling) at the bottom. The edges are colored based on the cell clusters expressing the outgoing signals. In a,c and d, node size is proportional to the number of cells in each experimental group, and the edges are colored based on the cell clusters expressing the outgoing signals.
Fig. 7
Fig. 7. IBD patient gene signatures are regulated by Prdm1 and Maf.
a, Modules of co-expressed genes were derived from human adult IBD colonic biopsies (GSE193677) using the R package WGCNA and b, tested in an independent human pediatric IBD dataset (GSE126124). CD, Crohn’s disease; UC, ulcerative colitis. In the dot plots, the color and size of the dots represent the fold enrichment in disease compared to controls. Re-named modules indicate biological processes associated with the genes within a module. Fold-enrichment scores were derived using QuSAGE software; red and blue colors indicated over-abundance and under-abundance, respectively, of genes within a module (compared to control samples). Size of the dots represents the relative degree of perturbation (larger dots represent a higher degree of perturbation), and only modules with an adjusted P < 0.05 were considered significant and depicted in the plot. c, Enrichment of genes within the 'immune effector cells' and the 'granulocyte, myeloid and innate cells' modules were then tested in our mouse colon LPL scRNA-seq dataset. d,e, Scoring of the 'immune effector cells' (d) and 'granulocyte, myeloid and innate cells' modules (e) were projected into our scRNA-seq UMAP. f, Dot plot of over-expressed T cell-associated or myeloid cell-associated genes from human IBD colon biopsies found within the modules from a and b versus controls. The dot size represents the P value and the log2(fold change) is indicated by the color scale. g, Dot plot of gene expression of selected genes found to be over-expressed in human IBD as in f, in colon LPL scRNA-seq from H. hepaticus-infected control Prdm1fl/flMaffl/fl mice and mice with Cd4Cre-mediated deletion of either Prdm1, Maf or both Prdm1 and Maf. The dot size represents the percentage of cells per cell cluster expressing the gene in question and the expression level indicated by the color scale.
Extended Data Fig. 1
Extended Data Fig. 1. Changes in gene expression regulated by Blimp-1 and c-Maf.
a) Representative H&E colon sections from steady state mice aged to 24-30 weeks, scale bar = 100μm. Data representative of multiple female and male mice: Prdm1fl/fl (n = 8), Prdm1fl/flCd4Cre (n = 19), Maffl/fl (n = 10), Maffl/flCd4Cre (n = 22), Prdm1fl/flMaffl/fl (n = 36), Prdm1fl/flMaffl/flCd4Cre (n = 38) b) Schematic of experimental method used to infect mice with H. hepaticus by oral gavage and treatment with anti-IL-10R blocking antibody. Representative H&E colon sections (scale bar = 100μm) from each genotype following infection with H. hepaticus and treatment with anti-IL-10R antibody and harvested on Day 14 with the corresponding colon histopathology scores (bottom panels). Each dot within the barplots represents an individual mouse analyzed. Graph shows mean ±s.d., analyzed by one-way ANOVA followed by Tukey’s post-hoc test (*=p value ≤ 0.05, **=p value ≤ 0.01, ***=p value ≤ 0.001, ****=p value ≤ 0.0001). c) Unsupervised hierarchical clustering of a pair-wise Spearman correlation and d) PCA plots showing on PC1 the separation of floxed control mice (uninfected and infected) versus H. hepaticus-infected mice with Cd4Cre-mediated deletion of Prdm1, Maf, or Prdm1 and Maf. e) Enriched IPA canonical pathways (left) and gene ontology biological processes (right) were obtained for the clusters of differentially expressed genes arising upon infection and Cd4Cre-mediated deletion of either Prdm1, Maf, or both Prdm1 and Maf (related to Fig. 1f). Data from n = 35 mice.
Extended Data Fig. 2
Extended Data Fig. 2. Details of colon scRNA-seq changes by Prdm1 and Maf, or both.
a-c) scRNA-seq was performed on total colon LPL isolated from uninfected Prdm1fl/flMaffl/fl and Prdm1fl/flMaffl/flCd4Cre control mice, and H. hepaticus infected Prdm1fl/flMaffl/fl mice and mice with Cd4Cre-mediated deletion of either Prdm1, Maf, or both Prdm1 and Maf. a) UMAP visualization of the integrated scRNA-seq dataset, plotted per condition and colored by assigned cell cluster. b) Total cell number and c) proportion of cells (%) successfully sequenced and passing quality control (Methods section) in each of the cell clusters identified. Data from n = 2-3 mice.
Extended Data Fig. 3
Extended Data Fig. 3. Top genes in colon scRNAseq clusters in infected mice.
a) Heatmap and b) dotplot (of cell clusters not in Fig. 2e) of the top 10 differentially expressed marker genes of the identified cell clusters in our colon LPL scRNA-seq. Colored by the average gene expression across all cell clusters. In the dotplots, the dot size represents the percentage of cells per cell cluster expressing the gene in question.
Extended Data Fig. 4
Extended Data Fig. 4. Flow cytometry and RNAseq analysis of colon in infected mice.
a) Gating strategy for flow cytometry analysis of colon LPLs. b–d) Percentages from live cells of b) total lymphocytes and c-d) total CD4 + T cells (Live CD90.2 + TCR-β + CD4 + CD8-)) producing IFN-γ, GM-CSF, IL-17A and IL-10. Flow plots of CD4 + T-cells for IFN-γ production versus e) IL-10, f) GM-CSF and g) IL-17A. h) Gating of total CD4 + GM-CSF+ lymphocytes with corresponding flow plots of IFN-γ versus IL-17A. i) Gating of total GM-CSF+ lymphocytes with corresponding flow plots of IFN-γ versus IL-17A with bar plots of j) percentages (from live population) of lymphocytes producing GM-CSF alongside IL-17A, IFN-γ, or both. All flow analyses were performed on from H. hepaticus infected mice. k) Gene expression of Il12rb2, Il12rb1, Il23r, Stat4, Il18r1, Cxcr3 and Csf2 in bulk tissue total colon LPL isolated from uninfected and H. hepaticus infected mice. Differentially expressed genes in each condition against uninfected Prdm1fl/flMaffl/fl mice were marked as follows: *=BH adjusted p value ≤ 0.05, **= BH adjusted p value ≤ 0.01, ***= BH adjusted p value ≤ 0.001, ****= BH adjusted p value ≤ 0.0001.
Extended Data Fig. 5
Extended Data Fig. 5. c-Maf regulates colon RORγt+Foxp3+ cells during infection.
a) Boxplots of log2(normalized read counts) of Rorc and Foxp3 in bulk tissue LPL RNA-seq. b) Flow cytometry analysis of RORγt and Foxp3 transcription factor expression with c) percentages (top) and numbers (bottom) of CD4 + T cells producing of RORγt and/or Foxp3. d) Boxplots of log2(normalized read counts) of Rorc and Foxp3 in sorted CD4 + T cells from colon LPL isolated from uninfected and H. hepaticus infected mice. Differentially expressed genes in each condition against uninfected Prdm1fl/flMaffl/fl mice were marked as follows: *=BH adjusted p value ≤ 0.05, **= BH adjusted p value ≤ 0.01, ***= BH adjusted p value ≤ 0.001, ****= BH adjusted p value ≤ 0.0001.
Extended Data Fig. 6
Extended Data Fig. 6. Changes in T-cell gene expression and chromatin accessibility.
a) Unsupervised hierarchical clustering of a pair-wise Spearman correlation of RNA-seq on sorted CD4 + T cells from colon LPL isolated from uninfected Prdm1fl/flMaffl/fl and Prdm1fl/flMaffl/flCd4Cre, and H. hepaticus infected Prdm1fl/flMaffl/fl mice and mice with Cd4Cre-mediated deletion of either Prdm1, Maf, or both Prdm1 and Maf. b) Number of differentially expressed genes identified in H. hepaticus infected mice compared to uninfected Prdm1fl/flMaffl/fl controls (fold change >=1.5 and BH adjusted p value < 0.05). c) Euler diagram of distinct and overlapping differentially expressed genes between transcription factor-deficient T cells from H. hepaticus infected mice. d) Unsupervised hierarchical clustering of a pair-wise Spearman correlation of ATAC-seq on sorted CD4 + T cells from colon LPL isolated from uninfected Prdm1fl/flMaffl/fl and Prdm1fl/flMaffl/flCd4Cre, and H. hepaticus infected Prdm1fl/flMaffl/fl mice and mice with Cd4Cre-mediated deletion of either Prdm1, Maf, or both Prdm1 and Maf. e) Number of differentially accessible sites identified in H. hepaticus infected mice compared to uninfected Prdm1fl/flMaffl/fl controls (fold change >=1.5 and BH adjusted p value < 0.05). f) Euler diagram of distinct and overlapping differentially accessible sites between transcription factor-deficient T cells from H. hepaticus infected mice. g) Heatmap of accessibility values (represented as z-scores) of accessible sites identified in CD4 + T cells from H. hepaticus infected mice compared to uninfected Prdm1fl/flMaffl/fl controls (fold change >=1.5 and BH adjusted p value < 0.05), partitioned into 7 clusters using k-means clustering. Pathology scores associated to each mouse are shown at the top of the heatmap.
Extended Data Fig. 7
Extended Data Fig. 7. Inference of cell-to-cell communication networks in scRNA-seq.
Cell-to-cell communication networks inferred using CellChat software from gene expression of ligands and their receptors in immune, stromal, epithelial and endothelial cell clusters from the colonic LPL scRNA-seq dataset. a) number and b) strength of interaction of cell-to-cell interactions, represented in the edge width, in and H. hepaticus infected Prdm1fl/flMaffl/fl mice and mice with Cd4Cre-mediated deletion of either Prdm1, Maf, or both Prdm1 and Maf. c) Plot of “Outgoing interaction strength“ against “Incoming interaction strength” across all H. hepaticus infected conditions. In a-b) node size is proportional to the number of cells in each experimental group, and the edges are colored based on the cell clusters expressing the outgoing signals.
Extended Data Fig. 8
Extended Data Fig. 8. Prdm1 and Maf control T cell-IFN-γ and M-CSF pathways.
Cell-to-cell communication networks inferred using CellChat software from gene expression of ligands and their receptors in immune cell clusters of interest from the colonic LPL scRNA-seq dataset. a) Number of interactions of cell-to-cell interactions, represented in the edge width, in and H. hepaticus infected Prdm1fl/flMaffl/fl mice and mice with Cd4Cre-mediated deletion of either Prdm1, Maf, or both Prdm1 and Maf. b) Plot of “Outgoing interaction strength“ against “Incoming interaction strength” across all H. hepaticus infected conditions. c-d) Cell-to-cell communication networks underlying the c) Type II IFN (IFN-γ) and d) M-CSF pathways across all H. hepaticus infected Prdm1fl/flMaffl/fl mice and mice with Cd4Cre-mediated deletion of either Prdm1, Maf, or both Prdm1 and Maf. The chord plot has receiver cells at the top (incoming signaling) and transmitter cells (outgoing signaling) the bottom. The edges are colored based on the cell clusters expressing the outgoing signals. In a,c-d) node size is proportional to the number of cells in each experimental group, and the edges are colored based on the cell clusters expressing the outgoing signals.
Extended Data Fig. 9
Extended Data Fig. 9. Co-localization of colon neutrophils and CD4+ cells.
a) Representative images (n = 4-5) of colon sections by immunofluorescence, staining for CD4 + T cells (CD4, white), mononuclear phagocytes (CD68, magenta), neutrophils (MPO, green) and nuclear staining (DAPI, blue) from uninfected Prdm1fl/flMaffl/fl and Prdm1fl/flMaffl/flCd4Cre, and H. hepaticus infected Prdm1fl/flMaffl/fl mice and mice with Cd4Cre-mediated deletion of either Prdm1, Maf, or both Prdm1 and Maf. Yellow arrows with an “M” point to acellular (no DAPI staining) non-specific mucus staining. Top row shows merged channels with a scale bar = 100μm; in the second row DAPI and MPO channels are shown with a scale bar = 40μm; in the third row DAPI and CD4 channels are shown with a scale bar = 40μm; and in the bottom row DAPI and CD68 channels are shown with a scale bar = 40μm. b) Bar graphs showing the median number of CD4 + , CD68+ and MPO+ cells per area (μm2) in gut sections of each H. hepaticus infected Prdm1fl/flMaffl/fl mice and mice with Cd4Cre-mediated deletion of either Prdm1, Maf, or both Prdm1 and Maf. Data from n = 4-5 mice.

References

    1. Fang D, Zhu J. Molecular switches for regulating the differentiation of inflammatory and IL-10-producing anti-inflammatory T-helper cells. Cell. Mol. Life Sci. 2019;77:289–303. doi: 10.1007/s00018-019-03277-0. - DOI - PMC - PubMed
    1. Izcue A, Coombes JL, Powrie F. Regulatory lymphocytes and intestinal inflammation. Annu Rev. Immunol. 2009;27:313–338. doi: 10.1146/annurev.immunol.021908.132657. - DOI - PubMed
    1. Neumann C, Scheffold A, Rutz S. Functions and regulation of T cell-derived interleukin-10. Semin. Immunol. 2019;44:101344. doi: 10.1016/j.smim.2019.101344. - DOI - PubMed
    1. Ouyang W, O’Garra A. IL-10 family cytokines IL-10 and IL-22: from basic xcience to clinical translation. Immunity. 2019;50:871–891. doi: 10.1016/j.immuni.2019.03.020. - DOI - PubMed
    1. Saraiva M, Vieira P, O’Garra A. Biology and therapeutic potential of interleukin-10. J. Exp. Med. 2020;217:e20190418. doi: 10.1084/jem.20190418. - DOI - PMC - PubMed

Publication types

MeSH terms

Substances