. 2024 Jul;31(7):1124-1133.
doi: 10.1038/s41594-024-01264-z. Epub 2024 Apr 12.

Structure of the γ-tubulin ring complex-capped microtubule

Affiliations

Structure of the γ-tubulin ring complex-capped microtubule

Amol Aher et al. Nat Struct Mol Biol. 2024 Jul.

Abstract

Microtubules are composed of α-tubulin and β-tubulin dimers positioned head-to-tail to form protofilaments that associate laterally in varying numbers. It is not known how cellular microtubules assemble with the canonical 13-protofilament architecture, resulting in micrometer-scale α/β-tubulin tracks for intracellular transport that align with, rather than spiral along, the long axis of the filament. We report that the human ~2.3 MDa γ-tubulin ring complex (γ-TuRC), an essential regulator of microtubule formation that contains 14 γ-tubulins, selectively nucleates 13-protofilament microtubules. Cryogenic electron microscopy reconstructions of γ-TuRC-capped microtubule minus ends reveal the extensive intra-domain and inter-domain motions of γ-TuRC subunits that accommodate luminal bridge components and establish lateral and longitudinal interactions between γ-tubulins and α-tubulins. Our structures suggest that γ-TuRC, an inefficient nucleation template owing to its splayed conformation, can transform into a compacted cap at the microtubule minus end and set the lattice architecture of cellular microtubules.


Conflict of interest statement

Competing Interests

T.M.K is a co-founder of and has an ownership interest on RADD Pharmaceuticals, Inc.

Competing interests: Authors declare that they have no competing interests.

Figures

Extended Data Fig.1
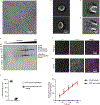
Extended Data Fig.1. TIRF-based optimization of γ-TuRC-dependent microtubule nucleation assay with slow GTP hydrolysing mutant of ɑ-tubulin, E254D.
(a) Transmission EM micrograph of negatively stained native γ-TuRC (representative image from 441 micrographs). (b) 2D class-averages showing two orientations of native γ-TuRC particles, top view (upper panel, 1182 particles) and side-view (bottom panel, 1048 particles). (c-d) 2D class average for native γ-TuRC-capped minus-ends (177 particles) (b) and for uncapped ends from spontaneously nucleated microtubules (183 particles) (c). (e) SDS-PAGE analysis (Coomassie stained) of recombinant γ-TuRC-GFP following sucrose density gradient centrifugation. (f,g) Images from a TIRF-microscopy sequence showing the γ-TuRC (green), tubulin (magenta) and merge channels after 2 minutes 30 s in the presence of chTOG (100 nM) and either wild type tubulin (10 μM) (d) or E254D (TUBA1B-E254D, TUBB3) tubulin (10 μM) (e). (h) Plot of the percentage (mean ± s.d) of microtubules associated or not associated with a γ-TuRC-GFP puncta at 50 s post start of nucleation in the presence of E254D tubulin (10 μM) and chTOG (100 nM), total 95 microtubules, n=3 independent experiments. (i) Plot of the cumulative number of microtubules (mean ± s.d) nucleated by γ-TuRC in the presence of chTOG (100 nM) and either wild type tubulin or E254D tubulin (10 μM) over time, is shown. Data were fitted using linear regression, E254D tubulin (red line, total 193 microtubules) and wild type tubulin (blue line). n=4 independent experiments for each.
Extended Data Fig.2
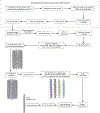
Extended Data Fig.2. Cryo-EM data processing workflow for γ-TuRC-capped microtubule minus-end and free γ-TuRC.
A multi-step workflow is schematized.
Extended Data Fig.3
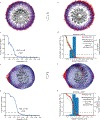
Extended Data Fig.3. Estimates of resolution and projection angle distribution for overall γ-TuRC-capped microtubule end and symmetry expanded ɑ-ɑ and γ-γ-tubulin map.
(a-d) Two views showing the Euler angle distribution (a,b), gold-standard Fourier shell correlation (FSC) curve (c) and directional FSC as estimated using the 3DFSC server (d) for the overall γ-TuRC-capped microtubule end density map presented in Figures 1 and 2. (e-h) Two views showing the Euler angle distribution (e,f), gold-standard Fourier shell correlation (FSC) curve (g) and directional FSC as estimated using the 3DFSC server (h) for the symmetry expanded ɑ-ɑ and γ-γ-tubulin density map presented in Figure 4.
Extended Data Fig.4
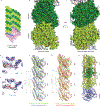
Extended Data Fig.4. Cryo-EM reconstruction of γ-TuRC-nucleated microtubule protofilament reveals a compacted lattice.
(a) Schematic for γ-TuRC-nucleated microtubule used for cryo-EM reconstruction (b, c) Cryo-EM density map for γ-TuRC-nucleated microtubule protofilament showing a view of the ɑ/β-tubulin dimer from the outside (b) and from within the lumen (c) (ɑ-tubulin: lighter green; β-tubulin: darker green). (d-e) Densities (mesh) for the nucleotide bound to ɑ-tubulin (GTP) (d) and β-tubulin (GDP) (e). (f-g) Models for 2 tubulin heterodimers along a protofilament for the γ-TuRC-nucleated microtubule and the GDP-microtubule (PDB ID:6DPV) (f) or the GMPCPP-microtubule (PDB ID:6DPU) (g). Distances between 2 successive ɑ-tubulins were measured and averaged. (h) Four tubulin models rigid-body fitted into γ-TuRC-nucleated microtubule map at position 7 were used to measure distances between 2 successive ɑ-tubulins.
Extended Data Fig.5
Extended Data Fig.5. Cryo-EM data processing workflow for γ-TuRC-nucleated microtubule protofilament.
A multi-step workflow is schematized.
Extended Data Fig.6
Extended Data Fig.6. Estimates of resolution and projection angle distribution for γ-TuRC-nucleated microtubule protofilament.
(a-c) Gold-standard Fourier shell correlation (FSC) curve (a), directional FSC as estimated by the 3DFSC server (b) and euler angle distribution (c) for the γ-TuRC-nucleated microtubule protofilament density map presented in Extended Fig. 4.
Extended Data Fig.7
Extended Data Fig.7. Estimates of resolution and projection angle distribution for the refined γ-TuRC-capped microtubule end and free recombinant γ-TuRC density maps.
(a-d) Two views showing the Euler angle distribution (a,b), gold-standard Fourier shell correlation (FSC) curve (c) and directional FSC as estimated by the 3DFSC server (d) for the refined γ-TuRC-capped microtubule end density map presented in Figure 3. (e-h) Two views showing the Euler angle distribution (e,f), gold-standard Fourier shell correlation (FSC) curve (g) and directional FSC as estimated using the 3DFSC server (h) for the free recombinant γ-TuRC density map.
Extended Data Fig.8
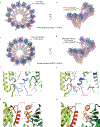
Extended Data Fig.8. Comparison of γ-TuRC in its free and microtubule bound form and and lateral ɑ-ɑ and β-β tubulin interaction interface.
(a,b) Comparison of the rigid-body fitted models of native γ-TuRC (gray) and recombinant γ-TuRC (colored) showing top (a) and side views (b). (c,d) Comparison of the rigid-body fitted models of recombinant γ-TuRC (gray) and microtubule bound recombinant γ-TuRC (colored) showing top (c) and side views (d). (e-h) Lateral interactions involving the M-loop at ɑ-tubulin-ɑ-tubulin and β-tubulin-β-tubulin interface (ribbons) respectively (e,f) and the H3,H9 and H10 helices (g,h).
Fig. 1.
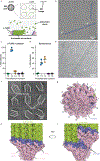
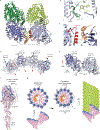
Fig. 1.. Cryo-EM of γ-TuRC-capped microtubules reveals selective nucleation of 13-protofilament microtubules.
(a) Schematic of the on-grid nucleation assay for cryo-EM-based analysis. Microtubules and γ-TuRCs in the holes are indicated and EM image is expanded below. (b) Micrograph showing two microtubules nucleated in the presence of native human γ-TuRC. Cone-shaped densities at microtubule ends, consistent with γ-TuRC caps, are indicated (white arrow). Segment assignments by 3D classification indicate protofilament number (blue circles: 13). (c, d) Percent microtubules with different protofilament numbers nucleated in the presence (c) (total 126 microtubules) or absence (d) (total 237 microtubules) of native γ-TuRC, mean ± SD is shown, n=3 independent experiments. (e) Micrograph showing microtubules with capped ends (arrows) and free recombinant γ-TuRC (circle). (f) 2D class averages of capped microtubule ends reveal repeating globular and spoke-like densities. (g-i) Surface representation of the overall density for γ-TuRC-capped microtubule end in different views (colored as indicated).
Fig. 2.
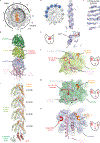
Fig. 2.. Longitudinal interactions along a protofilament and a GCP-spoke of γ-TuRC-capped microtubule minus-end.
(a) Cross-sectional view showing “luminal-bridge” density (orange). Stable (solid line) and dynamic (dashed line) regions along with γ-tubulin positions are indicated. (b, c) Examples of γ-tubulin density (mesh) from the stable region, along with a schematic of γ-TuRC indicating the most stable positions in blue. Rigid body fitted model (sticks) for H12 helix (b) and GTPase domain β-sheets (c). (d) An ɑ/β-tubulin dimer bound to γ-tubulin, positioned above a GCP (backbone: ribbons, nucleotide: spheres). (e) Schematic for the tubulin-tubulin interaction interface. Nucleotide binding regions indicated in (d) shown as an overlay of cryo-EM density (mesh) with guanine nucleotide coordinates (stick representation) found at γ/ɑ-tubulin interface. (f-h) Structural regions of γ-tubulin, ɑ-tubulin and GCP (cartoon and spheres) interacting with ɑ-tubulin, β-tubulin and γ-tubulin (surface), respectively. (i) Overlaying protofilament density at position 7 (transparent gray surface) with rigid-body fitted model reveals structural alignment extending from GCP, through γ-tubulin, to ɑ/β-tubulin dimer.
Fig. 3.
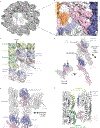
Fig. 3.. Structural rearrangements of tubulins and GCPs at the seam.
(a) Surface representation of overall reconstruction (lowpass-filtered to 9Å) for γ-TuRC-capped microtubule end using a subset of particles with stronger densities at the dynamic region. (b) Zoomed-in view of the dynamic region (viewed from the luminal side, colored as indicated). (c) Rigid-body fit of ɑ,β- and γ-tubulins and GCP domains into the density (lowpass-filtered to 9Å, transparent gray surface) at the dynamic region. (d-e) Side- and front views of the seam showing γ-TuRC-capped microtubule models (ribbons) and free γ-TuRC model (transparent gray surface). Free γ-TuRC position 14 is indicated in the cartoon (arrow). (f) Inset from (e) highlighting the interacting structural motifs at the seam for the α-tubulin-γ-tubulin interface and the GCP-β-tubulin interface.
Fig. 4.
Fig. 4.. Lateral interactions established upon the compaction of γ-TuRC to cap the microtubule minus-end.
(a) Lateral interactions between ɑ-ɑ- and γ-γ-tubulins (ribbons), with two key interaction motifs between adjacent γ-tubulins highlighted (shades of green and red). (b,c) Inset from (a) shows these two structural motifs in detail. (d) Overlay of γ-tubulin in the free (ribbons: gray) and microtubule-bound (ribbons: shades of blue) γ-TuRC. Arrows highlight rotation and displacements of the γ-tubulin’s. The H3 helix (light red: free; dark red: microtubule-bound) is indicated. (e) Vertical displacements of the γ-tubulins in the microtubule-bound complex (shades of blue) relative to the free complex (gray). The H10 helix in γ-tubulin is indicated. (f) The rigid-body motion between the free (gray) and microtubule-bound (colored) states of γ-tubulin–GRIP2-domain of GCP, which together form a rigid “claw”, is indicated. (g) Schematic for how γ-TuRC, an inefficient nucleator (splayed complex) transforms into a stable microtubule minus-end cap (compact complex), GCP spokes are colored in pink, γ-tubulins in purple, the luminal-bridge components in orange and ɑ/β-tubulins in green.

Update of

References

    1. Kirschner M & Mitchison T Beyond self-assembly: from microtubules to morphogenesis. Cell 45, 329–342 (1986). - PubMed
    1. Brouhard GJ & Rice LM Microtubule dynamics: an interplay of biochemistry and mechanics. Nat. Rev. Mol. Cell Biol. 19, 451–463 (2018). - PMC - PubMed
    1. Akhmanova A & Steinmetz MO Control of microtubule organization and dynamics: two ends in the limelight. Nat. Rev. Mol. Cell Biol. 16, 711–726 (2015). - PubMed
    1. Tilney LG et al. Microtubules: evidence for 13 protofilaments. J. Cell Biol. 59, 267–275 (1973). - PMC - PubMed
    1. Böhm KJ, Vater W, Fenske H & Unger E Effect of microtubule-associated proteins on the protofilament number of microtubules assembled in vitro. Biochim. Biophys. Acta 800, 119–126 (1984). - PubMed

MeSH terms

LinkOut - more resources