. 2024 Apr 12;15(1):117.
doi: 10.1007/s12672-024-00970-w.

Identification of hub genes and diagnostic efficacy for triple-negative breast cancer through WGCNA and Mendelian randomization

Affiliations

Identification of hub genes and diagnostic efficacy for triple-negative breast cancer through WGCNA and Mendelian randomization

Yilong Lin et al. Discov Oncol. .

Abstract

Objective: Triple-negative breast cancer (TNBC) represents a particularly aggressive form of breast cancer with a poor prognosis due to a lack of targeted treatments resulting from limited a understanding of the underlying mechanisms. The aim of this study was the identification of hub genes for TNBC and assess their clinical applicability in predicting the disease.

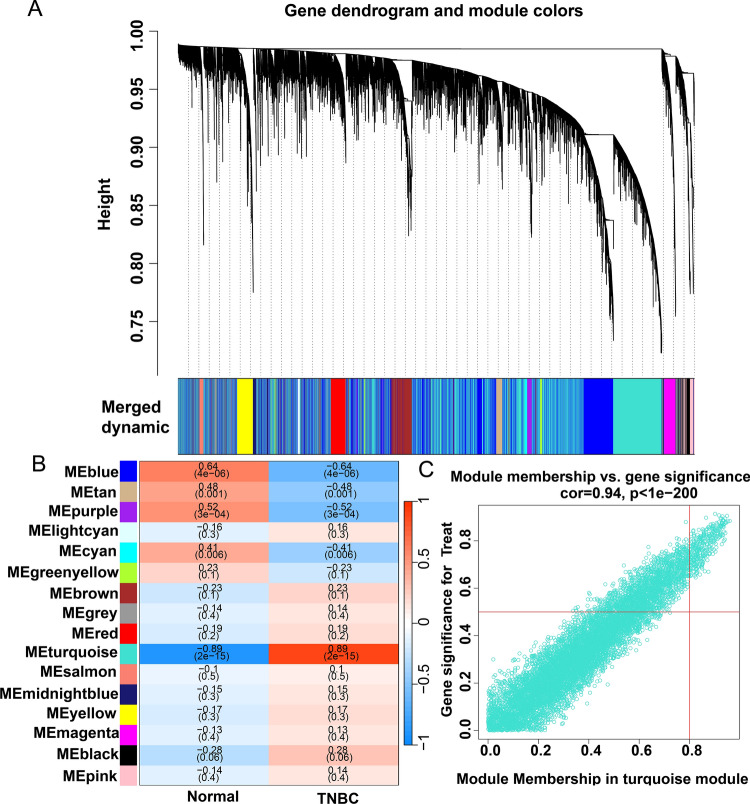
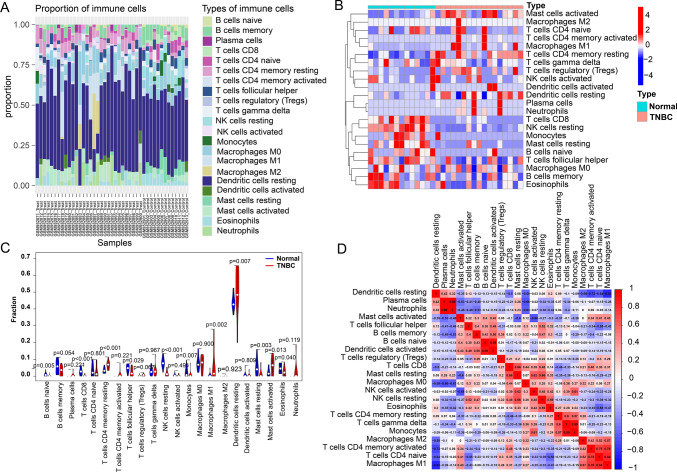
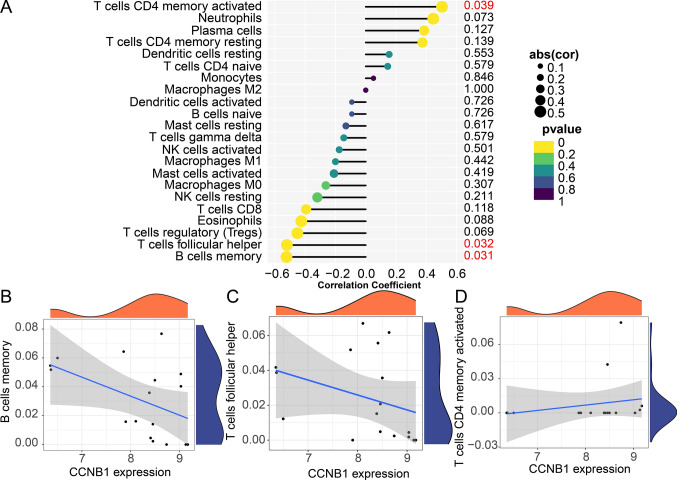
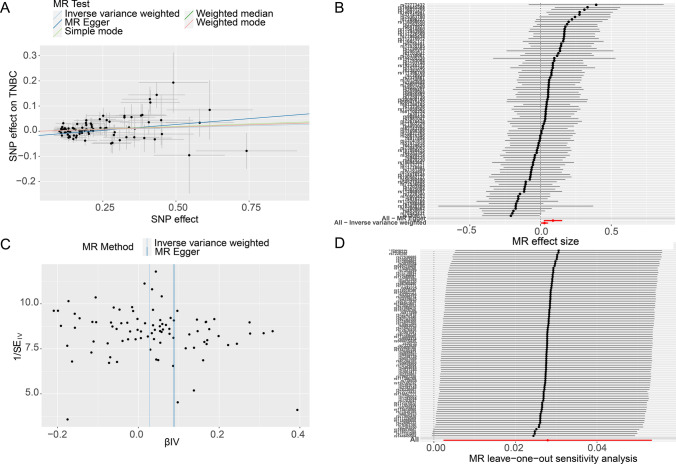
Methods: This study employed a combination of weighted gene co-expression network analysis (WGCNA) and differentially expressed genes (DEGs) to identify new susceptible modules and central genes in TNBC. The potential functional roles of the central genes were investigated using Kyoto Encyclopedia of Genes and Genomes (KEGG) and Gene Ontology (GO) analyses. Furthermore, a predictive model and ROC curve were developed to assess the diagnostic performance of the identified central genes. The correlation between CCNB1 and immune cells proportion was also investigated. At last, a Mendelian randomization (MR) analysis utilizing Genome-Wide Association Study (GWAS) data was analyzed to establish the causal effect of CCNB1 level on TNBC.

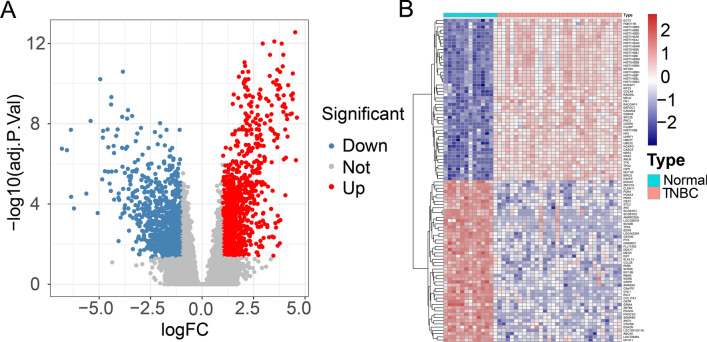
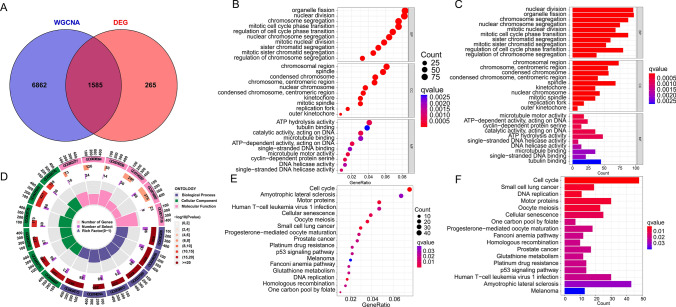
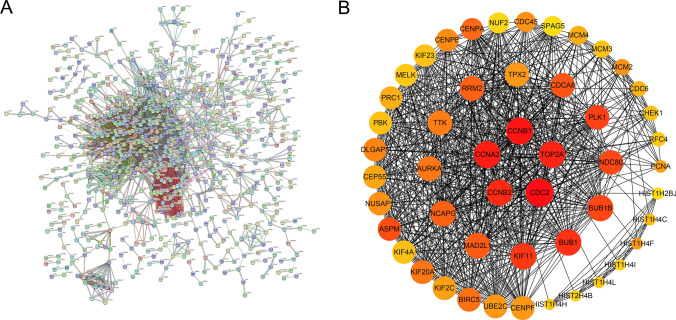
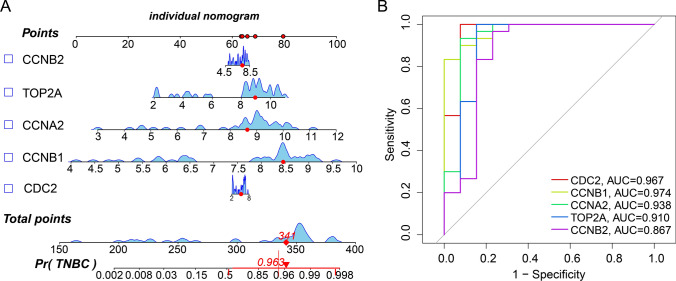
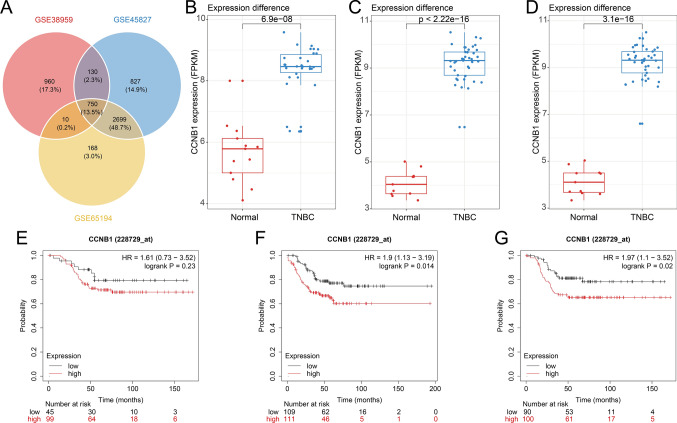
Results: WGCNA was applied to determine gene co-expression maps and identify the most relevant module. Through a screening process, 1585 candidate hub genes were subsequently identified with WGCNA and DEGs. GO and KEGG function enrichment analysis indicated that these core genes were related to various biological processes, such as organelle fission, chromosome segregation, nuclear division, mitotic cell cycle phase transition, the cell cycle, amyotrophic lateral sclerosis, and motor proteins. Using STRING and Cytoscape, the top five genes with high degrees were identified as CDC2, CCNB1, CCNA2, TOP2A, and CCNB2. The nomogram model demonstrated good performance in predicting TNBC risk and was proven effective in diagnosis, as evidenced by the receiver operating characteristic (ROC) curve. Further investigation revealed a causal association between CCNB1 and immune cell infiltrates in TNBC. Survival analysis revealed high expression of the CCNB1 gene leads to poorer prognosis in TNBC patients. Additionally, analysis using inverse variance weighting revealed that CCNB1 was linked to a 2.8% higher risk of TNBC (OR: 1.028, 95% CI 1.002-1.055, p = 0.032).

Conclusion: We established a co-expression network using the WGCNA methodology to detect pivotal genes associated with TNBC. This finding holds promise for advancing the creation of pre-symptomatic diagnostic tools and deepening our comprehension of the pathogenic mechanisms involved in TNBC risk genes.

Keywords: Biomarker; Breast cancer; CCNB1; Mendelian randomization; TNBC; Triple-negative breast cancer; WGCNA.


Conflict of interest statement

The authors have no relevant financial or non-financial interests to disclose.

Figures

Fig. 1
Fig. 1
Genes differentially expressed between the TNBC and normal groups. A Volcanic map for differential expression analysis of GSE38959. B Heat map for differential expression analysis of GSE38959. Blue represents down-regulated genes, red represents up-regulated genes, and black represents undifferentiated genes
Fig. 2
Fig. 2
Identification of TNBC-associated gene modules in the GEO dataset using WGCNA. A The genes in the GSE38959 dataset were clustered into a dendrogram using a topological overlap matrix (1-TOM). Each branch in the dendrogram represents a gene, and co-expression modules were created in various colors. B Module-trait heatmap of the correlation between the clustering gene module and TNBC in the GSE38959 dataset. Each module contains the corresponding correlation coefficient and p-value. C Scatter plot of module turquoise has the strongest positive correlation with TNBC in the GSE38959 dataset
Fig. 3
Fig. 3
Candidate hub genes were screened and validated. A Venn diagram revealed 1585 overlapping candidate hub genes. B, C, D Enrichment analysis of candidate hub genes. E, F KEGG pathway analysis of candidate hub genes
Fig. 4
Fig. 4
The construction of PPI network. A PPI network of overlapping candidate hub genes. B The top 50 protein of the interaction network were obtained by degree ssalgorithm
Fig. 5
Fig. 5
Predicting the risk of TNBC using nomograms. A Nomogram model of hub genes. B ROC curves to assess the diagnostic efficacy of nomogram model and each hub gene
Fig. 6
Fig. 6
Immuno-correlation of CCNB1 in TNBC. A The immune cell infiltration proportion in different samples. B A heatmap of 22 immune cells in each sample. C The difference of immune cell infiltration between TNBC and normal groups. D The correlation of 22 immune cells
Fig. 7
Fig. 7
Correlation between CCNB1 and 22 immune cells. A The association between CCNB1 expression and memory B cells. B The association between CCNB1 expression and memory B cells. C The association between CCNB1 expression and follicular helper T cells. D The association between CCNB1 expression and activated memory CD4 T cells
Fig. 8
Fig. 8
Independent dataset validation and survival analysis of CCNB1. A Venn plot of three independent dataset. B The CCNB1 expression (FPKM) difference between normal group and TNBC group in GSE38959. C The CCNB1 expression (FPKM) difference between normal group and TNBC group in GSE45827. D The CCNB1 expression (FPKM) difference between normal group and TNBC group in GSE65194. E OS analysis of CCNB1 in TNBC patients. F RFS analysis of CCNB1 in TNBC patients. G DMFS analysis of CCNB1 in TNBC patients
Fig. 9
Fig. 9
Mendelian randomization study results. A Scatter plot showing the causal effect of CCNB1 on the risk of TNBC. B Forest plot showing the causal effect of each SNP on the risk of TNBC. C Funnel plots to visualize overall heterogeneity of MR estimates for the effect of CCNB1 on TNBC. D Leave-one-out plot to visualize causal effect of CCNB1 on TNBC risk when leaving one SNP out

References

    1. Sung H, Ferlay J, Siegel RL, Laversanne M, Soerjomataram I, Jemal A, Bray F. Global cancer statistics 2020: GLOBOCAN estimates of incidence and mortality worldwide for 36 cancers in 185 countries. CA Cancer J Clin. 2021;71(3):209–249. doi: 10.3322/caac.21660. - DOI - PubMed
    1. Heer E, Harper A, Escandor N, Sung H, McCormack V, Fidler-Benaoudia MM. Global burden and trends in premenopausal and postmenopausal breast cancer: a population-based study. Lancet Glob Health. 2020;8(8):e1027–e1037. doi: 10.1016/S2214-109X(20)30215-1. - DOI - PubMed
    1. Kudelova E, Smolar M, Holubekova V, Hornakova A, Dvorska D, Lucansky V, Koklesova L, Kudela E, Kubatka P. Genetic heterogeneity, tumor microenvironment and immunotherapy in triple-negative breast cancer. Int J Mol Sci. 2022 doi: 10.3390/ijms232314937. - DOI - PMC - PubMed
    1. Garrido-Castro AC, Lin NU, Polyak K. Insights into molecular classifications of triple-negative breast cancer: improving patient selection for treatment. Cancer Discov. 2019;9(2):176–198. doi: 10.1158/2159-8290.CD-18-1177. - DOI - PMC - PubMed
    1. Lehmann BD, Colaprico A, Silva TC, Chen J, An H, Ban Y, Huang H, Wang L, James JL, Balko JM, et al. Multi-omics analysis identifies therapeutic vulnerabilities in triple-negative breast cancer subtypes. Nat Commun. 2021;12(1):6276. doi: 10.1038/s41467-021-26502-6. - DOI - PMC - PubMed

LinkOut - more resources