. 2024 Apr 12;23(1):110.
doi: 10.1186/s12934-024-02382-5.

Evaluation of heterologous expression in Pichia pastoris of Pine Weevil TRPA1 by GFP and flow cytometry

Affiliations

Evaluation of heterologous expression in Pichia pastoris of Pine Weevil TRPA1 by GFP and flow cytometry

Balder Werin et al. Microb Cell Fact. .

Abstract

Background: The wasabi receptor, also known as the Transient Receptor Potential Ankyrin 1 (TRPA1) ion channel, is a potential target for development of repellents for insects, like the pine weevil (Hylobius abietis) feeding on conifer seedlings and causing damage in forestry. Heterologous expression of TRPA1 from pine weevil in the yeast Pichia pastoris can potentially provide protein for structural and functional studies. Here we take advantage of the Green Fluorescent Protein (GFP) tag to examine the various steps of heterologous expression, to get more insight in clone selection, expression and isolation of the intact purified protein.

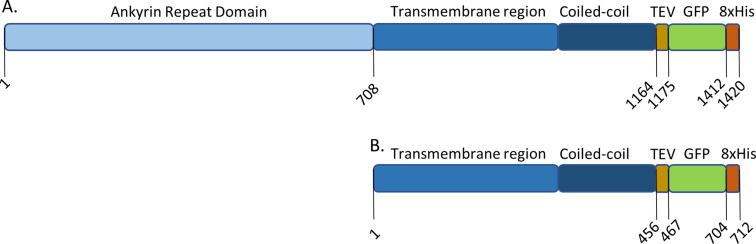
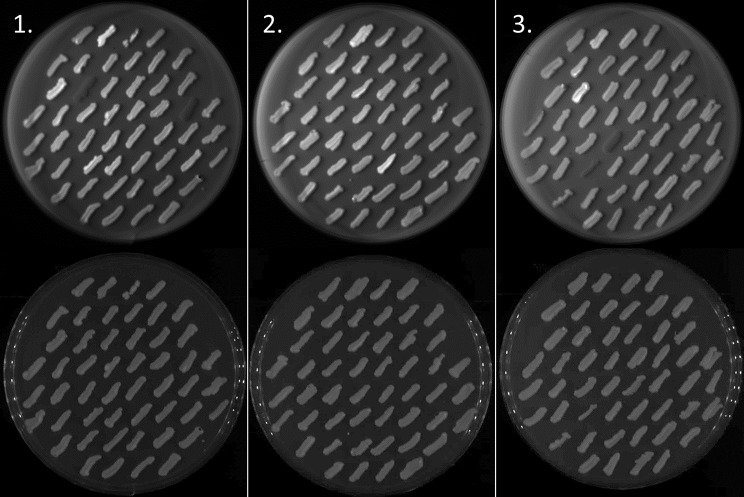
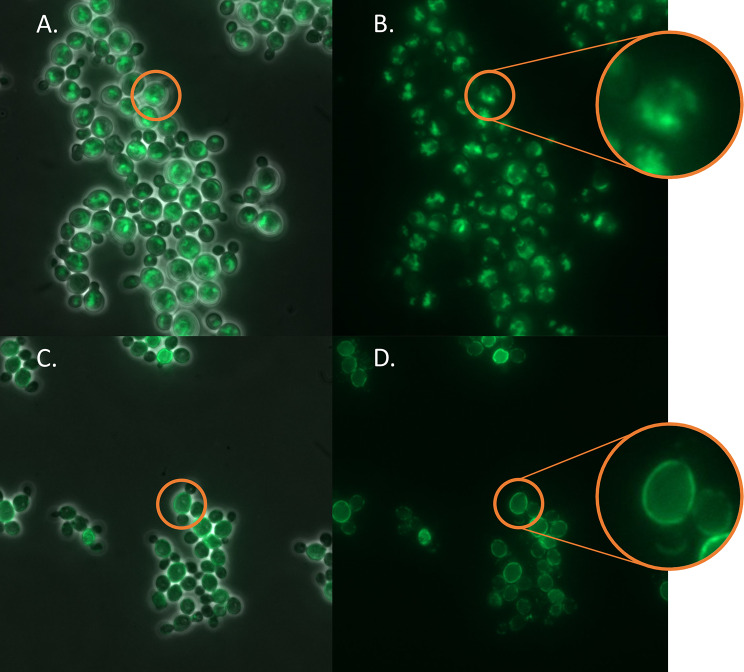
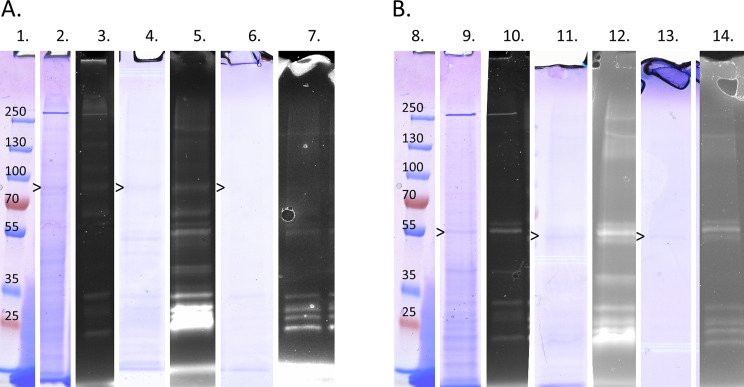
Results: The sequence of HaTRPA1 is reported and GFP-tagged constructs were made of the full-length protein and a truncated version (Δ1-708 HaTRPA1), lacking the N-terminal ankyrin repeat domain. Clones were screened on GFP expression plates, induced in small liquid cultures and in fed-batch cultures, and evaluated by flow cytometry and fluorescence microscopy. The screening on plates successfully identifies low-expression clones, but fails to predict the ranking of the best performing clones in small-scale liquid cultures. The two constructs differ in their cellular localization. Δ1-708 HaTRPA1 is found in a ring at the perimeter of cell, whereas HaTRPA1 is forming highly fluorescent speckles in interior regions of the cell. The pattern is consistent in different clones of the same construct and persists in fed-batch culture. The expression of Δ1-708 HaTRPA1 decreases the viability more than HaTRPA1, and in fed-batch culture it is clear that intact cells first express Δ1-708 HaTRPA1 and then become damaged. Purifications show that both constructs suffer from degradation of the expressed protein, but especially the HaTRPA1 construct.

Conclusions: The GFP tag makes it possible to follow expression by flow cytometry and fluorescence microscopy. Analyses of localization, cell viability and expression show that the former two parameters are specific for each of the two evaluated constructs, whereas the relative expression of the constructs varies with the cultivation method. High expression is not all that matters, so taking damaged cells into account, something that may be linked to protein degradation, is important when picking the most suitable construct, clone, and expression scheme.

Keywords: Hylobius abietis; Ankyrin repeat domain; Flow cytometry; Green Fluorescent Protein; Membrane protein; TRPA1; Viability.


Conflict of interest statement

The authors declare no competing interests.

Figures

Fig. 1
Fig. 1
Flow cytometric analysis of small-scale induction. (A) Cell viability. The relative number of cells with FL3-H (PI) values lower than the gate. The Δ1-708 HaTRPA1 cell samples have less PI negative cells, indicating a lower viability. (B, C) The mean GFP signal of the different types of constructs, only gated on FSC-A and SSC-A (B), and gated on FL3-H as well (C). Both constructs have higher GFP signals than the negative controls (B), but the HaTRPA1 cell samples have the highest GFP signal, considering only viable cells (C). The brackets indicate differences with statistical significance levels * corresponding to p < 0.05, and ** corresponding to p < 0.005 from a single factor ANOVA with Tukey-Kramer post hoc analysis. (1) All Δ1-708 HaTRPA1 clones except BW30 (corresponding clone without GFP tag) and 2.1.12, (2) Δ1-708 HaTRPA1 BW30, (3) all HaTRPA1 clones except 2.3.28, (4) Δ1-708 2.1.12 and HaTRPA1 2.3.28 (the low fluorescing negative reference clones)
Fig. 2
Fig. 2
Schematic representation of the constructs. Illustration showing locations of predicted domains and added C-terminal tags in the two constructs used in this study (A) HaTRPA1, (B) Δ1-708 HaTRPA1. Δ1-708 HaTRPA1, which is about half the size of the full length is lacking the Ankyrin repeat domain (ARD). Sequences of the constructs in FASTA format are provided in supplemental text file
Fig. 3
Fig. 3
Screening of GFP expression on plates. Top row, fluorescence imaging. Bottom row, white light imaging of the same plates. The left (plate 1) and middle (plate 2) column contain 48 clones each of Δ1-708 HaTRPA1, and the right (plate 3) column contains 48 clones of HaTRPA1. On each plate, the first clone is a low GFP control, and the second clone is a high GPF control from the first screen. Plate 1 clone 11, plate 2 clone 37 has similar intensity to the high control, and plate 3 clone 12 has higher intensity than the high control. Plate 1 clone 12 and 23, and plate 3 clone 28 and 35 have virtually no expression. On each plate clones are numbered starting from the top left
Fig. 4
Fig. 4
Subcellular localization of GFP signal. Representative images of the GFP signal together with phase contrast signal (A, C), and GFP signal alone (B, D). In HaTRPA1 clones (A, B, exemplified by clone HaTRPA1 1.2.1) the fluorescence is localized more to the interior of the cell with some very bright speckles, whereas in Δ1-708 HaTRPA1 clones (C, D, exemplified by clone Δ1-708 HaTRPA1 2.2.37) it is localized around the edge of the cell. A single cell of each construct is highlighted and shown in a close up
Fig. 5
Fig. 5
Data from monitoring of the fed-batch cultivations. Graphs indicating mean GFP signal and intact cells (PI negative) in the fermentor cultures of HaTRPA1 (A) and Δ1-708 HaTRPA1(B). In Δ1-708 HaTRPA1, the number of viable cells is decreasing towards the end of the fermentation. The bottom plot (C) shows the OD600 of HaTRPA1 and Δ1-708 HaTRPA1 in the fermentor cultures
Fig. 6
Fig. 6
Time series fed-batch flow cytometry bivariate plots. The panels correspond to the time points in Fig. 5A (top row, HaTRPA1) and B (lower row, Δ1-708 HaTRPA1). Note how the cells, most clearly seen in Δ1-708 HaTRPA1, move clockwise from the bottom left quadrant (Q4), through the top left quadrant (Q1) into the top right quadrant (Q2). This means that cells first start to express GFP and HaTRPA1, and then later lose viability. FL1 reports the GFP fluorescence and FL3 the PI staining i.e. damaged cells. The percentage of the total cells is indicated in each quadrant
Fig. 7
Fig. 7
Microtiter plate fluorescence measurements of solubilization samples. Most of the GFP signal is in the supernatant of HaTRPA1 (1) and Δ1-708 HaTRPA1 (2)
Fig. 8
Fig. 8
SEC chromatograms. Shows a peak close to the expected elution volume of tetrameric HaTRPA1 without GFP. Other peaks may be from monomers, free GFP etc. or from aggregates. Note that the main peak for both constructs arrives around 14 mL, which implies a similar size
Fig. 9
Fig. 9
Fluorescent gels and Coomassie stained gels from the purification show what remains in each step of the purification. Both the samples, HaTRPA1 and Δ1-708 HaTRPA1, contain a lot of smaller bands throughout the purification. (A) HaTRPA1 does not show any bands that obviously correspond to the correct size of the construct, but after the IMAC there is a band marked by an arrowhead just below 100 kDa, which is far smaller than expected. (B) Δ1-708 HaTRPA1 in the meantime, contains a band around 60 kDa throughout the purification, which is somewhat smaller than expected. (1 and 8) PageRuler Plus Prestained Protein Ladder (Thermo Fisher). (2, 3, 9 and 10) Washed membrane, Coomassie stained and fluorescent gel. (4, 5, 11, and 12) Eluate from IMAC, Coomassie stained and fluorescent gel. (6, 7, 13 and 14) Fraction 29 from the SEC, Coomassie stained and fluorescent gel. The full gels are found in Figures S5-S10

Similar articles

References

    1. Freigassner M, Pichler H, Glieder A. Tuning microbial hosts for membrane protein production. Microb Cell Fact. 2009;8:69. doi: 10.1186/1475-2859-8-69. - DOI - PMC - PubMed
    1. Day BLKR, Damage . Control and Management of Weevil Pests, especially Hylobius Abietis. In: François Lieutier KRD, Battisti A, Grégoire J-C, Evans HF, editors. Bark and Wood Boring insects in living trees in Europe. A Synthesis: Springer; 2004. pp. 414–44.
    1. Jordt S-E, Bautista DM, Chuang H-h, McKemy DD, Zygmunt PM, Högestätt ED, et al. Mustard oils and cannabinoids excite sensory nerve fibres through the TRP channel ANKTM1. Nature. 2004;427(6971):260–5. doi: 10.1038/nature02282. - DOI - PubMed
    1. Cordero-Morales JF, Gracheva EO, Julius D. Cytoplasmic ankyrin repeats of transient receptor potential A1 (TRPA1) dictate sensitivity to thermal and chemical stimuli. Proc Natl Acad Sci U S A. 2011;108(46):E1184–91. doi: 10.1073/pnas.1114124108. - DOI - PMC - PubMed
    1. Zhang H, Wang C, Zhang K, Kamau PM, Luo A, Tian L, et al. The role of TRPA1 channels in thermosensation. Cell Insight. 2022;1(6):100059. - PMC - PubMed

Substances

Supplementary concepts

LinkOut - more resources