. 2024 Apr 12;22(1):83.
doi: 10.1186/s12915-024-01879-0.

Targeting of REST with rationally-designed small molecule compounds exhibits synergetic therapeutic potential in human glioblastoma cells

Affiliations

Targeting of REST with rationally-designed small molecule compounds exhibits synergetic therapeutic potential in human glioblastoma cells

Svetlana B Panina et al. BMC Biol. .

Abstract

Background: Glioblastoma (GBM) is an aggressive brain cancer associated with poor prognosis, intrinsic heterogeneity, plasticity, and therapy resistance. In some GBMs, cell proliferation is fueled by a transcriptional regulator, repressor element-1 silencing transcription factor (REST).

Results: Using CRISPR/Cas9, we identified GBM cell lines dependent on REST activity. We developed new small molecule inhibitory compounds targeting small C-terminal domain phosphatase 1 (SCP1) to reduce REST protein level and transcriptional activity in glioblastoma cells. Top leads of the series like GR-28 exhibit potent cytotoxicity, reduce REST protein level, and suppress its transcriptional activity. Upon the loss of REST protein, GBM cells can potentially compensate by rewiring fatty acid metabolism, enabling continued proliferation. Combining REST inhibition with the blockade of this compensatory adaptation using long-chain acyl-CoA synthetase inhibitor Triacsin C demonstrated substantial synergetic potential without inducing hepatotoxicity.

Conclusions: Our results highlight the efficacy and selectivity of targeting REST alone or in combination as a therapeutic strategy to combat high-REST GBM.

Keywords: Glioblastoma (GBM); Repressor element-1 silencing transcription factor; SCP1 phosphatase; Synergy.


Conflict of interest statement

The authors declare that they have no conflicts of interest related to this research. However, it should be noted that SBP, DS, and YJZ are listed as inventors on a provisional patent related to the technology discussed in this paper.

Figures
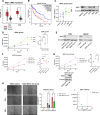
Fig. 1
Fig. 1
REST promotes glioblastoma growth. A Boxplot of REST mRNA expression in TCGA-LGG and TCGA-GBM samples compared to normal brain samples from TCGA and GTEx datasets (*p < 0.001). B Survival analysis using data from TCGA-GBM and TCGA-LGG projects. Analysis was done using GEPIA2 web server (A, B). C Basal REST protein amount in a panel of select cell lines. Three to four independent biological replicates are shown as mean ± SD. Statistical difference vs SVGp12 was tested using ANOVA with post hoc tests. Individual data values are provided in Additional File 10A. D Proliferation of GBM cell lines assessed by counting cells every 24 h. Shown is one representative replicate and quantification of PDT based on three independent experiments (mean ± SD). Statistical difference vs U251 was tested using ANOVA with post hoc tests. Individual data values are provided in Additional File 10B. E Western blot confirms the lack of REST in homozygous REST-KO clones of T98G (left) and HEK293 (right). F Proliferation of WT and REST-KO T98G cells was examined by counting cells every 24 h. Shown is one representative replicate and quantification of PDT based on three to four independent experiments (mean ± SD). Statistical comparison vs T98G control was performed using ANOVA with post hoc tests. Individual data values are provided in Additional File 10C. G Proliferation of T98G WT and REST-KO C10 cells (transfected with empty vector pLPC vs REST OE) was examined by counting cells every 24 h. Shown is one representative replicate and quantification of PDT based on three independent experiments. Statistical difference was tested using two-tailed paired t-test. Individual data values are provided in Additional File 10D. H Wound scratch assay and its quantification using ImageJ. Shown are mean ± SD from three independent biological experiments. Groups were compared using paired t-tests. Individual data values are provided in Additional File 10E. I Effect of REST loss on GSC marker expression. Shown are fold changes (FC) vs CRISPR Control derived from three independent biological replicates. Comparison vs control was performed using unpaired one-tailed t-tests. Dashed line indicates FC = 1. Individual data values are provided in Additional File 10F. ***p < 0.001; **p < 0.01; *p < 0.05; ns—not significant
Fig. 2
Fig. 2
Novel covalent inhibition of SCP1 with small molecule compounds. A Chemical structures of lead SCP1 inhibitors. B–D Kinetic characterization of GR-28 against the phosphatase activity of SCP1. B Competitive assay against the pNPP substrate was performed with preincubation of GR-28 compound and SCP1 enzyme for 30, 60, 120, 180, 300, and 1260 min. Time-lapse IC50 curves were obtained. C The IC50 data of the pNPP substrate was converted to ln % remaining activity against time at different concentrations of GR-28 (0, 0.3125, 0.625, 1.25, and 2.5 μM). D The rate of inactivation (kobs) was plotted against inhibitor concentration and fitted to the equation: kobs = kinact × [I]/(KI + [I]). Each data point was obtained from three replicates, and the error bars indicate SD. E The rate of inorganic phosphate generation measured by malachite green assay: SCP1 was pre-incubated with DMSO/GR-28 (20 μM), then samples were incubated with phosphorylated p-Ser861-REST. Each data point was obtained from three replicates, and the error bars indicate SD. F SCP1 WT was incubated overnight with GR-28 compound and then analyzed by MALDI-TOF MS. The blue trace represents the DMSO control, while the orange trace represents the GR-28 treatment. G pNPP assay of phosphatase activity of SCP1 WT (orange) or SCP1 C181A mutant (blue) upon incubation with GR-28 for 5 h. Error bars indicate SD from three replicates. H SCP1 C181A was incubated overnight with GR-28 compound and then analyzed by MALDI-TOF MS. I Model of covalent inhibition of SCP1 by GR28 (PDB Code: 3PGL). A magnesium ion is shown in the active site of SCP1 as a green sphere. Key residues predicted to interact with GR28 are shown as sticks. GR-28 is shown as sticks colored by atoms with carbon atoms in violet, oxygen in red, and nitrogen in blue. Side chain and main chain interactions between SCP1 and GR28 are shown in dashed lines
Fig. 3
Fig. 3
Transcriptome sequencing reveals distinct changes in gene signatures associated with REST. A RNA-seq analyses showing gene upregulation and downregulation (highlighted in red, log2FC cutoff = 0.58, padj < 0.05) in REST KO cells compared to corresponding control (T98G—left, HEK293—right). Representative volcano plots were built using “Enhanced Volcano” Bioconductor package. B Venn diagrams of deregulated genes shared between three “slow” T98G REST-KO clones (C10, F7, and G2): upregulated genes are shown on the left, downregulated genes are shown on the right. C GO (gene ontology) categories enriched among upregulated genes (top) and downregulated genes (bottom) in T98G REST-KO vs control. D Overlap of upregulated genes in glioblastoma (left, shared between three “slow” clones, in green) and HEK293 (right, shared between two clones, in green) and a published subset of genes with REST binding sites in human embryonic stem cells (in yellow) [29]. E A list of representative REST-target genes (n = 6) based on Tag-Seq and TCGA-GBM data analysis (shown are correlation coefficients of gene expression with REST mRNA). F Validation of REST-target genes by qPCR assay in REST-KO cells. Shown are fold changes (FC) vs T98G control cells derived from three independent biological replicates. Gene expression was measured using ddCt method and normalized by ACTB expression. Comparison vs control was performed using one-tailed t-tests. Dashed line indicates FC = 1.5. Individual data values are provided in Additional File 10G
Fig. 4
Fig. 4
Top lead GR-28 decreases functional activity of REST and is cytotoxic against high-REST GBM cells. A Effect of GR-28 on REST protein level in A172 cells (4 μM for 24 h) and T98G cells (10 μM for 48 h). Shown is one representative WB replicate (left) and quantification (right) from three to four independent cell treatments (mean ± SEM). Comparison vs DMSO was performed using paired one-tailed t-tests. Dashed lines indicate that adjacent blots were processed on different days. Individual data values are provided in Additional File 10H-I. B Effect of GR-28 on mRNA level of REST-target genes in A172 cells (4 μM for 18 h, left) and T98G cells (10 μM for 36 h, right). Shown are fold changes (FC) vs DMSO derived from three to four independent biological replicates. Gene expression was measured using ddCt method and normalized by ACTB expression. Comparison vs DMSO was performed using paired one-tailed t-tests. Dashed line indicates FC = 1.5. Individual data values are provided in Additional File 10J-K. C Survival rates (72 h) of high-REST GBMs (A172 and T98G) and control cells (HepG2) under single drug treatment with GR-28. Shown are viability rates (mean ± SEM) normalized to that of solvent-control wells derived from three to four independent experiments, n = 9–18. D Sensitivity (72 h) of high-REST GBMs (A172 and T98G) and control cells (HepG2) to GR-28. Shown are LD50s (lethal doses 50) with 95% confidence intervals calculated from three to four independent biological replicates using “drc” R package. TrC = Triacsin C (sensitization at 0.625 and 2.5 μM in T98G and A172, respectively). E Protective effect of REST-OE under GR-28 treatment (24 h) in A172 cells (two independent replicates combined, n = 6). Group comparison was performed using multiple t-tests. Validation of transient REST overexpression is shown on the right side. *p < 0.05, ns not significant
Fig. 5
Fig. 5
REST-null GBM cells can rescue their growth through lipid metabolism rewiring. A Left, Western blotting confirms lack of REST protein in D4 cells. Proliferation of WT and D4 cells was examined by counting cells every 24 h. Shown is one representative replicate and quantification of PDT (right) based on three to four independent experiments (mean ± SD). Statistical comparison vs T98G control was performed using ANOVA with post hoc tests. Individual data values are provided in Additional File 10C. B Venn diagram showing overlap between upregulated DEGs in “slow” clones and “fast” D4 cells. C Gene ontology categories significantly enriched among D4-specific upregulated DEGs. D Gene network for “Fatty acid metabolic process” (GO:0006631) as a top-significant category from C. Network was built using STRING v.12 database. E Gene expression of ACSL1 and ACSL3 in T98G WT, “slow”, and “fast” REST-KO cells. Statistical difference between groups was tested using t-test. Shown are mean ± SEM from three biological replicates. Individual data values are provided in Additional File 10L. F Proliferation of D4 cells, in the presence of DMSO or pan-ACSL inhibitor Triacsin C (500 nM) in the media, was examined by counting cells every 24 h. Shown is one representative replicate and quantification of PDT based on three independent experiments. Statistical difference between groups was tested using two-tailed paired t-test. Individual data values are provided in Additional File 10 M. G Proliferation of D4 cells in the presence of Triacsin C (500 nM) does not differ from that of “slow” REST-KO clones. Comparison was performed using ANOVA with post hoc tests. Individual data values are provided in Additional File 10N. H Sensitivity of T98G WT and REST-KO cells to pan-ACSL inhibitor Triacsin C (72 h). Shown are LD50s with 95% confidence intervals calculated from three to four independent biological replicates. LD50s were compared vs T98G control using ratio test from “drc” R package. I Effects of GR-28 lead (4 μM for 18 h) on expression of select lipid metabolism genes from the network (D). Shown are fold changes (FC) vs DMSO derived from four independent biological replicates. Dashed line indicates FC = 1.5. Individual data values are provided in Additional File 10O. **p < 0.01; *p < 0.05; ns—not significant
Fig. 6
Fig. 6
GR-28 exhibits synergy with fatty acid metabolism inhibitor in high-REST GBM cells. A–C Drug combination landscapes (72 h) in GBMs (A–B) and HepG2 cells (C). HepG2 cells were treated under the same doses as A172. Shown is the representative landscape having maximal synergy score closest to its mean value. Landscapes were built using “synergyfinder” R package (Bliss model). D Low-toxic dose of Triacsin C sensitizes high-REST GBM cells to GR-28. Shown are viability rates (mean ± SEM) normalized to that of solvent-control wells derived from three independent experiments, n = 9. E Maximal synergy scores (mean ± SEM) extracted from three independent drug combination landscapes (GR-28/Triacsin C) in A172, T98G, and HepG2 cells. Statistical difference was tested using a t-test. Individual data values are provided in Additional File 10P. F Selective effect of GR-28/Triacsin C drug combination on GBM cells. Plotted are viabilities (mean ± SEM, 3 independent experiments, n = 9–12, 72 h) normalized to that of solvent-control wells under single drug treatments and combination treatments. Statistical difference was tested using multiple t-tests. G Simultaneous targeting of REST and fatty acid metabolism results in synergistic cell death in GBM cells. Model was created using BioRender software. **p < 0.01; *p < 0.05

References

    1. Poon MTC, Sudlow CLM, Figueroa JD, Brennan PM. Longer-term (≥ 2 years) survival in patients with glioblastoma in population-based studies pre- and post-2005: a systematic review and meta-analysis. Sci Rep. 2020;10(1):11622. doi: 10.1038/s41598-020-68011-4. - DOI - PMC - PubMed
    1. Zhou W, Wahl DR. Metabolic abnormalities in glioblastoma and metabolic strategies to overcome treatment resistance. Cancers (Basel). 2019;11(9):1231. - PMC - PubMed
    1. Pearson JRD, Regad T. Targeting cellular pathways in glioblastoma multiforme. Signal Transduct Target Ther. 2017;2:17040. doi: 10.1038/sigtrans.2017.40. - DOI - PMC - PubMed
    1. Chong JA, Tapia-Ramírez J, Kim S, Toledo-Aral JJ, Zheng Y, Boutros MC, et al. REST: a mammalian silencer protein that restricts sodium channel gene expression to neurons. Cell. 1995;80(6):949–957. doi: 10.1016/0092-8674(95)90298-8. - DOI - PubMed
    1. Negrini S, Prada I, D'Alessandro R, Meldolesi J. REST: an oncogene or a tumor suppressor? Trends Cell Biol. 2013;23(6):289–295. doi: 10.1016/j.tcb.2013.01.006. - DOI - PubMed

Substances