

RUNX1-BMP2 promotes vasculogenic mimicry in laryngeal squamous cell carcinoma via activation of the PI3K-AKT signaling pathway
- PMID: 38610001
- PMCID: PMC11010429
- DOI: 10.1186/s12964-024-01605-x
RUNX1-BMP2 promotes vasculogenic mimicry in laryngeal squamous cell carcinoma via activation of the PI3K-AKT signaling pathway
Abstract
Background: Laryngeal squamous cell carcinoma (LSCC) is one of the most common malignant tumors of the head and neck. Vasculogenic mimicry (VM) is crucial for tumor growth and metastasis and refers to the formation of fluid channels by invasive tumor cells rather than endothelial cells. However, the regulatory mechanisms underlying VM during the malignant progression of LSCC remain largely unknown.
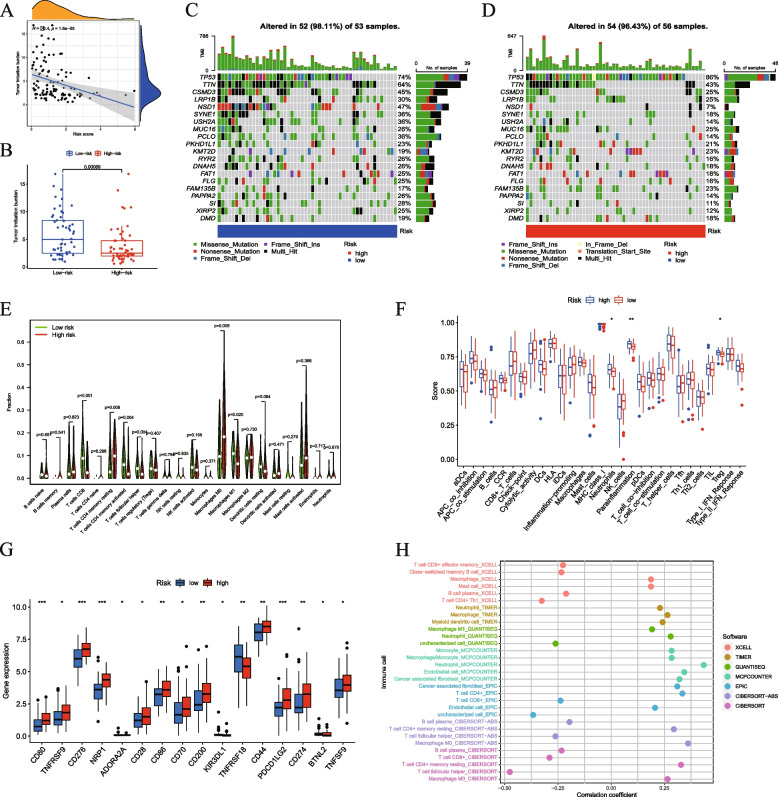
Methods: Gene expression and clinical data for LSCC were obtained from the TCGA and Gene GEO (GSE27020) databases. A risk prediction model associated with VM was established using LASSO and Cox regression analyses. Based on their risk scores, patients with LSCC were categorized into high- and low-risk groups. The disparities in immune infiltration, tumor mutational burden (TMB), and functional enrichment between these two groups were examined. The core genes in LSCC were identified using the machine learning (SVM-RFE) and WGCNA algorithms. Subsequently, the involvement of bone morphogenetic protein 2 (BMP2) in VM and metastasis was investigated both in vitro and in vivo. To elucidate the downstream signaling pathways regulated by BMP2, western blotting was performed. Additionally, ChIP experiments were employed to identify the key transcription factors responsible for modulating the expression of BMP2.
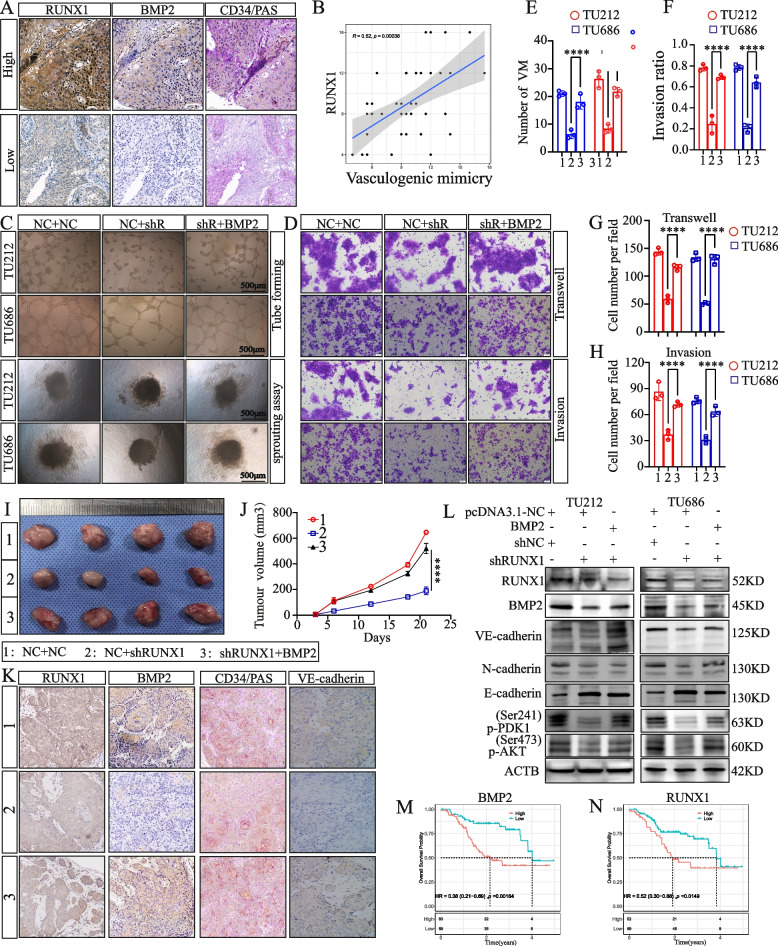
Results: We established a new precise prognostic model for LSCC related to VM based on three genes: BMP2, EPO, and AGPS. The ROC curves from both TCGA and GSE27020 validation cohorts demonstrated precision survival prediction capabilities, with the nomogram showing some net clinical benefit. Multiple algorithm analyses indicated BMP2 as a potential core gene. Further experiments suggested that BMP2 promotes VM and metastasis in LSCC. The malignant progression of LSCC is promoted by BMP2 via the activation of the PI3K-AKT signaling pathway, with the high expression of BMP2 in LSCC resulting from its transcriptional activation by runt-related transcription factor 1 (RUNX1).
Conclusion: BMP2 predicts poor prognosis in LSCC, promotes LSCC VM and metastasis through the PI3K-AKT signaling pathway, and is transcriptionally regulated by RUNX1. BMP2 may be a novel, precise, diagnostic, and therapeutic biomarker of LSCC.
Keywords: Bone morphogenetic protein 2; Laryngeal squamous cell carcinoma; Metastasis; Runt-related transcription factor 1; Vasculogenic mimicry.
© 2024. The Author(s).
Conflict of interest statement
The authors declare no competing interests.
Figures


Similar articles
-
A novel fumaric acid metabolism-related prognostic signature associated with prognosis and immune infiltration landscape in laryngeal squamous cell carcinoma.Transl Cancer Res. 2025 Jul 30;14(7):3991-4008. doi: 10.21037/tcr-2025-29. Epub 2025 Jul 25. Transl Cancer Res. 2025. PMID: 40792153 Free PMC article.
-
Identification of biomarkers for Laryngeal squamous cell carcinoma through Mendelian randomization and integrated bioinformatics analysis.Discov Oncol. 2025 Jul 18;16(1):1364. doi: 10.1007/s12672-025-03114-w. Discov Oncol. 2025. PMID: 40679719 Free PMC article.
-
Tumor-expressed B7-H3 promotes vasculogenic mimicry formation rather than angiogenesis in non-small cell lung cancer.J Cancer Res Clin Oncol. 2023 Sep;149(11):8729-8741. doi: 10.1007/s00432-023-04790-3. Epub 2023 May 2. J Cancer Res Clin Oncol. 2023. PMID: 37129607 Free PMC article.
-
Cost-effectiveness of using prognostic information to select women with breast cancer for adjuvant systemic therapy.Health Technol Assess. 2006 Sep;10(34):iii-iv, ix-xi, 1-204. doi: 10.3310/hta10340. Health Technol Assess. 2006. PMID: 16959170
-
Systemic pharmacological treatments for chronic plaque psoriasis: a network meta-analysis.Cochrane Database Syst Rev. 2017 Dec 22;12(12):CD011535. doi: 10.1002/14651858.CD011535.pub2. Cochrane Database Syst Rev. 2017. Update in: Cochrane Database Syst Rev. 2020 Jan 9;1:CD011535. doi: 10.1002/14651858.CD011535.pub3. PMID: 29271481 Free PMC article. Updated.
Cited by
-
BMP2 expression in oral squamous cell carcinoma and its effects on SCC9 cell biological behavior.Sci Rep. 2025 Apr 4;15(1):11584. doi: 10.1038/s41598-025-96274-2. Sci Rep. 2025. PMID: 40185978 Free PMC article.
-
Arsenic trioxide regulates DYNAP through hsa-mir-573 and inhibits the proliferation of laryngeal cancer.Sci Rep. 2025 Jul 28;15(1):27517. doi: 10.1038/s41598-025-12881-z. Sci Rep. 2025. PMID: 40721473 Free PMC article.
-
Metabolic profiles in laryngeal cancer defined two distinct molecular subtypes with divergent prognoses.Front Immunol. 2025 May 22;16:1512502. doi: 10.3389/fimmu.2025.1512502. eCollection 2025. Front Immunol. 2025. PMID: 40475768 Free PMC article.
-
The mechanistic study of codonopsis pilosula on laryngeal squamous cell carcinoma based on network pharmacology and experimental validation.Front Pharmacol. 2025 Apr 25;16:1542116. doi: 10.3389/fphar.2025.1542116. eCollection 2025. Front Pharmacol. 2025. PMID: 40351428 Free PMC article.
-
A novel fumaric acid metabolism-related prognostic signature associated with prognosis and immune infiltration landscape in laryngeal squamous cell carcinoma.Transl Cancer Res. 2025 Jul 30;14(7):3991-4008. doi: 10.21037/tcr-2025-29. Epub 2025 Jul 25. Transl Cancer Res. 2025. PMID: 40792153 Free PMC article.
References
Publication types
MeSH terms
Substances
Grants and funding
LinkOut - more resources
Full Text Sources
Medical
Molecular Biology Databases
Research Materials
