. 2024 Apr 13;43(1):112.
doi: 10.1186/s13046-024-03039-2.

Augmented ERO1α upon mTORC1 activation induces ferroptosis resistance and tumor progression via upregulation of SLC7A11

Affiliations

Augmented ERO1α upon mTORC1 activation induces ferroptosis resistance and tumor progression via upregulation of SLC7A11

Zixi Wang et al. J Exp Clin Cancer Res. .

Abstract

Background: The dysregulated mechanistic target of rapamycin complex 1 (mTORC1) signaling plays a critical role in ferroptosis resistance and tumorigenesis. However, the precise underlying mechanisms still need to be fully understood.

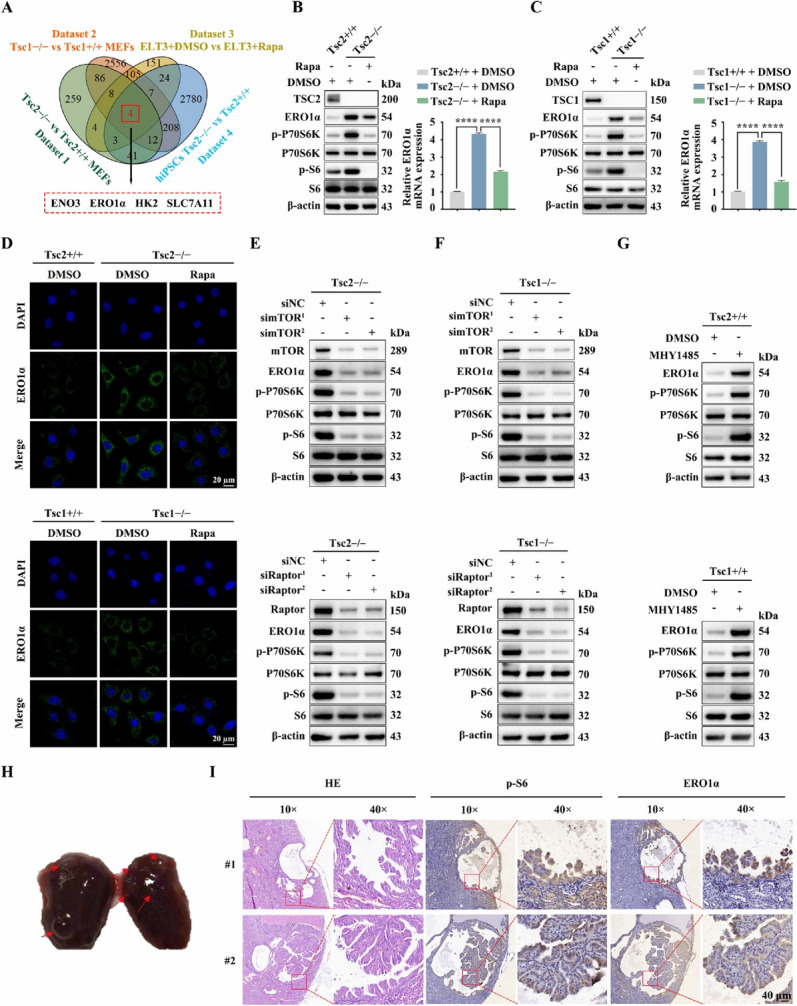
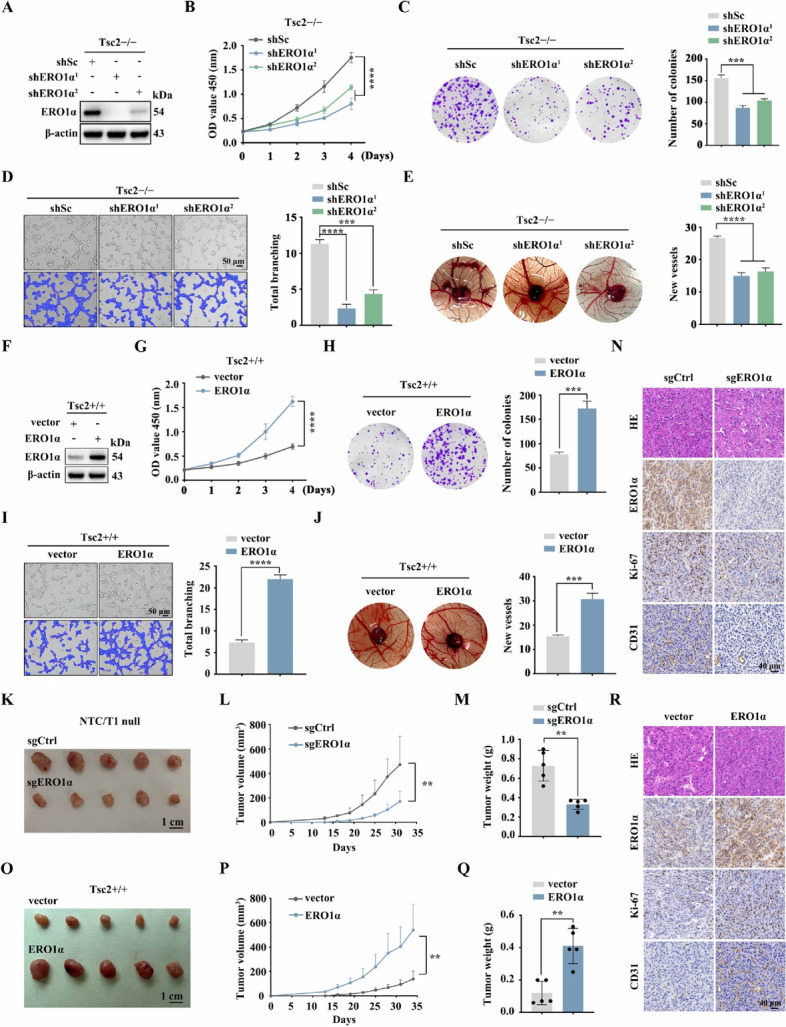
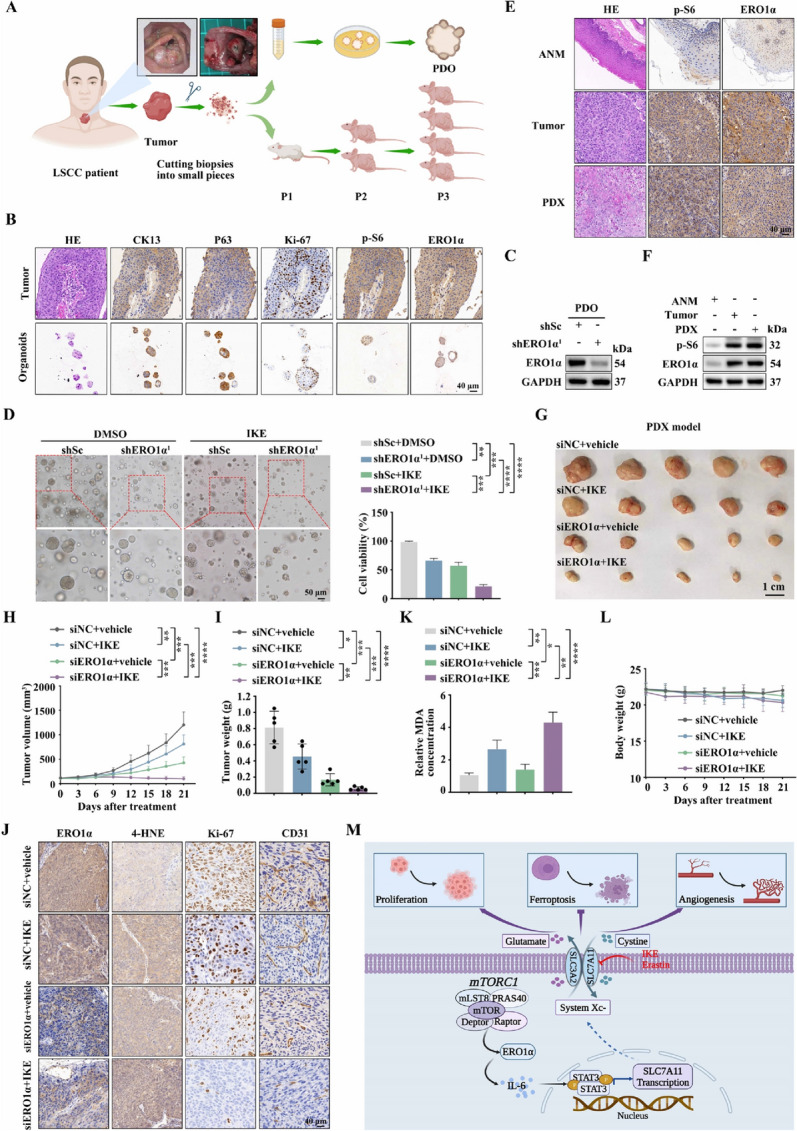
Methods: Endoplasmic reticulum oxidoreductase 1 alpha (ERO1α) expression in mTORC1-activated mouse embryonic fibroblasts, cancer cells, and laryngeal squamous cell carcinoma (LSCC) clinical samples was examined by quantitative real-time PCR (qRT-PCR), western blotting, immunofluorescence (IF), and immunohistochemistry. Extensive in vitro and in vivo experiments were carried out to determine the role of ERO1α and its downstream target, member 11 of the solute carrier family 7 (SLC7A11), in mTORC1-mediated cell proliferation, angiogenesis, ferroptosis resistance, and tumor growth. The regulatory mechanism of ERO1α on SLC7A11 was investigated via RNA-sequencing, a cytokine array, an enzyme-linked immunosorbent assay, qRT-PCR, western blotting, IF, a luciferase reporter assay, and a chromatin immunoprecipitation assay. The combined therapeutic effect of ERO1α inhibition and the ferroptosis inducer imidazole ketone erastin (IKE) on mTORC1-activated cells was evaluated using cell line-derived xenografts, LSCC organoids, and LSCC patient-derived xenograft models.

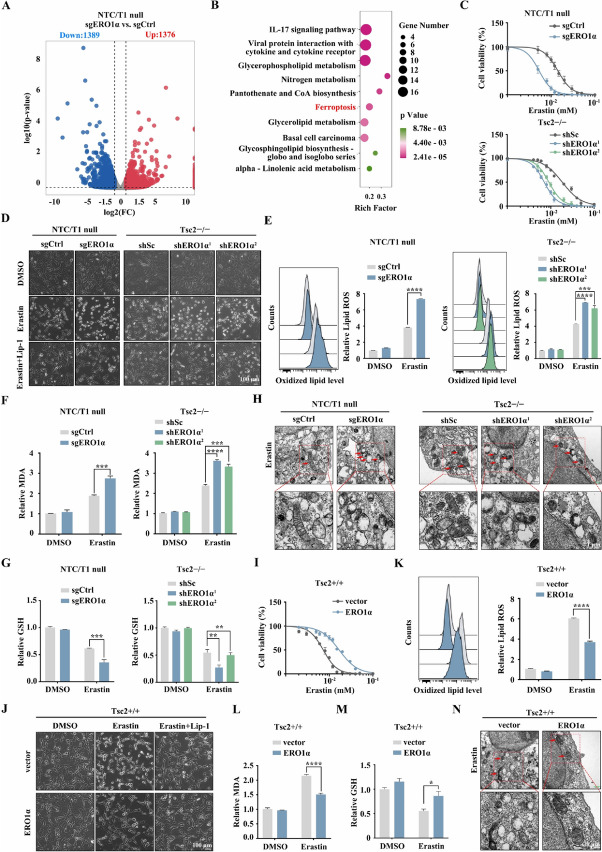
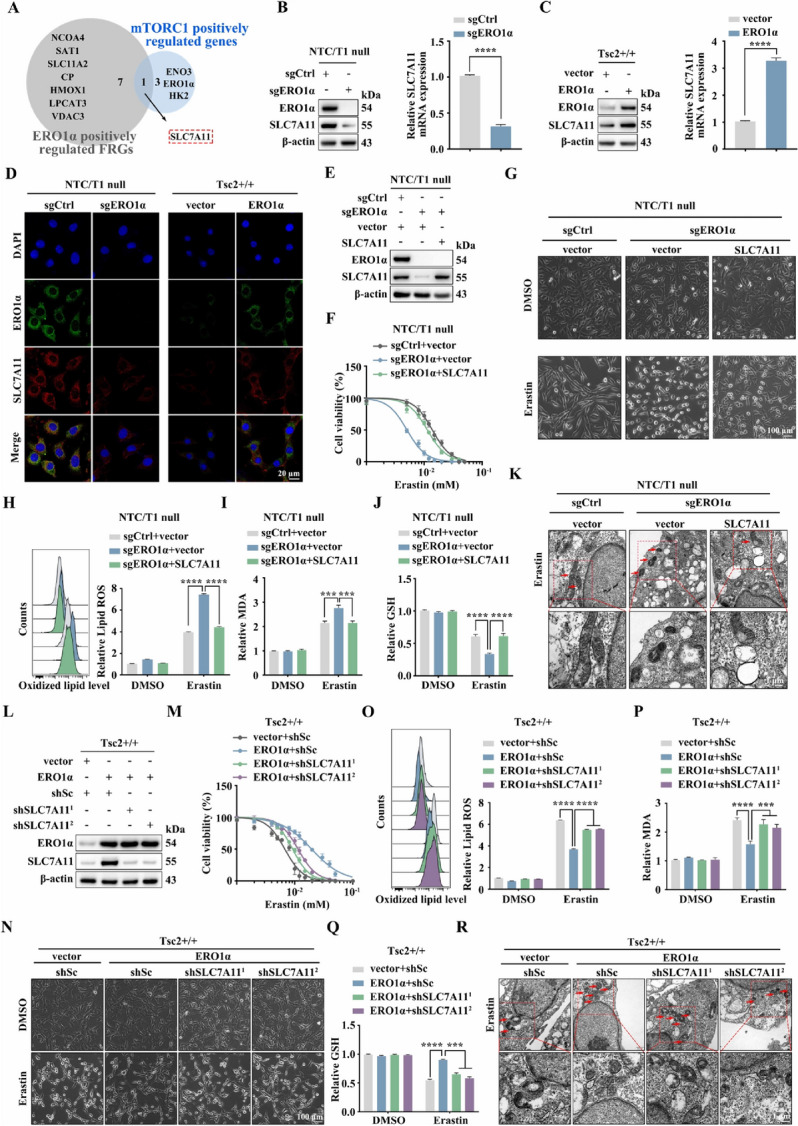
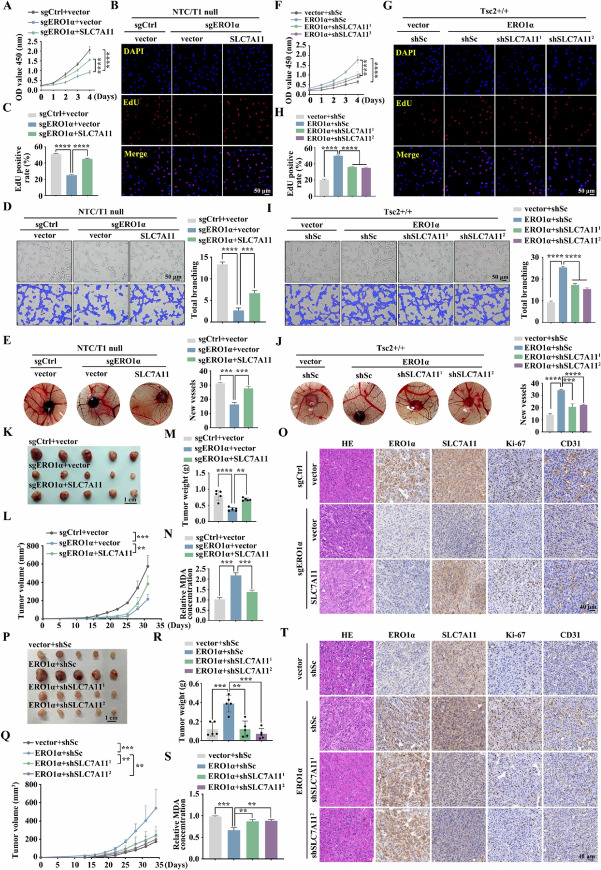
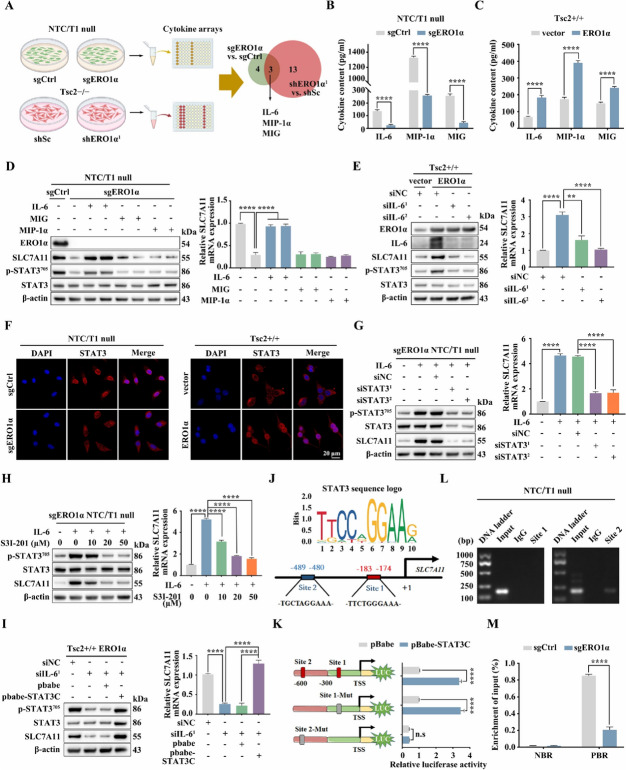
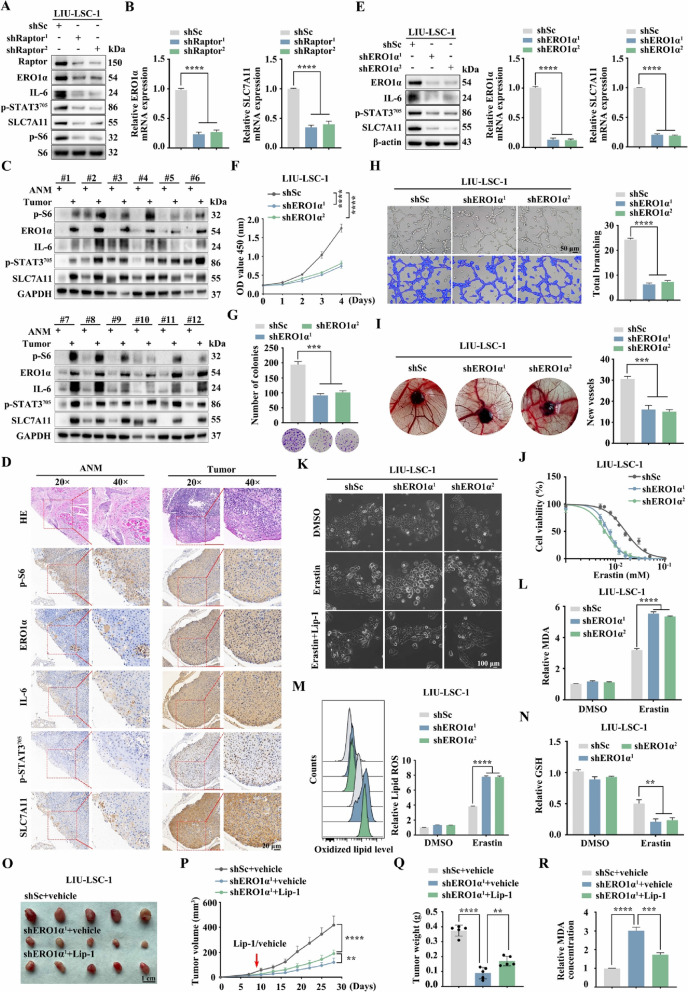
Results: ERO1α is a functional downstream target of mTORC1. Elevated ERO1α induced ferroptosis resistance and exerted pro-oncogenic roles in mTORC1-activated cells via upregulation of SLC7A11. Mechanically, ERO1α stimulated the transcription of SLC7A11 by activating the interleukin-6 (IL-6)/signal transducer and activator of transcription 3 (STAT3) pathway. Moreover, ERO1α inhibition combined with treatment using the ferroptosis inducer IKE exhibited synergistic antitumor effects on mTORC1-activated tumors.

Conclusions: The ERO1α/IL-6/STAT3/SLC7A11 pathway is crucial for mTORC1-mediated ferroptosis resistance and tumor growth, and combining ERO1α inhibition with ferroptosis inducers is a novel and effective treatment for mTORC1-related tumors.

Keywords: ERO1α; Ferroptosis; SLC7A11; Tumor growth; mTOR.


Conflict of interest statement

The authors have no conflict of interests to declare.

Figures

Fig. 1
Fig. 1
mTORC1 upregulates the expression of ERO1α. A Venn diagram analysis of differentially upregulated genes in four datasets. Dataset 1: Tsc2 − / − vs. Tsc2 + / + MEFs. Dataset 2: Tsc1 − / − vs. Tsc1 + / + MEFs. Dataset 3: ELT3 cells treated with DMSO vs. ELT3 cells treated with rapamycin (20 nM, 24 h). Dataset 4: hiPSCs Tsc2 − / − vs. hiPSCs Tsc2 + / + . B Tsc2 + / + and Tsc2 − / − MEFs were treated with rapamycin (Rapa, 20 nM) or DMSO for 24 h. C Tsc1 + / + and Tsc1 − / − MEFs were treated with rapamycin (Rapa, 20 nM) or DMSO for 24 h. B and C Cell lysates were subjected to immunoblotting with the indicated antibodies (left panels); ERO1α levels were analyzed by qRT–PCR (right panels). D IF analysis of the expression of ERO1α in the indicated cells. Scale bar, 20 μm. E and F Tsc2 − / − (E) or Tsc1 − / − (F) MEFs were transfected with siRNA targeting mTOR (simTOR), Raptor (siRaptor) or the control (siNC) for 48 h. G Tsc2 + / + or Tsc1 + / + MEFs were treated with 5 μM MHY1485 for 24 h. EG Cell lysates were subjected to immunoblotting with the indicated antibodies. H A representative kidney of Tsc2 + / − mice. Red arrows indicate renal cysts and cystadenomas. I Representative IHC images of p-S6 and ERO1α staining from renal cystadenomas of Tsc2 + / − mice. Error bars indicate mean ± SD of triplicate samples. ****P < 0.0001
Fig. 2
Fig. 2
ERO1α promotes cell proliferation, angiogenesis, and tumor growth driven by mTORC1 activation. AE Tsc2 − / − MEFs were transduced with lentivirus expressing shRNAs against ERO1α (shERO1α1 and shERO1α.2) or a scrambled sequence (shSc). FJ Tsc2 + / + MEFs were infected with control (vector) lentiviruses or lentiviruses encoding ERO1α. AJ The expression of ERO1α was assessed by western blotting (A and F); the cell proliferation was evaluated by CCK-8 (B and G) and colony formation (C and H) assays; the effect on angiogenesis was determined by tube formation (D and I) and CAM assays (E and J). Representative images (left panels) and quantifications (right panels). KR Tumor growth of mice subcutaneously inoculated with the indicated cells. N = 5 for each group. K and O Tumor pictures. L and P Tumor growth curves. M and Q Tumor weight. N and R Representative IHC staining for ERO1α, Ki-67, and CD31 of the indicated tumor tissues. Scale bar, 40 μm. Error bars indicate mean ± SD of triplicate (if mentioned otherwise) samples. **P < 0.01; ***P < 0.001; ****P < 0.0001
Fig. 3
Fig. 3
ERO1α facilitates resistance to ferroptosis. A and B sgERO1α and sgCtrl NTC/T1 null cells were subjected to RNA-seq analysis. A Volcano plot of differentially expressed genes. B KEGG enrichment analysis of differentially downregulated genes. C and I Cell viability of the indicated cells following treatment with erastin for 24 h. D and J The indicated cells were treated with or without erastin (10 μM) in the absence or presence of Lip-1 (1 μM) for 24 h. The corresponding phase contrast images are shown. Scale bar, 100 μm. EG and KM The indicated cells were treated with or without erastin (10 μM) for 24 h, and then L-ROS (E and K), intracellular MDA (F and L), and intracellular GSH (G and M) were assayed. H and N Representative TEM images of the mitochondrial morphology in the indicated cells treated with 10 μM erastin for 16 h. Red arrows indicate mitochondria. Scale bar, 1 μm. Error bars indicate mean ± SD of triplicate samples. *P < 0.05; **P < 0.01; ***P < 0.001; ****P < 0.0001
Fig. 4
Fig. 4
ERO1α facilitates ferroptosis resistance through the upregulation of SLC7A11. A Venn diagram of the ferroptosis-related genes (FRGs) positively regulated by ERO1α and mTORC1 positively regulated genes. B sgERO1α and sgCtrl NTC/T1 null cells. C ERO1α-overexpressing Tsc2 + / + MEFs and the control cells. B and C SLC7A11 levels were examined by western blotting (left panels) and qRT–PCR (right panels). D IF analysis of the expression of SLC7A11 in the indicated cells. Scale bar, 20 μm. EK sgERO1α NTC/T1 null cells were infected with lentiviruses carrying an empty vector (vector) or expression vectors for SLC7A11. LR ERO1α-expressing Tsc2 + / + MEFs were infected with lentivirus harboring SLC7A11 shRNAs (shSLC7A111 and shSLC7A11.2) or a scrambled shRNA (shSc). E and L SLC7A11 and ERO1α protein levels were examined by western blotting. F and M Cell viability was assessed after treatment with different concentrations of erastin for 24 h in the indicated cells. G and N Representative phase-contrast images of the indicated cells treated with erastin (10 μM, 24 h) or DMSO. Scale bar, 100 μm. HJ and OQ The indicated cells were treated with or without erastin (10 μM) for 24 h, and then L-ROS (H and O), intracellular MDA (I and P), and intracellular GSH (J and Q) were measured. K and R Representative TEM images of the indicated cells treated with 10 μM erastin for 16 h. Red arrows indicate mitochondria. Scale bar, 1 μm. Error bars indicate mean ± SD of triplicate samples. ***P < 0.001; ****P < 0.0001
Fig. 5
Fig. 5
ERO1α exhibits tumor-promoter activities through the upregulation of SLC7A11. AE sgERO1α NTC/T1 null cells were infected with lentiviruses carrying an empty vector (vector) or expression vectors for SLC7A11. FJ ERO1α-overexpressing Tsc2 + / + MEFs were infected with lentivirus harboring SLC7A11 shRNAs (shSLC7A111 and shSLC7A11.2) or a scrambled shRNA (shSc). CCK-8 (A and F) and EdU (B, C, G and H) assays were performed to evaluate cell proliferation. Scale bar, 50 μm. The effect on angiogenesis was determined by tube formation (D and I) and CAM (E and J) assays. Representative images (left panels) and quantifications (right panels). Scale bar, 50 μm. KT sgERO1α NTC/T1 null cells, with or without SLC7A11 re-expression (KO), and ERO1α-overexpressing Tsc2 + / + MEFs, with or without SLC7A11 knockdown (PT), were subcutaneously injected into nude mice for xenograft assays. K and P Pictures of the removed tumors. L and Q The size of xenograft tumors was measured. M and R Tumors were weighed and plotted. N and S The relative MDA levels of the indicated tumors were measured. O and T Representative IHC images for ERO1α, SLC7A11, Ki-67, and CD31 proteins of the indicated xenograft tumors. Scale bar, 40 μm. Error bars indicate mean ± SD of triplicate (if mentioned otherwise) samples. **P < 0.01; ***P < 0.001; ****P < 0.0001
Fig. 6
Fig. 6
ERO1α upregulates SLC7A11 via activation of the IL-6/STAT3 pathway. A Schematic diagram of the screening of co-differentially expressed cytokines upon knockout or knockdown of ERO1α using a cytokines array assay. B and C Cell supernatants from the indicated cells were collected, and IL-6, MIP-1α, and MIG levels were determined using an ELISA. D sgERO1α NTC/T1 null cells were treated with IL-6 (20 ng/ml), MIP-1α (100 ng/ml), or MIG (100 ng/ml) for 24 h. E ERO1α-overexpressing Tsc2 + / + MEFs were transfected with IL-6 siRNAs or control siRNA (siNC) for 48 h. D and E Cell lysates were subjected to immunoblotting with the indicated antibodies (left panels), the expression of SLC7A11 mRNA was detected by qRT–PCR (right panels). F Representative IF showing the localizations of STAT3 in the indicated cells. Scale bar, 20 μm. G IL-6 (20 ng/ml, 12 h) pre-treated sgERO1α NTC/T1 null cells were transfected with STAT3 siRNAs or control siRNA (siNC) for 48 h. H IL-6 (20 ng/ml, 12 h) pre-treated sgERO1α NTC/T1 null cells were treated with different concentrations of S3I-201 for 24 h. I IL-6 siRNA-transduced ERO1α-overexpressing Tsc2 + / + MEFs were transfected with a constitutively activated STAT3 (STAT3C) or its control vector pBabe-puro (pBabe). GI The expression of SLC7A11 was examined by western blotting (left panels) and qRT–PCR (right panels). J Schematic representation of the putative STAT3-binding sites in the promoter of mouse SLC7A11 gene. K HEK 293 T cells were co-transfected with the indicated promoter constructs plus pBabe-STAT3C or empty vector pBabe and the internal control plasmid pRL-TK. The relative luciferase activity was determined 24 h after transfection. L The enrichment of STAT3 in the promoter of SLC7A11 was analyzed by ChIP-PCR assay. M sgERO1α and sgCtrl NTC/T1 null cells were subjected to ChIP analysis with antibodies to p-STAT3 or control rabbit IgG. qRT–PCR was performed to amplify regions surrounding the putative STAT3 binding Site 2 (PBR) and a nonspecific STAT3 binding region (NBR). The data were plotted as the ratio of immunoprecipitated DNA to total input DNA. Error bars indicate mean ± SD of triplicate samples. **P < 0.01; ****P < 0.0001. n.s: no significance
Fig. 7
Fig. 7
The mTORC1/ERO1α/IL-6/STAT3/SLC7A11 signaling pathway exists in human cancer. A and B LIU-LSC-1 cells were infected with lentivirus expressing shRNAs targeting Raptor (shRaptor1 and shRapator2) or a control shRNA (shSc). Cell lysates were subjected to immunoblotting with the indicated antibodies (A), ERO1α and SLC7A11 mRNA levels were detected by qRT–PCR (B). C 12 paired LSCC tissues and the corresponding ANM tissues were subjected to immunoblotting with the indicated antibodies. D Representative IHC images of p-S6, ERO1α, IL-6, p-STAT3, and SLC7A11 staining from the LSCC tissues and ANM tissues. Scale bar, 20 μm. EI LIU-LSC-1 were infected with lentiviruses expressing shRNAs targeting ERO1α (shERO1α1 and shERO1α2) or a non-targeting shRNA (shSc). E The protein and mRNA levels of ERO1α and SLC7A11 were determined by western blotting and qRT–PCR. F and G CCK-8 (F) and colony formation (G) assays were performed to evaluate cell growth. H and I The pro-angiogenic effect of ERO1α was detected by tube formation (H) and CAM assays (I). Representative images (left panels) and quantifications (right panels) are shown. J Cell viability of indicated cells following treatment with erastin for 24 h. K Representative phase-contrast images of indicated cells were treated with erastin (15 μM) in the absence or presence of Lip-1 (1 μM). The corresponding phase contrast images are shown. Scale bar, 100 μm. LN The indicated cells were treated with or without erastin (15 μM) for 24 h, and then intracellular MDA (L), L-ROS (M), and intracellular GSH (N) were measured. OR Tumor images (O), tumor volume (P), and tumor weight (Q) of shERO1α.1 LIU-LSC-1 xenograft tumors (n = 5 mice/group) treated with Lip-1 (10 mg/kg) or vehicle. R The relative MDA levels of the indicated tumors were measured. Error bars indicate mean ± SD of triplicate (if mentioned otherwise) samples. **P < 0.01; ***P < 0.001; ****P < 0.0001
Fig. 8
Fig. 8
The combination of ERO1α inhibition and IKE exerts an effective inhibitory effect on the growth of PDO and PDX models. A Schematic workflow of the generation of LSCC organoids and PDX models. B Representative IHC images of CK13, p63, Ki-67, p-S6, and ERO1α staining from LSCC tissues and organoids. Scale bar, 40 μm. C LSCC organoids were infected with lentiviruses expressing shRNAs targeting ERO1α (shERO1α1) or a non-targeting shRNA (shSc). The level of ERO1α was detected by western blotting. D shERO1α.1 or shSc lentiviruses-infected organoids were treated with IKE (50 μM) or DMSO for 24 h. The cell viability of organoids was determined by Cell-Titer Glo-3D cell viability assay. Left panels: representative phase contrast images. Right panels: quantitation of the data. Scale bar, 50 μm. E and F The expression of p-S6 and ERO1α in the PDX tumor tissues, primary tumor tissues and ANM tissues were analyzed by IHC (E) and western blotting (F). GI Tumor images (G), tumor volume (H), and tumor weight (I) of PDX model tumors treated with ERO1α siRNAs or siNC, together with IKE (40 mg/kg) or vehicle. n = 5 mice per group. J IHC staining of PDX tumor tissues using the indicated antibodies. Scale bar, 40 μm. K MDA assay was used to detected lipid peroxidation levels in randomly selected PDX tumor section. L Body weight of mice. M Schematic illustration of the activated ERO1α/IL-6/STAT3/SLC7A11 pathway is critical for mTORC1-mediated ferroptosis resistance and tumor progression. Error bars indicate mean ± SD of triplicate (if mentioned otherwise) samples. *P < 0.05; **P < 0.01; ***P < 0.001; ****P < 0.0001

Similar articles

Cited by

References

    1. Battaglioni S, Benjamin D, Wälchli M, Maier T, Hall MN. mTOR substrate phosphorylation in growth control. Cell. 2022;185:1814–1836. doi: 10.1016/j.cell.2022.04.013. - DOI - PubMed
    1. Liu GY, Sabatini DM. mTOR at the nexus of nutrition, growth, ageing and disease. Nat Rev Mol Cell Biol. 2020;21:183–203. doi: 10.1038/s41580-019-0199-y. - DOI - PMC - PubMed
    1. Goul C, Peruzzo R, Zoncu R. The molecular basis of nutrient sensing and signalling by mTORC1 in metabolism regulation and disease. Nat Rev Mol Cell Biol. 2023;24:857–875. doi: 10.1038/s41580-023-00641-8. - DOI - PubMed
    1. Valvezan AJ, Manning BD. Molecular logic of mTORC1 signalling as a metabolic rheostat. Nat Metab. 2019;1:321–333. doi: 10.1038/s42255-019-0038-7. - DOI - PubMed
    1. Kim J, Guan KL. mTOR as a central hub of nutrient signalling and cell growth. Nat Cell Biol. 2019;21:63–71. doi: 10.1038/s41556-018-0205-1. - DOI - PubMed