. 2024 Apr 12;21(1):92.
doi: 10.1186/s12974-024-03091-x.

Nigrostriatal degeneration determines dynamics of glial inflammatory and phagocytic activity

Affiliations

Nigrostriatal degeneration determines dynamics of glial inflammatory and phagocytic activity

Leyre Ayerra et al. J Neuroinflammation. .

Abstract

Glial cells are key players in the initiation of innate immunity in neurodegeneration. Upon damage, they switch their basal activation state and acquire new functions in a context and time-dependent manner. Since modulation of neuroinflammation is becoming an interesting approach for the treatment of neurodegenerative diseases, it is crucial to understand the specific contribution of these cells to the inflammatory reaction and to select experimental models that recapitulate what occurs in the human disease. Previously, we have characterized a region-specific activation pattern of CD11b+ cells and astrocytes in the α-synuclein overexpression mouse model of Parkinson´s disease (PD). In this study we hypothesized that the time and the intensity of dopaminergic neuronal death would promote different glial activation states. Dopaminergic degeneration was induced with two administration regimens of the neurotoxin 1-methyl-4-phenyl-1,2,3,6-tetrahydropyridine (MPTP), subacute (sMPTP) and chronic (cMPTP). Our results show that in the sMPTP mouse model, the pro-inflammatory phenotype of striatal CD11b+ cells was counteracted by an anti-inflammatory astrocytic profile. In the midbrain the roles were inverted, CD11b+ cells exhibited an anti-inflammatory profile and astrocytes were pro-inflammatory. The overall response generated resulted in decreased CD4 T cell infiltration in both regions. Chronic MPTP exposure resulted in a mild and prolonged neuronal degeneration that generated a pro-inflammatory response and increased CD4 T cell infiltration in both regions. At the onset of the neurodegenerative process, microglia and astrocytes cooperated in the removal of dopaminergic terminals. With time, only microglia maintained the phagocytic activity. In the ventral midbrain, astrocytes were the main phagocytic mediators at early stages of degeneration while microglia were the major phagocytic cells in the chronic state. In this scenario, we questioned which activation pattern recapitulates better the features of glial activation in PD. Glial activation in the cMPTP mouse model reflects many pathways of their corresponding counterparts in the human brain with advanced PD. Altogether, our results point toward a context-dependent cooperativity of microglia/myeloid cells and astrocytes in response to neuronal damage and the relevance of selecting the right experimental models for the study of neuroinflammation.

Keywords: Microglia; Neurodegeneration; Parkinson´s disease; Phagocytosis.


Conflict of interest statement

The authors declare no competing interests.

Figures
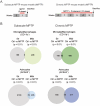
Fig. 1
Fig. 1
Differentially displayed transcripts in CD11b+ and ACSA2+ cells purified from the striatum and the midbrain after subacute or chronic MPTP intoxication. (A) Scheme of the two MPTP intoxication protocols used. In the subacute regimen (sMPTP), mice received 5 consecutive MPTP doses and in the chronic administration (cMPTP) animals received 10 MPTP doses along 5 weeks. Control mice were injected with the MPTP vehicle or MPTP vehicle with probenecid following the same MPTP administration pattern. sMPTP mice were sacrificed 24 h and cMPTP 48 h after the last MPTP injection. CD11b+ and ACSA2+ were purified from the striatum and the ventral midbrain for bulk RNA sequencing. (B) Venn diagrams representing differentially displayed genes (p < 0.01) in sMPTP and cMPTP animals with respect to their corresponding controls. (N = 3 animals/group). Str: striatum; Mdb: ventral midbrain
Fig. 2
Fig. 2
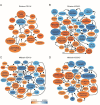
Graphical summary of networks predicted to be altered in glial cells of the sMPTP mice. Ingenuity pathway analysis yielded networks of pathways, upstream regulators and biological functions predicted to be altered (z < 1 or z > 1) and differentially expressed genes (p < 0.01) in: (A) striatal CD11b+, (B) striatal ACSA2+, (C) midbrain CD11b+ and (D) midbrain ACSA2+ cells
Fig. 3
Fig. 3
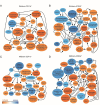
Graphical summary of networks predicted to be altered in glial cells of the cMPTP mice. Ingenuity pathway analysis yielded networks of pathways, upstream regulators and biological functions predicted to be altered (z < 1 or z > 1) and differentially expressed genes (p < 0.01) in: (A) striatal CD11b+, (B) striatal ACSA2+, (C) midbrain CD11b+ and (D) midbrain ACSA2+ cells
Fig. 4
Fig. 4
Phagocytic assessment of Iba1+ cells in sMPTP mice. Animals were sacrificed at 10 days after the first MPTP injection. (A) Motor behavior was evaluated in the rotarod, bar and pole test. (B and C) Representative images of a single plane and the corresponding orthogonal projection of the stack of TH/Iba1 double immunofluorescence in (B) the striatum and (C) the SNpc of control and sMPTP mice. Quantitation of TH+ volume and percentage of TH+ signal in Iba1+ cells. (D) Quantitation of the number of ramified, hypertrophic and bushy Iba1+ cells in the striatum and SNpc from control and sMPTP mice. Data represent the mean ± 95% CI from 7 animals per group. Statistical analysis: (A, B and C) t-test with Welch correction when variances differed significantly, (D) 2-way ANOVA followed by Bonferroni post hoc test. Statistical significance in, (*) cell number, (#) cell morphology. */#p < 0.05, **/##p < 0.01, ***/###p < 0.001. Magnification bars: 10 μm
Fig. 5
Fig. 5
Phagocytic assessment of Iba1+ cells in cMPTP mice. Animals were sacrificed at 5 weeks after the first MPTP injection. (A) Motor behavior was evaluated in the rotarod, bar and pole test. (B and C) Representative images of a single plane and the corresponding orthogonal projection of the stack of TH/Iba1 double immunofluorescence in (B) the striatum and (C) the SNpc of control and cMPTP mice. Quantitation of TH+ volume and percentage of TH+ signal in Iba1+ cells. (D) Quantitation of the number of ramified, hypertrophic and bushy Iba1+ cells in the striatum and SNpc from control and cMPTP mice. Data represent the mean ± 95% CI from 7 animals per group. Statistical analysis: (A, B and C) t-test with Welch correction when variances differed significantly, (D) 2-way ANOVA followed by Bonferroni post hoc test. Statistical significance in (#) cell morphology. #p < 0.05. Magnification bars: 10 μm
Fig. 6
Fig. 6
Phagocytic assessment of Iba1+ cells in ecMPTP mice. Animals were sacrificed at 10 days after the first MPTP injection following the cMPTP intoxication pattern. (A) Motor behavior was evaluated in the rotarod, bar and pole test. (B and C) Representative images of a single plane and the corresponding orthogonal projection of the stack of TH/Iba1 double immunofluorescence in (B) the striatum and (C) the SNpc of control and ecMPTP mice. Quantitation of TH+ volume and percentage of TH+ signal in Iba1+ cells. (D) Quantitation of the number of ramified, hypertrophic and bushy Iba1+ cells in the striatum and SNpc from control and ecMPTP mice. Data represent the mean ± 95% CI from 7 animals per group. Statistical analysis: (A) Mann-Whitney test for the rotarod and bar test, t-test for the pole test; (B and C) t-test, (D) 2-way ANOVA followed by Bonferroni post hoc test. Statistical significance in, (*) cell number, (#) cell morphology. */#p < 0.05, **/##p < 0.01. Magnification bars: 10 μm
Fig. 7
Fig. 7
Phagocytic assessment of astrocytes in MPTP mice. Animals were sacrificed at 10 days (sMPTP and ecMPTP) or at 5 weeks (cMPTP) after the first MPTP injection. (A) Representative images of a single plane and the corresponding orthogonal projection of the stack of TH/GFAP double immunofluorescence in the striatum of sMPTP, ecMPTP and cMPTP mice. Quantitation of GFAP+ volume and percentage of TH+ signal in GFAP+ cells. Dashed line corresponds to the mean of GFAP+ volume in control animals. (B) Representative images of a single plane and the corresponding orthogonal projection of the stack of TH/GFAP double immunofluorescence in the SNpc of sMPTP, ecMPTP and cMPTP mice. Quantitation of GFAP+ volume. Dashed line corresponds to the mean of GFAP+ volume in control animals. Data represent the mean ± 95% CI from 7–8 animals per group. Statistical analysis: (A) One-way ANOVA test. **p < 0.01, ***p < 0.001. Magnification bars: 10 μm
Fig. 8
Fig. 8
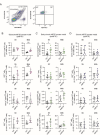
Flow cytometry analysis of CD11b+ cells from the striatum and in the ventral midbrain after MPTP intoxication. (A) Gating strategy for CD11b+ cell subsets differentiated based on the level of CD45 expression, CD11b+CD45low and CD11b+CD45high, and Ki67 expression. The fraction of CD11b+CD45low and CD11b+CD45high cells out of viable cells and frequency of Ki67+ cells in these populations were analyzed in the striatum and midbrain of (B) sMPTP, (C) ecMPTP and (D) cMPTP mice. Data represent the mean ± 95% CI from 6 to 8 animals/group. Statistical analysis: (B-D) t-test for data following a normal distribution and Mann-Whitney test for data not following a normal distribution. *p < 0.05, **p < 0.01
Fig. 9
Fig. 9
Flow cytometry analysis of lymphocyte infiltration in the striatum and in the ventral midbrain after MPTP intoxication. (A) Representative gating strategy to select CD11bCD45high population, and then CD4+ and CD8+ cells in cells suspension prepared from the ventral midbrain. Fraction of CD4+ and CD8+ cells out of viable cells in the striatum and midbrain of (B) sMPTP, (C) ecMPTP and (D) cMPTP mice. Data represent the mean ± 95% CI from 6 animals/group. Statistical analysis: (B-D) t-test for data following a normal distribution with Welch correction when variances differed significantly. Mann-Whitney test for data not following a normal distribution. *p < 0.05
Fig. 10
Fig. 10
Summary of the networks predicted to be altered in human microglia and astrocytes in the midbrain. Differentially displayed genes in human glia obtained from the midbrain of PD patients were subjected to Ingenuity Pathway Analysis (IPA). The graphical summary represents the pathways, upstream regulators and biological functions predicted to be altered (A) in microglia and (B) astrocytes. The results of IPA analyses of human, sMPTP and cMPTP glial cells in the midbrain were subjected to Ingenuity Comparison Analysis to compare the z-scores of upstream regulators, pathways and biological functions in (C) microglia and (D) astrocytes

References

    1. Costello DA, Carney DG, Lynch MA. α-TLR2 antibody attenuates the Aβ-mediated inflammatory response in microglia through enhanced expression of SIGIRR. Brain Behav Immun. 2015;46:70–9. doi: 10.1016/j.bbi.2015.01.005. - DOI - PubMed
    1. Rodgers KR, Lin Y, Langan TJ, Iwakura Y, Chou RC. Innate Immune functions of astrocytes are dependent upon Tumor Necrosis factor-alpha. Sci Rep. 2020;10. - PMC - PubMed
    1. Olson JK, Miller SD. Microglia initiate central nervous system innate and adaptive immune responses through multiple TLRs. J Immunol. 2004;173:3916–24. doi: 10.4049/jimmunol.173.6.3916. - DOI - PubMed
    1. Rivest S. Regulation of innate immune responses in the brain. Nat Rev Immunol. 2009;9:429–39. doi: 10.1038/nri2565. - DOI - PubMed
    1. Greenhalgh AD, David S, Bennett FC. Immune cell regulation of glia during CNS injury and disease. Nat Rev Neurosci. 2020;21:139–52. doi: 10.1038/s41583-020-0263-9. - DOI - PubMed