Deregulation in adult IgA vasculitis skin as the basis for the discovery of novel serum biomarkers
- PMID: 38610060
- PMCID: PMC11010360
- DOI: 10.1186/s13075-024-03317-6
Deregulation in adult IgA vasculitis skin as the basis for the discovery of novel serum biomarkers
Abstract
Introduction: Immunoglobulin A vasculitis (IgAV) in adults has a variable disease course, with patients often developing gastrointestinal and renal involvement and thus contributing to higher mortality. Due to understudied molecular mechanisms in IgAV currently used biomarkers for IgAV visceral involvement are largely lacking. Our aim was to search for potential serum biomarkers based on the skin transcriptomic signature.
Methods: RNA sequencing analysis was conducted on skin biopsies collected from 6 treatment-naïve patients (3 skin only and 3 renal involvement) and 3 healthy controls (HC) to get insight into deregulated processes at the transcriptomic level. 15 analytes were selected and measured based on the transcriptome analysis (adiponectin, lipopolysaccharide binding protein (LBP), matrix metalloproteinase-1 (MMP1), C-C motif chemokine ligand (CCL) 19, kallikrein-5, CCL3, leptin, C-X-C motif chemokine ligand (CXCL) 5, osteopontin, interleukin (IL)-15, CXCL10, angiopoietin-like 4 (ANGPTL4), SERPIN A12/vaspin, IL-18 and fatty acid-binding protein 4 (FABP4)) in sera of 59 IgAV and 22 HC. Machine learning was used to assess the ability of the analytes to predict IgAV and its organ involvement.
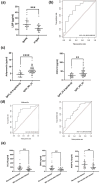
Results: Based on the gene expression levels in the skin, we were able to differentiate between IgAV patients and HC using principal component analysis (PCA) and a sample-to-sample distance matrix. Differential expression analysis revealed 49 differentially expressed genes (DEGs) in all IgAV patient's vs. HC. Patients with renal involvement had more DEGs than patients with skin involvement only (507 vs. 46 DEGs) as compared to HC, suggesting different skin signatures. Major dysregulated processes in patients with renal involvement were lipid metabolism, acute inflammatory response, and extracellular matrix (ECM)-related processes. 11 of 15 analytes selected based on affected processes in IgAV skin (osteopontin, LBP, ANGPTL4, IL-15, FABP4, CCL19, kallikrein-5, CCL3, leptin, IL-18 and MMP1) were significantly higher (p-adj < 0.05) in IgAV serum as compared to HC. Prediction models utilizing measured analytes showed high potential for predicting adult IgAV.
Conclusion: Skin transcriptomic data revealed deregulations in lipid metabolism and acute inflammatory response, reflected also in serum analyte measurements. LBP, among others, could serve as a potential biomarker of renal complications, while adiponectin and CXCL10 could indicate gastrointestinal involvement.
Keywords: Acute inflammatory response; Adults; IgA vasculitis; Lipid metabolism; Machine learning; RNA sequencing; Serum biomarkers.
© 2024. The Author(s).
Conflict of interest statement
The authors declare no competing interests.
Figures


Similar articles
-
Exhausted natural killer cells in adult IgA vasculitis.Arthritis Res Ther. 2025 Apr 23;27(1):95. doi: 10.1186/s13075-025-03559-y. Arthritis Res Ther. 2025. PMID: 40269956 Free PMC article.
-
Haptoglobin as a novel predictor of visceral involvement and relapse in adult IgAV patients.Clin Rheumatol. 2025 Apr;44(4):1665-1673. doi: 10.1007/s10067-025-07363-6. Epub 2025 Feb 14. Clin Rheumatol. 2025. PMID: 39953336 Free PMC article.
-
Blood soluble CD89-IgA complex may be a potential biomarker for predicting multi-organ involvement, especially renal involvement in children with immunoglobulin A vasculitis.Int Immunopharmacol. 2024 Dec 5;142(Pt A):113063. doi: 10.1016/j.intimp.2024.113063. Epub 2024 Sep 5. Int Immunopharmacol. 2024. PMID: 39241523
-
IgA vasculitis.Semin Immunopathol. 2021 Oct;43(5):729-738. doi: 10.1007/s00281-021-00874-9. Epub 2021 Jun 25. Semin Immunopathol. 2021. PMID: 34170395 Review.
-
A systematic review of urine biomarkers in children with IgA vasculitis nephritis.Pediatr Nephrol. 2021 Oct;36(10):3033-3044. doi: 10.1007/s00467-021-05107-7. Epub 2021 May 15. Pediatr Nephrol. 2021. PMID: 33993342 Free PMC article.
Cited by
-
Exhausted natural killer cells in adult IgA vasculitis.Arthritis Res Ther. 2025 Apr 23;27(1):95. doi: 10.1186/s13075-025-03559-y. Arthritis Res Ther. 2025. PMID: 40269956 Free PMC article.
-
Abdominal imaging and endoscopic characteristics of adult abdominal IgA vasculitis: a multicenter retrospective study.Ann Med. 2024 Dec;56(1):2408467. doi: 10.1080/07853890.2024.2408467. Epub 2024 Sep 26. Ann Med. 2024. PMID: 39324401 Free PMC article.
-
Construction and diagnostic efficacy assessment of the urinary exosomal miRNA-mRNA network in children with IgA vasculitis nephritis.FASEB J. 2025 Apr 15;39(7):e70492. doi: 10.1096/fj.202403111R. FASEB J. 2025. PMID: 40166907 Free PMC article.
-
Haptoglobin as a novel predictor of visceral involvement and relapse in adult IgAV patients.Clin Rheumatol. 2025 Apr;44(4):1665-1673. doi: 10.1007/s10067-025-07363-6. Epub 2025 Feb 14. Clin Rheumatol. 2025. PMID: 39953336 Free PMC article.
References
-
- Jurčić VBL, Matjašič A, Sedej I, Dolinar A, Grubelnik G, Hauptman N, Pižem J, Jevšinek-Skok D, Hočevar A, Ravnik-Glavač M, Glavač D. Association between histopathological changes and expression of selected microRNAs in skin of adult patients with IgA vasculitis. Histopathology. 2019;75(5):683–93. doi: 10.1111/his.13927. - DOI - PubMed
MeSH terms
Substances
Grants and funding
LinkOut - more resources
Full Text Sources
Research Materials
Miscellaneous

