Review
. 2024 Mar 23;13(7):1854.
doi: 10.3390/jcm13071854.

Autonomic Function in Obese Children and Adolescents: Systematic Review and Meta-Analysis

Affiliations
Review

Autonomic Function in Obese Children and Adolescents: Systematic Review and Meta-Analysis

Georgios E Papadopoulos et al. J Clin Med. .

Abstract

Background: Obesity is invariably accompanied by autonomic dysfunction, although data in pediatric populations are conflicting. Methods: We conducted a systematic review and meta-analysis of 12 studies (totaling 1102 participants) comparing obese and normal-weight subjects (5-18 years of age), defined as body mass index >95th or <85th percentile, respectively. Using a random-effects model, we report the standardized mean differences (SMD) of sympathetic and vagal indices of heart rate variability. Results: Autonomic dysfunction was present in the obesity group, based on the average SMD in the standard deviation of sinus intervals (at -0.5340), and on the ratio of low (LF)- to high (HF)-frequency spectra (at 0.5735). There was no difference in sympathetic activity, but the heterogeneity among the relevant studies weakens this result. SMD in HF (at 0.5876), in the root mean square of successive differences between intervals (at -0.6333), and in the number of times successive intervals exceeded 50 ms divided by the total number of intervals (at -0.5867) indicated lower vagal activity in the obesity group. Conclusions: Autonomic dysfunction is present in obese children and adolescents, attributed to lower vagal activity. Further studies are needed in various pediatric cohorts, placing emphasis on sympathetic activity.

Keywords: adolescents; autonomic nervous system; children; heart rate variability; obesity; sympathetic activity; vagal activity.


Conflict of interest statement

The authors declare no conflicts of interest.

Figures
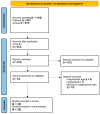
Figure 1
Figure 1
PRISMA flow diagram; k stands for the number of studies.
Figure 2
Figure 2
Funnel plots of all variables. Note the heterogeneity, particularly in the low-frequency (LF) spectrum and in the ratio of LF to high-frequency (HF) spectra after frequency-domain analysis. Abbreviations: SDNN: standard deviation of the inter-beat interval between sinus beats, RMSSD: root mean square of successive differences between normal intervals, PNN50: number of times successive intervals exceed 50 ms, divided by the total number of intervals. Red dots depict reports outlying the funnel.
Figure 3
Figure 3
Forest plot of the standard deviation of the inter-beat interval between sinus beats (SDNN), depicting sympatho-vagal balance. The standardized mean difference (SMD) indicated the tilt of autonomic balance towards sympathetic prevalence in the obesity group. Included studies [19,20,21,22,23,24,25,26,27,28,29,30].
Figure 4
Figure 4
Forest plot of the ratio of low-frequency (LF) to high-frequency (HF) spectra after frequency-domain analysis. The standardized mean difference (SMD) indicated the tilt of autonomic balance towards vagal prevalence in the normal-weight group. Included studies [19,20,21,22,23,24,25,26,27,28,29,30].
Figure 5
Figure 5
Forest plot of the low-frequency (LF) spectrum after frequency-domain analysis, depicting sympathetic activity. The standardized mean difference (SMD) failed to show a difference between the groups. Included studies [19,20,23,24,25,27,29].
Figure 6
Figure 6
Forest plot of the high-frequency (HF) spectrum after frequency-domain analysis, depicting vagal activity. The standardized mean difference (SMD) indicated lower vagal activity in the obesity group. Included studies [19,20,23,24,25,27,29].
Figure 7
Figure 7
Forest plot of the root mean square of successive differences between normal heartbeats (RMSSD), depicting vagal activity. The standardized mean difference (SMD) indicated lower vagal activity in the obesity group. Included studies [19,20,22,23,24,25,26,27,28,29,30].
Figure 8
Figure 8
Forest plot of the number of times successive intervals exceeded 50 ms, divided by the total number of intervals (PNN50), depicting vagal activity. The standardized mean difference (SMD) indicated lower vagal activity in the obesity group. Included studies [19,20,23,24,25,26,27,29,30].

References

    1. Katta N., Loethen T., Lavie C.J., Alpert M.A. Obesity and coronary heart disease: Epidemiology, pathology, and coronary artery imaging. Curr. Probl. Cardiol. 2021;46:100655. doi: 10.1016/j.cpcardiol.2020.100655. - DOI - PubMed
    1. Peterson H.R., Rothschild M., Weinberg C.R., Fell R.D., McLeish K.R., Pfeifer M.A. Body fat and the activity of the autonomic nervous system. N. Engl. J. Med. 1988;318:1077–1083. doi: 10.1056/NEJM198804283181701. - DOI - PubMed
    1. Chen G.Y., Hsiao T.J., Lo H.M., Kuo C.D. Abdominal obesity is associated with autonomic nervous derangement in healthy Asian obese subjects. Clin. Nutr. 2008;27:212–217. doi: 10.1016/j.clnu.2007.11.004. - DOI - PubMed
    1. Costa J., Moreira A., Moreira P., Delgado L., Silva D. Effects of weight changes in the autonomic nervous system: A systematic review and meta-analysis. Clin. Nutr. 2019;38:110–126. doi: 10.1016/j.clnu.2018.01.006. - DOI - PubMed
    1. Wang Y., Anesi J., Maier M.C., Myers M.A., Oqueli E., Sobey C.G., Drummond G.R., Denton K.M. Sympathetic Nervous System and Atherosclerosis. Int. J. Mol. Sci. 2023;24:13132. doi: 10.3390/ijms241713132. - DOI - PMC - PubMed