. 2024 Mar 22;16(7):1256.
doi: 10.3390/cancers16071256.

EGFR-Targeted Antibody-Drug Conjugate to Different Aminobisphosphonates: Direct and Indirect Antitumor Effects on Colorectal Carcinoma Cells

Affiliations

EGFR-Targeted Antibody-Drug Conjugate to Different Aminobisphosphonates: Direct and Indirect Antitumor Effects on Colorectal Carcinoma Cells

Leila Pisheh et al. Cancers (Basel). .

Abstract

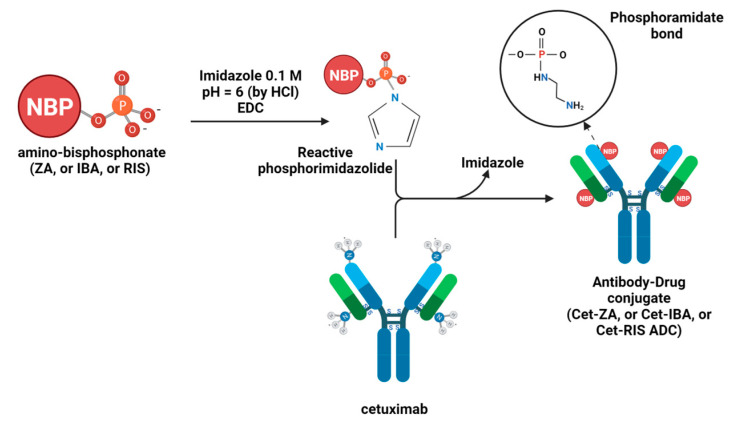
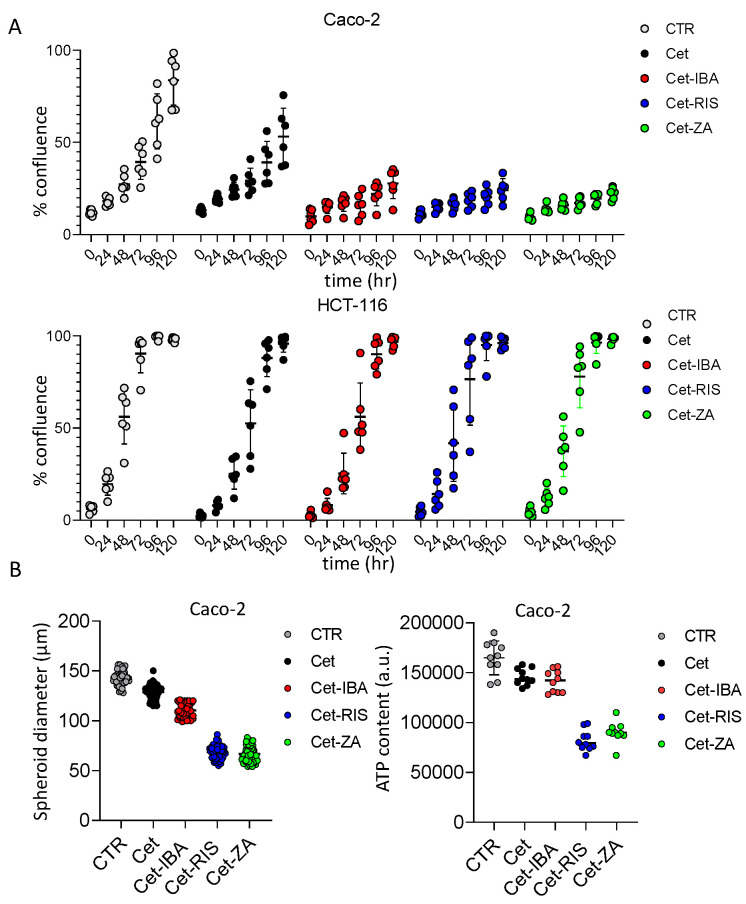
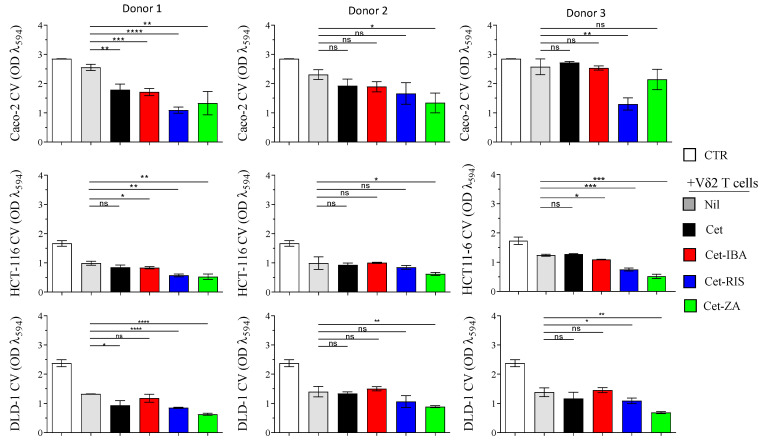
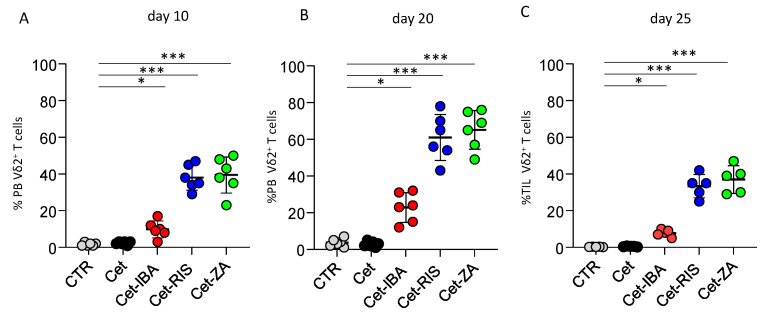
Antibody--drug conjugates (ADCs) are a promising delivery system that involves linking a monoclonal antibody (mAb) to a specific drug, such as a cytotoxic agent, to target tumor cells. This new class of antitumor therapy acts as a "biological missile" that can destroy tumor cells while increasing the therapeutic index and decreasing toxicity. One of the most critical factors in ADC design is selecting a target antigen that is highly expressed on the surface of cancer cells. In this study, we conjugated Cetuximab (Cet), a monoclonal antibody that targets the epidermal growth factor receptor (EGFR), to aminobisphosphonates (N-BPs) such as ibandronate (IBA) or risedronate (RIS) or zoledronate (ZA). Cetuximab is administered to patients with metastatic colorectal carcinoma (mCRC) with a wild-type (WT) EGFR transduction pathway. Also, it is well established that N-BPs can trigger the antitumor activity of Vδ2 T cells in both in vitro and in vivo experimental models. The resulting ADCs were added in co-culture to assess the effect on CRC cell line proliferation and sensitivity to Vδ2 T antitumor lymphocytes in comparison with the native antibody. These assays have been performed both in conventional and 3D spheroid cultures. We found that all three ADCs can increase the inhibitory effect on cell proliferation of the WT-EGFR cell line Caco-2 while only Cet-RIS and Cet-ZA can increase the cytotoxicity mediated by Vδ2 T cells against both WT and EGFR-mutated CRC cell lines (Caco-2, DLD-1, and HCT-116). Also, the ADCs can trigger the cell proliferation of Vδ2 T cells present in peripheral blood and tumor specimens. Our findings indicate that anti-EGFR antibodies bound to N-BPs can improve the antitumor effects of the native antibody possibly increasing the therapeutic effect.

Keywords: aminobisphosphonate; antibody–drug conjugate; colorectal cancer; epidermal growth factor receptor; gamma delta T lymphocyte.


Conflict of interest statement

The authors declare no conflicts of interest. The funders had no role in the design of the study; in the collection, analyses, or interpretation of data; in the writing of the manuscript; or in the decision to publish the results.

Figures

Figure 1
Figure 1
Schematic representation of the chemical reactions to synthesize Cet-IBA, Cet-RIS, or Cet-ZA ADCs [30].
Figure 2
Figure 2
Matrix-assisted laser desorption ionization (MALDI) mass spectra of Cetuximab (top), Cet-IBA, Cet-RIS, and Cet-ZA ADCs (bottom) in order. In each panel, the molecular weight (MW) of singlet, doublet, and triplet ionized molecules are shown. The differences in MW are the evidence of the covalent conjugation of each N-BPs to the antibody Cet. The MALDI spectrum for native Cet is shown in the first panel.
Figure 3
Figure 3
ADCs’ characterization. ADCs’ titration and reactivity with CRC cell lines. (A) The CRC cell lines DLD-1 and HCT-116 were incubated with serial dilutions (0.02–200 µg/mL/106 cells) of Cet (black), Cet-IBA (red), Cet-RIS (blue), or Cet-ZA (green) followed by the APC-labeled anti-human Ig antiserum. Samples were analyzed by flow cytometry using CytExpert software 2.4. The data are expressed as the ratio of mean fluorescent intensity (ratio between the MFI of either Cet or the indicated ADC and the negative control). (B) FACS histograms: reactivity of either Cet (black) or the indicated ADC (2 µg/mL/106; Cet-IBA red, Cet-RIS blue, Cet-ZA green) with the CRC cell lines Caco-2, NCI-H716, RKO, or SW-620. Data are shown as log far red fluorescence intensity vs. cell number. In each FACS histogram, in gray color is shown the negative control (CTR, cells stained with second reagent only).
Figure 4
Figure 4
ADCs’ internalization and localization. (A) The HCT-116 cell line was seeded in imaging-specific 96-well flat-bottomed plates for 24 h to allow adherence. Then, the cells were incubated with the native Cet antibody (upper images) or ADC (lower images, Cet-IBA, Cet-RIS, or Cet-ZA) for an additional 24 h. Afterwards, cells were fixed and incubated with the anti-LAMP-1 antibody followed by staining with Alexa Fluor 488 (green color, second line of images), Alexa Fluor 647 (red color, anti-human to detect EGFR antibody, third line of images) secondary antibodies, and Sytox Orange probe to identify nuclei (blue color, first line of images). Merged images represent the overlay of the three stainings. Each image was taken at the confocal plane after scanning in sequence mode, to avoid cross-talk among the different wavelength emissions. The yellow region represents the co-localization area for the indicated markers. Bar: 100 µm, 200× magnification. (B) The HCT-116 cell line was seeded as in panel A and incubated with Cet-RIS for 24 h. Then cells were fixed and incubated with the anti-EEA-1 antibody. The yellow region, evidenced by the white arrows, indicates the overlapping area for EGFR and EEA-1. Bar: 100 µm, 200× magnification. Enlargement 10× of merge image.
Figure 5
Figure 5
Effect of ADC on CRC cell line proliferation. (A) The indicated cell lines (Caco-2 and HCT-116) were seeded in flat-bottomed plates without (CTR, no antibody) or with 2 µg/mL of the indicated antibodies. Cell proliferation was assessed as the percentage of confluency by taking images of culture wells at the indicated time points (0, 24, 48, 72, 96, 120 h). Each point corresponds to six replicates for each experimental condition. The percentage of confluency was calculated by CellStudio 6.2 software, associated with the CellCyte XTM plate scanner. The results are expressed as mean ± SD of confluency. (B) left panel: the spheroid diameter was measured in 50 spheroids obtained with AggreWell-400 plates after 5 days of culture without (CTR) or with 2 µg/mL of the indicated antibodies. (B) right panel: the ATP content of spheroids cultured as in left panel. Results are shown as ATP content expressed in arbitrary units.
Figure 6
Figure 6
Triggering of Vδ2+T cell cytotoxicity with either ADCs or native Cet antibody. Spheroids of Caco-2, DLD-1, or HCT-116 were co-cultured with Vδ2 T cells, either in the presence of 2 µg/mL Cet, Cet-ZA, Cet-IBA, or Cet-RIS, or without treatment, at the effector:target ratio of 3:1. After 48 h, the cell cultures were transferred to adhesion-permissive plates, allowed to adhere for 24 h, and stained with crystal violet to quantify surviving/adherent cells. The optical density (OD) of the eluted stain was evaluated by a VICTORX5 multilabel plate reader at 594 nm. CTR: OD of cultured tumor cells only. Bars: mean ± SD of each group of measures. * p > 0.05; ** p > 0.01; *** p > 0.001 **** p > 0.0001, n.s. Not significant.
Figure 7
Figure 7
Induction of Vδ2 T cell expansion. Highly purified T cells, incubated with LS-180 CRC cells from the onset of assay with medium (CTR), or the indicated antibodies, were assessed for the presence of Vδ2+T cells by indirect immunofluorescence. Vδ2 T expression was determined at day 10 (A) and 20 (B) by indirect immunofluorescence flow cytometry, using the anti-Vδ2 antibody, clone γδ123R3, and plotted by GraphPad Prism software. (C) Cell suspensions from 5 CRC mucosa specimens were incubated as in (A) with the indicated antibodies and IL-2 was added after 24 h of culture. The Vδ2 T cell percentages were determined at the onset of the culture (CTR) and on day 25 of incubation with the different antibodies. Bars: mean ± SD of each group of measures. * p > 0.01; *** p > 0.001.

References

    1. Fuentes-Antras J., Genta S., Vijenthira A., Siu L.L. Antibody-drug conjugates: In search of partners of choice. Trends Cancer. 2023;9:339–354. doi: 10.1016/j.trecan.2023.01.003. - DOI - PubMed
    1. Glatt D.M., Beckford Vera D.R., Prabhu S.S., Mumper R.J., Luft J.C., Benhabbour S.R., Parrott M.C. Synthesis and Characterization of Cetuximab-Docetaxel and Panitumumab-Docetaxel Antibody-Drug Conjugates for EGFR-Overexpressing Cancer Therapy. Mol. Pharm. 2018;15:5089–5102. doi: 10.1021/acs.molpharmaceut.8b00672. - DOI - PubMed
    1. Beck A., Goetsch L., Dumontet C., Corvaia N. Strategies and challenges for the next generation of antibody-drug conjugates. Nat. Rev. Drug Discov. 2017;16:315–337. doi: 10.1038/nrd.2016.268. - DOI - PubMed
    1. Zhang K., Ma Y., Guo Y., Sun T., Wu J., Pangeni R.P., Lin M., Li W., Horne D., Raz D.J. Cetuximab-Triptolide Conjugate Suppresses the Growth of EGFR-Overexpressing Lung Cancers through Targeting RNA Polymerase II. Mol. Ther. Oncolytics. 2020;18:304–316. doi: 10.1016/j.omto.2020.07.001. - DOI - PMC - PubMed
    1. Shastry M., Jacob S., Rugo H.S., Hamilton E. Antibody-drug conjugates targeting TROP-2: Clinical development in metastatic breast cancer. Breast. 2022;66:169–177. doi: 10.1016/j.breast.2022.10.007. - DOI - PMC - PubMed