. 2024 Mar 29;16(7):936.
doi: 10.3390/polym16070936.

Investigation of Silk Fibroin/Poly(Acrylic Acid) Interactions in Aqueous Solution

Affiliations

Investigation of Silk Fibroin/Poly(Acrylic Acid) Interactions in Aqueous Solution

Jelena Škrbić et al. Polymers (Basel). .

Abstract

Silk fibroin (SF) is a protein with many outstanding properties (superior biocompatibility, mechanical strength, etc.) and is often used in many advanced applications (epidermal sensors, tissue engineering, etc.). The properties of SF-based biomaterials may additionally be tuned by SF interactions with other (bio)polymers. Being a weak amphoteric polyelectrolyte, SF may form polyelectrolyte complexes (PECs) with other polyelectrolytes of opposite charge, such as poly(acrylic acid) (PAA). PAA is a widely used, biocompatible, synthetic polyanion. Here, we investigate PEC formation between SF and PAA of two different molecular weights (MWs), low and high, using various techniques (turbidimetry, zeta potential measurements, capillary viscometry, and tensiometry). The colloidal properties of SF isolated from Bombyx mori and of PAAs (MW, overlap concentration, the influence of pH on zeta potential, adsorption at air/water interface) were determined to identify conditions for the SF-PAA electrostatic interaction. It was shown that SF-PAA PEC formation takes place at different SF:PAA ratios, at pH 3, for both high and low MW PAA. SF-PAA PEC's properties (phase separation, charge, and surface activity) are influenced by the SF:PAA mass ratio and/or the MW of PAA. The findings on the interactions contribute to the future development of SP-PAA PEC-based films and bioadhesives with tailored properties.

Keywords: complex coacervation; poly(acrylic acid); polyelectrolyte complex (PEC); polymer/polymer interaction; silk fibroin.


Conflict of interest statement

The authors declare no conflicts of interest.

Figures
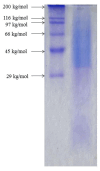
Figure 1
Figure 1
Sodium dodecyl sulfate–polyacrylamide gel electrophoresis (SDS-PAGE) for standard protein markers (lane 1) and for 2% (w/v) SF solution (line 2).
Figure 2
Figure 2
The double extrapolation method determination of intrinsic viscosity for (A) the low MW PAA and (B) the high MW PAA, both in 2 M NaOH solution.
Figure 3
Figure 3
Photograph of 1.0% (w/v) SF solutions at different pHs.
Figure 4
Figure 4
Influence of pH on turbidity of 1.0% (w/v) SF solutions.
Figure 5
Figure 5
Influence of pH value on zeta potential of 0.1% (w/v) SF and PAA aqueous solution.
Figure 6
Figure 6
Titration curve of 0.1% (w/v) SF solution titrated with 0.01 M HCl, obtained at room temperature.
Figure 7
Figure 7
Photograph of 1.0% (w/v) SF/low MW PAA mixtures at different SF:PAA mass ratios (shown as PAA%), (A) 3 min after preparation and (B) 24 h after preparation.
Figure 8
Figure 8
Turbidity of 1.0% (w/v) SF/low MW PAA mixtures at different SF:PAA mass ratios (shown as PAA%), at pH 3, 24 h after mixing.
Figure 9
Figure 9
Photograph of 0.1% (w/v) SF/high MW PAA mixtures at different SF:PAA mass ratios (shown as PAA%), (A) 3 min after preparation and (B) 24 h after preparation.
Figure 10
Figure 10
Turbidity of 0.1% (w/v) SF/high MW PAA mixtures at different SF:PAA mass ratios (shown as PAA%), at pH 3, 24 h after mixing.
Figure 11
Figure 11
Zeta potential of SF-PAA mixtures at different SF:PAA mass ratios (shown as PAA%), at pH 3, 24 h after mixing: (A) 1.0% (w/v) SF/low MW PAA mixtures; (B) 0.1% (w/v) SF/high MW PAA mixtures.
Figure 12
Figure 12
(A) Influence of PAA concentration on specific viscosity of PAA solution and SF-PAA mixture with different SF:PAA mass ratios (100% PAA in mixture is at 0.5 g/100 mL PAA), both at pH 3 and 24 h after preparation. (B) Influence of SF concentration on specific viscosity of SF solution and SF-PAA mixture with different SF:PAA mass ratios (100% SF in mixture is at 0.5 g/100 mL SF), both at pH 3 and 24 h after preparation.
Figure 13
Figure 13
Influence of SF concentration on surface tension of SF solutions and surface tension of SF/high MW PAA mixtures (0.05% (w/v) PAA and 0.01–2.00% (w/v) SF), at pH 3.

References

    1. Gholipourmalekabadi M., Sapru S., Samadikuchaksaraei A., Reis R.L., Kaplan D.L., Kundu S.C. Silk fibroin for skin injury repair: Where do things stand? Adv. Drug Deliv. Rev. 2020;153:28–53. doi: 10.1016/j.addr.2019.09.003. - DOI - PubMed
    1. Patel M., Dubey D.K., Singh S.P. Phenomenological models of Bombyx mori silk fibroin and their mechanical behavior using molecular dynamics simulations. Mater. Sci. Eng. C. 2020;108:110414–110434. doi: 10.1016/j.msec.2019.110414. - DOI - PubMed
    1. Partlow B.P., Tabatabai A.P., Leisk G.G., Cebe P., Blair D.L., Kaplan D.L. Silk Fibroin Degradation Related to Rheological and Mechanical Properties. Macromol. Biosci. 2016;16:666–675. doi: 10.1002/mabi.201500370. - DOI - PubMed
    1. Allardyce B.J., Rajkhowa R., Dilley R.J., Atlas M.D., Kaur J., Wang X. The impact of degumming conditions on the properties of silk films for biomedical applications. Text. Res. J. 2016;86:275–287. doi: 10.1177/0040517515586166. - DOI
    1. Bucciarelli A., Greco G., Corridori I., Pugno N.M., Motta A. A design of experiment rational optimization of the degumming process and its impact on the silk fibroin properties. ACS Biomater. Sci. Eng. 2021;7:1374–1393. doi: 10.1021/acsbiomaterials.0c01657. - DOI - PubMed

LinkOut - more resources