

Distinct Changes in Metabolic Profile and Sensory Quality with Different Varieties of Chrysanthemum (Juhua) Tea Measured by LC-MS-Based Untargeted Metabolomics and Electronic Tongue
- PMID: 38611384
- PMCID: PMC11011348
- DOI: 10.3390/foods13071080
Distinct Changes in Metabolic Profile and Sensory Quality with Different Varieties of Chrysanthemum (Juhua) Tea Measured by LC-MS-Based Untargeted Metabolomics and Electronic Tongue
Abstract
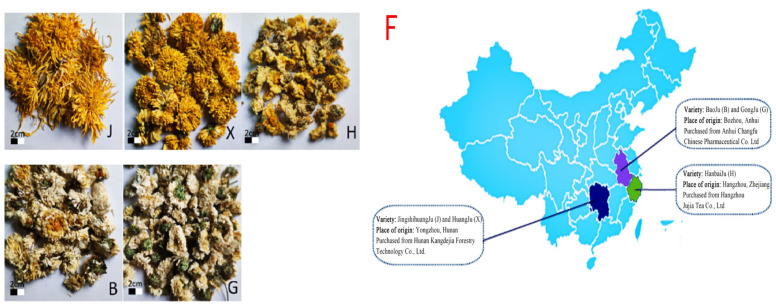
Chrysanthemum tea, a typical health tea with the same origin as medicine and food, is famous for its unique health benefits and flavor. The taste and sensory quality of chrysanthemum (Juhua) tea are mainly determined by secondary metabolites. Therefore, the present research adopted untargeted metabolomics combined with an electronic tongue system to analyze the correlation between the metabolite profiles and taste characteristics of different varieties of chrysanthemum tea. The results of sensory evaluation showed that there were significant differences in the sensory qualities of five different varieties of chrysanthemum tea, especially bitterness and astringency. The results of principal component analysis (PCA) indicated that there were significant metabolic differences among the five chrysanthemum teas. A total of 1775 metabolites were identified by using untargeted metabolomics based on UPLC-Q-TOF/MS analysis. According to the variable importance in projection (VIP) values of the orthogonal projections to latent structures discriminant analysis (OPLS-DA), 143 VIP metabolites were found to be responsible for metabolic changes between Huangju and Jinsi Huangju tea; among them, 13 metabolites were identified as the key metabolites of the differences in sensory quality between them. Kaempferol, luteolin, genistein, and some quinic acid derivatives were correlated with the "astringency" attributes. In contrast, l-(-)-3 phenyllactic acid and L-malic acid were found to be responsible for the "bitterness" and "umami" attributes in chrysanthemum tea. Kyoto Encyclopedia of Genes and Genomes pathway enrichment analysis showed that the flavonoid and flavonol biosynthesis pathways had important effects on the sensory quality of chrysanthemum tea. These findings provide the theoretical basis for understanding the characteristic metabolites that contribute to the distinctive sensory qualities of chrysanthemum tea.
Keywords: LC-MS; chrysanthemum (Juhua); electronic tongue; metabolomics; sensory quality; tea.
Conflict of interest statement
The authors declare no conflicts of interest.
Figures


Similar articles
-
Impact of the long-term storage on flavor quality of Liupao tea using sensory evaluation combined with metabolomics analysis.Food Res Int. 2024 Dec;198:115386. doi: 10.1016/j.foodres.2024.115386. Epub 2024 Nov 16. Food Res Int. 2024. PMID: 39643349
-
UPLC-Q-TOF/MS-based untargeted metabolomics coupled with chemometrics approach for Tieguanyin tea with seasonal and year variations.Food Chem. 2019 Jun 15;283:73-82. doi: 10.1016/j.foodchem.2019.01.050. Epub 2019 Jan 15. Food Chem. 2019. PMID: 30722928
-
Non-Targeted Metabolomics Analysis Revealed the Characteristic Non-Volatile and Volatile Metabolites in the Rougui Wuyi Rock Tea (Camellia sinensis) from Different Culturing Regions.Foods. 2022 Jun 9;11(12):1694. doi: 10.3390/foods11121694. Foods. 2022. PMID: 35741892 Free PMC article.
-
Exploring the effect of different tea varieties on the quality of Sichuan Congou black tea based on metabolomic analysis and sensory science.Front Nutr. 2025 May 9;12:1587413. doi: 10.3389/fnut.2025.1587413. eCollection 2025. Front Nutr. 2025. PMID: 40416389 Free PMC article.
-
The flower head of Chrysanthemum morifolium Ramat. (Juhua): A paradigm of flowers serving as Chinese dietary herbal medicine.J Ethnopharmacol. 2020 Oct 28;261:113043. doi: 10.1016/j.jep.2020.113043. Epub 2020 Jun 25. J Ethnopharmacol. 2020. PMID: 32593689 Review.
Cited by
-
Differences in the Determination of Volatile Organic Compounds between Chrysanthemum morifolium Ramat. and Chrysanthemum indicum L. (Wild Chrysanthemum) by HS-GC-IMS.Molecules. 2024 Sep 27;29(19):4609. doi: 10.3390/molecules29194609. Molecules. 2024. PMID: 39407539 Free PMC article.
-
The Relationship Between Computerized Face and Tongue Image Segmentation and Metabolic Parameters in Patients with Type 2 Diabetes Based on Machine Learning.Diabetes Metab Syndr Obes. 2024 Oct 29;17:4049-4068. doi: 10.2147/DMSO.S491897. eCollection 2024. Diabetes Metab Syndr Obes. 2024. PMID: 39492959 Free PMC article.
-
Study on the Mechanism and Dose-Effect Relationship of Flavonoids in Different Extracts of Radix Hedysari Against Gastrointestinal Injury Induced by Chemotherapy.Pharmaceuticals (Basel). 2025 Jul 20;18(7):1072. doi: 10.3390/ph18071072. Pharmaceuticals (Basel). 2025. PMID: 40732358 Free PMC article.
-
Metabolite Profiling and Identification of Sweet/Bitter Taste Compounds in the Growth of Cyclocarya Paliurus Leaves Using Multiplatform Metabolomics.Foods. 2024 Sep 27;13(19):3089. doi: 10.3390/foods13193089. Foods. 2024. PMID: 39410123 Free PMC article.
-
Taste characteristics and symbolic metabolites of Rougui tea with different grades in China.Food Chem X. 2025 Mar 21;27:102405. doi: 10.1016/j.fochx.2025.102405. eCollection 2025 Apr. Food Chem X. 2025. PMID: 40213328 Free PMC article.
References
-
- Xiang-Wei C., Dan-Dan W., Dong-Jie C., Hui Y., Xiao-Dong S., Wen-Bin Z., Jin-Ao D. Historical Origin and Development of Medicinal and Tea Chrysanthemum morifolium Resources. Mod. Chin. Med. 2019;1:116–123. doi: 10.13313/j.issn.1673-4890.20181224005. - DOI
Grants and funding
- 2021GK5087/Hunan Province Enterprise Science and Technology Commissioner Plan(2021-2022)
- 2023JJ30445/Hunan Natural Science Foundation Program
- 22B0378/Hunan Provincial Department of Education Outstanding Youth Project
- 22JB2053/Hunan University of Chinese Medicine "double first-class" Construction Discipline "open ranking" Program
- 2022ZYT029/The Central Government Guides Local Funds for Science and Technology Development Program
LinkOut - more resources
Full Text Sources
