. 2024 Mar 29;13(7):982.
doi: 10.3390/plants13070982.

Transcriptome-Wide N6-Methyladenosine (m6A) Methylation Analyses in a Compatible Wheat- Puccinia striiformis f. sp. tritici Interaction

Affiliations

Transcriptome-Wide N6-Methyladenosine (m6A) Methylation Analyses in a Compatible Wheat- Puccinia striiformis f. sp. tritici Interaction

Elif Naz Cerav et al. Plants (Basel). .

Abstract

N6-methyladenosine (m6A) is a prevalent internal modification in eukaryotic mRNA, tRNA, miRNA, and long non-coding RNA. It is also known for its role in plant responses to biotic and abiotic stresses. However, a comprehensive m6A transcriptome-wide map for Puccinia striiformis f. sp. tritici (Pst) infections in wheat (Triticum aestivum) is currently unavailable. Our study is the first to profile m6A modifications in wheat infected with a virulent Pst race. Analysis of RNA-seq and MeRIP-seq data revealed that the majority of differentially expressed genes are up-regulated and hyper-methylated. Some of these genes are enriched in the plant-pathogen interaction pathway. Notably, genes related to photosynthesis showed significant down-regulation and hypo-methylation, suggesting a potential mechanism facilitating successful Pst invasion by impairing photosynthetic function. The crucial genes, epitomizing the core molecular constituents that fortify plants against pathogenic assaults, were detected with varying expression and methylation levels, together with a newly identified methylation motif. Additionally, m6A regulator genes were also influenced by m6A modification, and their expression patterns varied at different time points of post-inoculation, with lower expression at early stages of infection. This study provides insights into the role of m6A modification regulation in wheat's response to Pst infection, establishing a foundation for understanding the potential function of m6A RNA methylation in plant resistance or susceptibility to pathogens.

Keywords: MeRIP-seq; Puccinia striiformis f. sp. tritici; RNA-seq; gene expression; m6A RNA methylation; photosynthesis; plant–pathogen interaction; post-transcriptional modification; wheat.


Conflict of interest statement

The authors declare no conflicts of interest.

Figures

Figure 1
Figure 1
An overview of the experimental setup in wheat after Pst infection, integrating MeRIP-seq, RNA-seq, and qRT-PCR with phenotype analysis. (A) Schematic of the experimental workflow for MeRIP-seq, RNA-seq, and qRT-PCR in CK and Pst-infected wheat leaves. This diagram illustrates the step-by-step procedure adopted for analyzing both mock inoculation wheat leaves (CK) and Pst-infected wheat leaves (infected) at 7 dpi using NGS technology. The workflow highlights the incorporation of the MeRIP technique to selectively isolate m6A-modified RNA fractions for subsequent sequencing. (B) The phenotype of CK and infected wheat seedlings with Pst infection at 7 dpi. The CK wheat leaves showed no visible symptoms, but the infected wheat leaves showed chlorotic patches and blotches. (C) The magnification of CK and infected wheat leaves in the dotted box in (B). (D) sqRT-PCR assay of PsEF1 in CK and infected wheat leaves at 7 dpi.
Figure 2
Figure 2
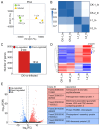
Comprehensive analysis of RNA-seq data from CK and infected wheat samples at 7 dpi. (A) Principal component analysis (PCA) of CK groups (green dots) and infected groups (yellow triangles) with two biological replicates each in RNA-seq. (B) Heatmap of Pearson correlation coefficients across four samples. The gradient of colors, transitioning from white to dark blue, represents the correlation strength between each pair of samples, with darker shades indicating stronger correlations. (C) Numbers of differentially expressed genes (DEGs) in wheat after Pst infection with |Log2 (FC)| > 1 and FDR (false discovery rate) < 0.05. (D) Heatmap of DEGs with 20 clusters. Rows, individual mRNA transcripts; columns, individual CK and infected samples. Red and blue represent up-regulation and down-regulation of mRNA levels in CK and infected samples, respectively. (E) Volcano plot showing up-regulated genes (red) and down-regulated genes (blue) in wheat with Pst infection. The gene ID and corresponding gene descriptions for the three most significantly up-regulated genes as well as the three most significantly down-regulated genes are provided.
Figure 3
Figure 3
GO (Gene Ontology) and KEGG (Kyoto Encyclopedia of Genes and Genomes) pathway enrichment analysis of differentially expressed genes (DEGs) identified based on the RNA-seq data from CK and Pst-infected wheat leaves. (A) GO enrichment circle diagram of differentially expressed genes (DEGs). From outer circle to inner circle: Circle 1: The top 20 enriched GO terms of DEGs, and the coordinate scale outside the circle is the number of DEGs. Yellow and blue represent the GO terms of biological process and molecular function, respectively. Circle 2: The background of DEGs enriched in each GO term. The greater the number of DEGs, the longer the bar, and the smaller the q-value, the redder the color. Circle 3: The bar of the proportion of up-regulated (dark purple) and down-regulated (light purple) DEGs. The specific values are shown below. Circle 4: The rich factor value of each GO term (the number of DEGs divided by the total number of genes in the GO term); each grid line of the background grid represents 0.1. (B) Bubble chart illustrating the top 20 enriched GO terms in the cellular component category of DEGs based on q-value, with GO term ID and annotation on the y-axis and rich factor on the x-axis. (C) The histogram of level 2 GO terms enrichment classification of DEGs in infected samples in comparison to CK samples. The histogram depicts the number of up-regulated (in red) and down-regulated (in green) genes in each GO term. (D) KEGG pathway enrichment circle diagram of DEGs. From outer circle to inner circle: Circle 1: The top 20 enriched A class KEGG pathways of DEGs, and the coordinate scale outside the circle is the number of DEGs. Yellow represents the KEGG pathway of metabolism. Circle 2: The background of DEGs enriched in each pathway. The greater the number of DEGs, the longer the bar, and the smaller the q-value, the redder the color. Circle 3: The bar of the proportion of up-regulated (dark purple) and down-regulated (light purple) DEGs enriched in each pathway. The specific values are shown below. Circle 4: The rich factor value of each pathway (the number of DEGs divided by the total number of genes in the pathway); each grid line of the background grid represents 0.1. (E) Bubble chart illustrating the top 20 enriched KEGG pathways of DEGs based on q-value, with KEGG term annotation on the y-axis and rich factor on the x-axis.
Figure 4
Figure 4
Comprehensive analysis of MeRIP-seq data from CK and infected wheat samples at 7 dpi. (A) Principal component analysis (PCA) of CK groups (green dots) and infected groups (yellow triangles) with two biological replicates each in MeRIP-seq. (B) Heatmap of Pearson correlation coefficients across four samples in MeRIP-seq. The color from blue to red represents the correlation from weak to strong. (C) Distribution and density of m6A peaks of CK sample and infected sample within 5′UTR (untranslated region), CDS (coding sequence), and 3′UTR. (D) Motif analysis of enriched RRACH and DRACH (R is A/G, H is A/U/C and D is A/G/U) conserved motifs for m6A peaks in wheat from CK and Pst-infected samples. (E) Numbers of differentially m6A-modified peaks (DMPs) in wheat after Pst infection with |log2(FC)| > 1 and p-value < 0.05. (F) Volcano plot showing up-regulated (red) and down-regulated (blue) m6A peak-related genes in wheat after Pst infection. The gene ID and corresponding gene descriptions for the three most significantly up-regulated peak-related genes as well as the three most significantly down-regulated peak-related genes are provided.
Figure 5
Figure 5
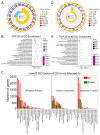
GO (Gene Ontology) and KEGG (Kyoto Encyclopedia of Genes and Genomes) pathway enrichment analysis of differentially m6A-modified peak (DMP)-related genes identified based on the MeRIP-seq data from Pst-infected wheat leaves in comparison to CK samples. (A) GO enrichment circle diagram of differentially m6A-modified peak (DMP)-related genes. From outer circle to inner circle: Circle 1: The top 20 enriched GO terms of DMP-related genes, and the coordinate scale outside the circle is the number of DMP-related genes. Yellow represents the GO term of biological process. Circle 2: The background of DMP-related genes enriched in each GO term. The greater the number of DMP-related genes, the longer the bar, and the smaller the q-value, the redder the color. Circle 3: The number of DMP-related genes enriched in each GO term. Circle 4: The rich factor value of each GO term (the number of DMP-related genes divided by the total number of genes in the GO term); each grid line of the background grid represents 0.1. (B) Bubble chart illustrating the top 20 enriched GO terms in the cellular component category of DMP-related genes based on q-value, with GO term ID and annotation on the y-axis and rich factor on the x-axis. (C) The histogram of level 2 GO terms enrichment classification of DMP-related genes in infected samples in comparison to CK samples. (D) KEGG pathway enrichment circle diagram of DMP-related genes. From outer circle to inner circle: Circle 1: The top 20 enriched A class KEGG pathways of DMP-related genes, and the coordinate scale outside the circle is the number of DMP-related genes. Yellow and pink represent the KEGG pathways of metabolism and genetic information processing, respectively. Circle 2: The background of DMP-related genes enriched in each pathway. The greater the number of DMP-related genes, the longer the bar, and the smaller the q-value, the redder the color. Circle 3: The number of DMP-related genes enriched in each pathway. Circle 4: The rich factor value of each pathway (the number of DMP-related genes divided by the total number of genes in the pathway); each grid line of the background grid represents 0.1. (E) Bubble chart illustrating the top 20 enriched KEGG pathways of DMP-related genes based on q-value, with KEGG term annotation on the y-axis and rich factor on the x-axis.
Figure 6
Figure 6
Conjoint analysis of MeRIP-seq and RNA-seq data. (A) Dual Venn diagrams of m6A-modified peaks and their corresponding genes in CK and infected samples. Left: numbers of unique peaks in CK and infected samples, along with common peaks. Right: numbers of these peaks represent genes of the two groups. (B) A four-quadrant diagram illustrating significant changes in DEGs and DMP-related genes, comparing infected samples to CK. |log2(FC)| > 1 in both MeRIP-seq and RNA-seq; FC is fold change. (C) Bar chart and heat map of the hyper-up, hyper-down, hypo-up, and hypo-down genes are shown in Table 3.
Figure 7
Figure 7
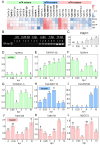
Expression patterns of m6A writers, erasers, and readers in wheat after Pst inoculation. (A) Heatmap illustrating the expression profiles of m6A writers, erasers, and readers from MeRIP-seq and RNA-seq data in CK and infected samples. The color scale within the dendrogram represents the log2(TPM + 1) of each m6A regulator gene. Gene names in bold were further analyzed in (DL). (B) Agarose gel (2.5%) electrophoresis displaying the sqRT-PCR products of PsEF1 in Pst-infected wheat leaves collected from 0 (CK), 0.25, 1, 4, 7, 10 dpi with three biological replicates. (C) Quantitative analysis of band intensity for sqRT-PCR products of PsEF1, as depicted in (B). Intensity values of all samples are normalized against the intensity value of the 0.25 dpi sample. (DL) Relative expression levels of m6A regulators in Pst-infected wheat determined by RT-PCR. Each panel corresponds to a different m6A regulator gene: (D) TaVIR-D, (E) TaFIP37-2D, (F) TaVIR-A, (G) TaHAKAI1-A, (H) TaALKBH11B, (I) TaALKBH4B, (J) TaECT25, (K) TaECT31, and (L) TaECT21. Expression levels are normalized to those detected in the CK (0 dpi). The small case letters on the bars of the figures refer to the relative expression levels.

Similar articles

Cited by

  • RNA modifications in plant biotic interactions.
    Ge L, Pan F, Jia M, Pott DM, He H, Shan H, Lozano-Durán R, Wang A, Zhou X, Li F. Ge L, et al. Plant Commun. 2025 Feb 10;6(2):101232. doi: 10.1016/j.xplc.2024.101232. Epub 2024 Dec 25. Plant Commun. 2025. PMID: 39722456 Free PMC article. Review.

References

    1. Boccaletto P., Stefaniak F., Ray A., Cappannini A., Mukherjee S., Purta E., Kurkowska M., Shirvanizadeh N., Destefanis E., Groza P., et al. MODOMICS: A database of RNA modification pathways. 2021 update. Nucleic Acids Res. 2021;50:D231–D235. doi: 10.1093/nar/gkab1083. - DOI - PMC - PubMed
    1. Zhang Y., Lu L., Li X. Detection technologies for RNA modifications. Exp. Mol. Med. 2022;54:1601–1616. doi: 10.1038/s12276-022-00821-0. - DOI - PMC - PubMed
    1. Bi Z., Liu Y., Zhao Y., Yao Y., Wu R., Liu Q., Wang Y., Wang X. A dynamic reversible RNA N6-methyladenosine modification: Current status and perspectives. J. Cell. Physiol. 2019;234:7948–7956. doi: 10.1002/jcp.28014. - DOI - PubMed
    1. Lin H., Shi T., Zhang Y., He C., Zhang Q., Mo Z., Pan W., Nie X. Genome-wide identification, expression and evolution analysis of m6A writers, readers and erasers in Aegilops_tauschii. Plants. 2023;12:2747. doi: 10.3390/plants12142747. - DOI - PMC - PubMed
    1. Shen L., Ma J., Li P., Wu Y., Yu H. Recent advances in the plant epitranscriptome. Genome Biol. 2023;24:43. doi: 10.1186/s13059-023-02872-6. - DOI - PMC - PubMed

LinkOut - more resources