. 2024 Mar 31;17(7):1597.
doi: 10.3390/ma17071597.

Crashworthiness of 3D Lattice Topologies under Dynamic Loading: A Comprehensive Study

Affiliations

Crashworthiness of 3D Lattice Topologies under Dynamic Loading: A Comprehensive Study

Autumn R Bernard et al. Materials (Basel). .

Abstract

Periodic truss-based lattice materials, a particular subset of cellular solids that generally have superior specific properties as compared to monolithic materials, offer regularity and predictability that irregular foams do not. Significant advancements in alternative technologies-such as additive manufacturing-have allowed for the fabrication of these uniquely complex materials, thus boosting their research and development within industries and scientific communities. However, there have been limitations in the comparison of results for these materials between different studies reported in the literature due to differences in analysis approaches, parent materials, and boundary and initial conditions considered. Further hindering the comparison ability was that the literature generally only focused on one or a select few topologies. With a particular focus on the crashworthiness of lattice topologies, this paper presents a comprehensive study of the impact performance of 24 topologies under dynamic impact loading. Using steel alloy parent material (manufactured using Selective Laser Melting), a numerical study of the impact performance was conducted with 16 different impact energy-speed pairs. It was possible to observe the overarching trends in crashworthiness parameters, including plateau stress, densification strain, impact efficiency, and absorbed energy for a wide range of 3D lattice topologies at three relative densities. While there was no observed distinct division between the results of bending and stretching topologies, the presence of struts aligned in the impact direction did have a significant effect on the energy absorption efficiency of the lattice; topologies with struts aligned in that direction had lower efficiencies as compared to topologies without.

Keywords: 316L stainless steel; dynamic compression; energy absorption; finite element analysis; truss lattice materials.


Conflict of interest statement

The authors declare no conflicts of interest. The funders had no role in the design of the study, in the collection, analyses, or interpretation of data, in the writing of the manuscript, or in the decision to publish the results.

Figures

Figure 1
Figure 1
Relative density versus the ratio of radius to unit cell height. Line types distinguish between stretching (solid), bending (dotted), and mixed (dashed) deformation modes, discussed in Section 3.1. Line opacity indicates whether there is at least one strut aligned in the loading direction: opaque—no, semi-translucent—yes.
Figure 2
Figure 2
Stress–strain and efficiency–strain results for the quasi-static experiments (from Cao et al. [17]) and the corresponding numerical model as designed for this work. Select deformation behavior illustrated in Figure 3.
Figure 3
Figure 3
Deformation behavior of rhombic dodecahedron cluster from experiments (half-image on the right, from Cao et al. [17]) and corresponding numerical model for this work (half-images on the left) for given strain values. Corresponding stress and efficiency results are provided in Figure 2.
Figure 4
Figure 4
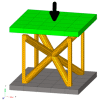
General finite element model components, using a BCC-Z unit cell (orange) for illustrative purposes. Base plate (grey) is fixed and not permitted to translate or rotate. Impactor (green) is given an initial velocity in the downward y-direction as indicated by the black arrow.
Figure 5
Figure 5
(Left) Unit cell internal energy over compression of lattice. (Right) Interface force over compression of lattice. Lettered displacement locations (A, B, C, D, E, and F) correspond to images in Figure 6 for the two single-unit cells and the 3 × 3 layer.
Figure 6
Figure 6
Deformation behavior of two unit cells with different boundary conditions applied to the sides (fixed in top row and free in bottom row), as compared to the middle unit cell of a single-layer 3 × 3 lattice cluster (middle row). Color contour is of plastic strain, units [mm/mm]. Letters correspond to displacement locations in Figure 5.
Figure 7
Figure 7
Internal energy over compression displacement for AFCC topology at three relative densities, four speeds, and four initial kinetic energies. Top graphs are for initial KE of 50 J and 100 J, and bottom graphs are for initial KE of 1 J and 5 J (identified by line type per legend). Variations in initial impact speeds are distinguished using the line color specified in legend. From left to right: relative density 10%, 20%, 30%; images of unit cell provided for reference. Grey lines are used to help compare relative densities.
Figure 8
Figure 8
Stress over strain for AFCC topology at three relative densities, four speeds, and four initial kinetic energies. Top graphs are for initial KE of 50 J and 100 J, and bottom graphs are for initial KE of 1 J and 5 J (identified by line type per legend). Variations in initial impact speeds are distinguished using the line color specified in legend. From left to right: relative density 10%, 20%, 30%; images of unit cell provided for reference. Grey lines are used to help compare relative densities.
Figure 9
Figure 9
Internal energy over compression displacement for AFCC topology at a relative density of 10%. Variations in initial KE are 50 J and 100 J (distinguished by line type). Variations in initial impact speeds are 100 m/s and 1000 m/s (distinguished by line color). Color contour for images of compression of unit cells is for plastic strain [mm/mm].
Figure 10
Figure 10
(Left) static homogenized Young’s modulus (i.e., in compression direction) versus strut radius and (right) plateau stress versus strut radius (impact energy 100 J, speed 10 m/s). Legend as shown in Figure 1. Line types distinguish stretching (solid), bending (dotted), and mixed (dashed) deformation modes, discussed in Section 3.1. Line opacity indicates whether there is at least one strut aligned in the loading direction: opaque—no, semi-translucent—yes (see Table 6 for clear classification on whether strut(s) are aligned in loading direction or not). The arrow at the end of the line indicates increasing relative density.
Figure 11
Figure 11
(Left) homogenized Poisson’s ratio (in compression direction) versus strut radius and (right) densification strain versus strut radius (impact energy 100 J, speed 10 m/s). Legend as shown in Figure 1. Line types distinguish stretching (solid), bending (dotted), and mixed (dashed) deformation modes. Line opacity indicates whether there is at least one strut aligned in the loading direction: opaque—no, semi-translucent—yes (see Table 6 for clear classification on whether strut(s) are aligned in the loading direction or not). The arrow at the end of the line indicates increasing relative density.
Figure 12
Figure 12
(Left) plateau stress versus IE at densification strain and (right) plateau stress versus densification strain. Both sets of data are for an impact energy of 100 J, speed of 10 m/s. Legend as shown in Figure 1. Line types distinguish stretching (solid), bending (dotted), and mixed (dashed) deformation modes. Line opacity indicates whether there is at least one strut aligned in the loading direction: opaque—no, semi-translucent—yes (see Table 6 for clear classification on whether strut(s) are aligned in the loading direction or not). The arrow at the end of the line indicates increasing relative density.
Figure 13
Figure 13
EA efficiency versus strut radius (impact energy 100 J, speed 10 m/s)—left: struts in loading direction; right—no struts in loading direction (see Table 6 for clear classification on whether strut(s) are aligned in loading direction or not). Legend as shown in Figure 1. Line types distinguish stretching (solid), bending (dotted), and mixed (dashed) deformation modes. The arrow at the end of the line indicates increasing relative density. Grey lines are for ease of comparison between the data in the two plots (grey data is found as color data in the other plot).

References

    1. Ashby M.F. The Properties of Foams and Lattices. Philos. Trans. R. Soc. A Math. Phys. Eng. Sci. 2006;364:15–30. doi: 10.1098/rsta.2005.1678. - DOI - PubMed
    1. Gibson L.J., Ashby M.F. Cellular Solids: Structure and Properties. 2nd ed. Cambridge University Press; Cambridge, UK: 1997.
    1. Helou M., Kara S. Design, Analysis and Manufacturing of Lattice Structures: An Overview. Int. J. Comput. Integr. Manuf. 2018;31:243–261. doi: 10.1080/0951192X.2017.1407456. - DOI
    1. Tsopanos S., Mines R.A.W., McKown S., Shen Y., Cantwell W.J., Brooks W., Sutcliffe C.J. The Influence of Processing Parameters on the Mechanical Properties of Selectively Laser Melted Stainless Steel Microlattice Structures. J. Manuf. Sci. Eng. 2010;132:0410111–04101112. doi: 10.1115/1.4001743. - DOI
    1. Parthasarathy J., Starly B., Raman S., Christensen A. Mechanical Evaluation of Porous Titanium (Ti6Al4V) Structures with Electron Beam Melting (EBM) J. Mech. Behav. Biomed. Mater. 2010;3:249–259. doi: 10.1016/j.jmbbm.2009.10.006. - DOI - PubMed

Grants and funding

LinkOut - more resources