. 2024 Apr 3;25(7):4000.
doi: 10.3390/ijms25074000.

Antenatal Ureaplasma Infection Causes Colonic Mucus Barrier Defects: Implications for Intestinal Pathologies

Affiliations

Antenatal Ureaplasma Infection Causes Colonic Mucus Barrier Defects: Implications for Intestinal Pathologies

Charlotte van Gorp et al. Int J Mol Sci. .

Abstract

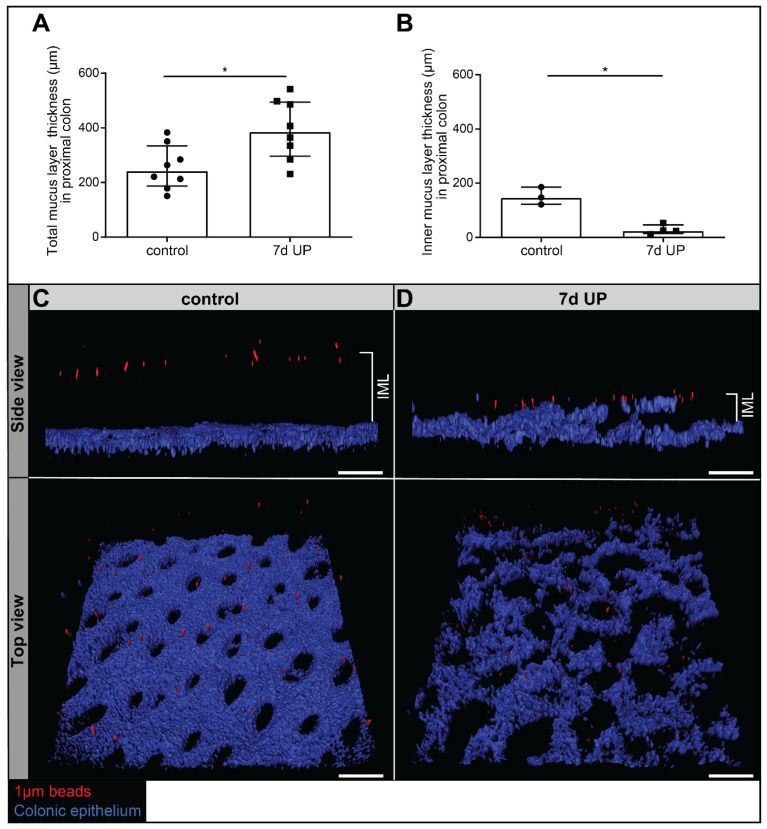
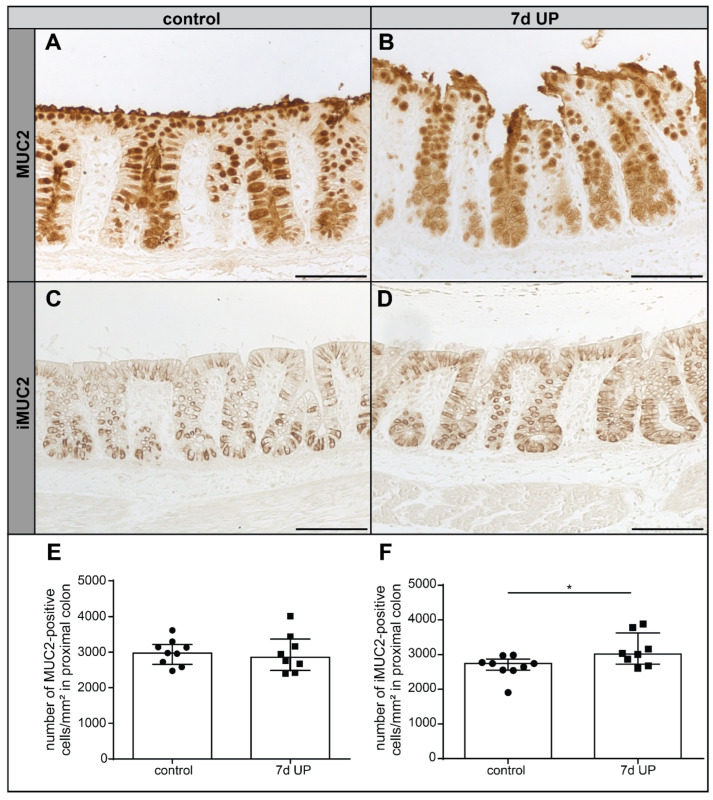
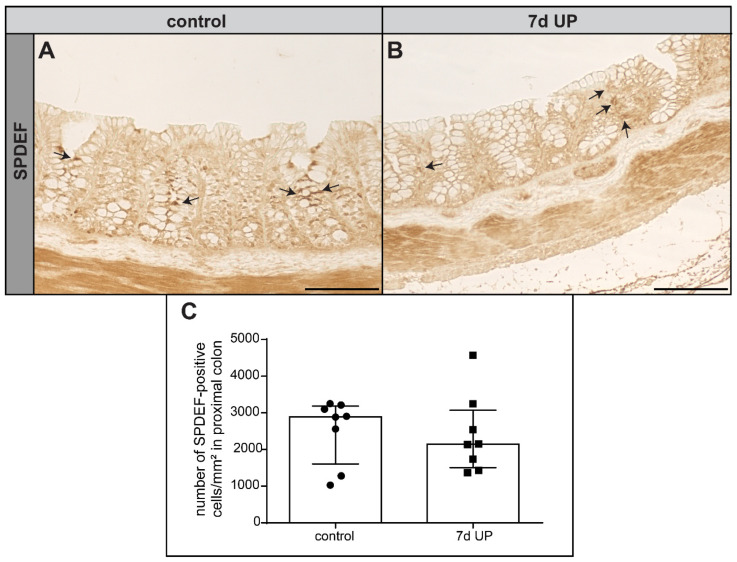
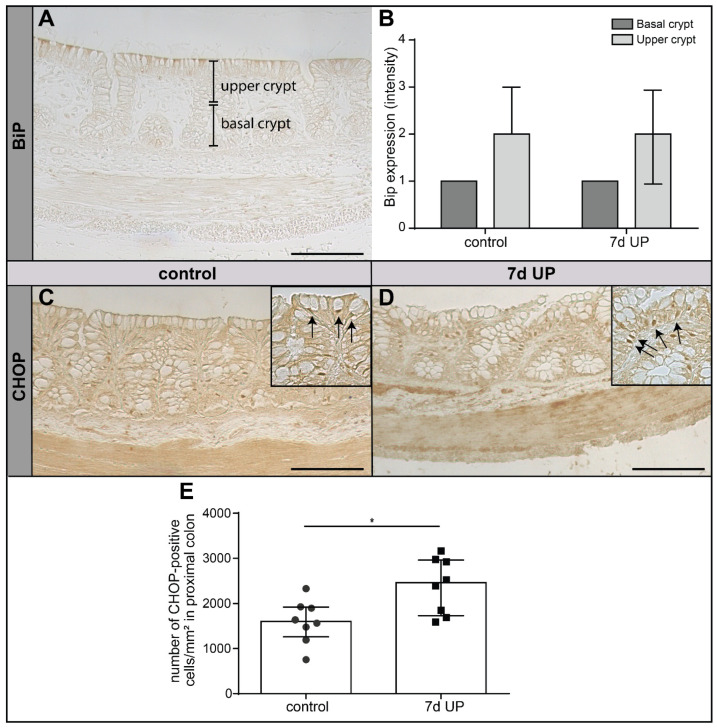
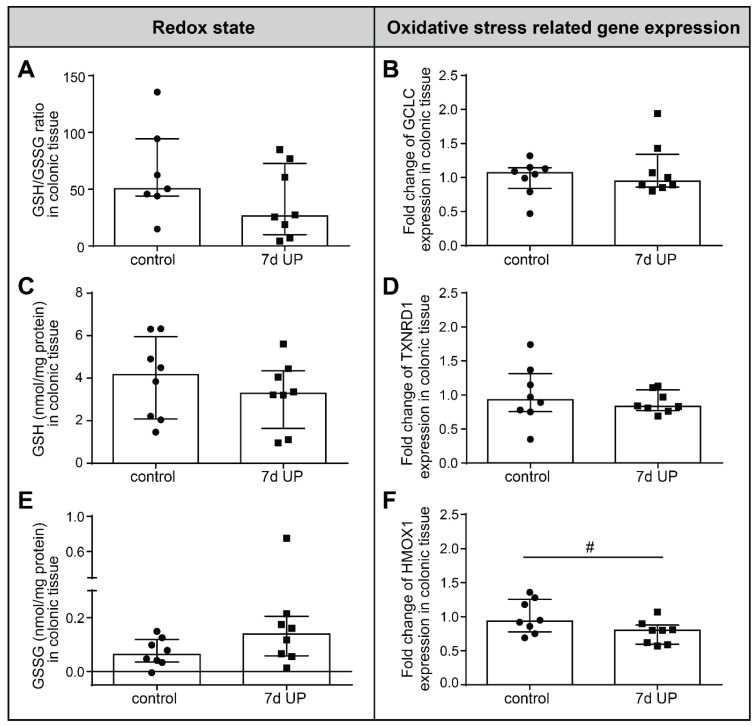
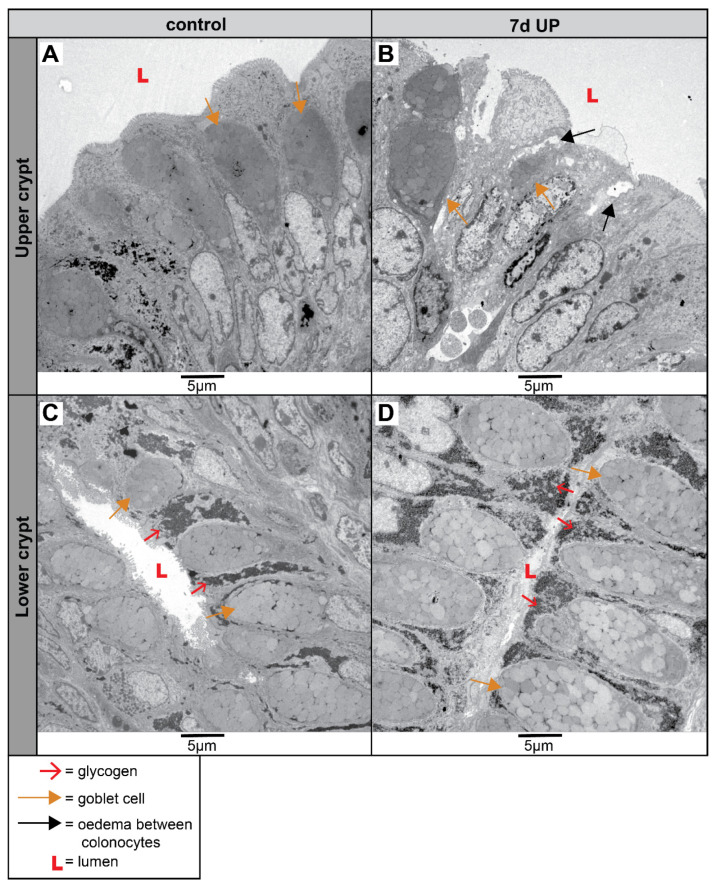
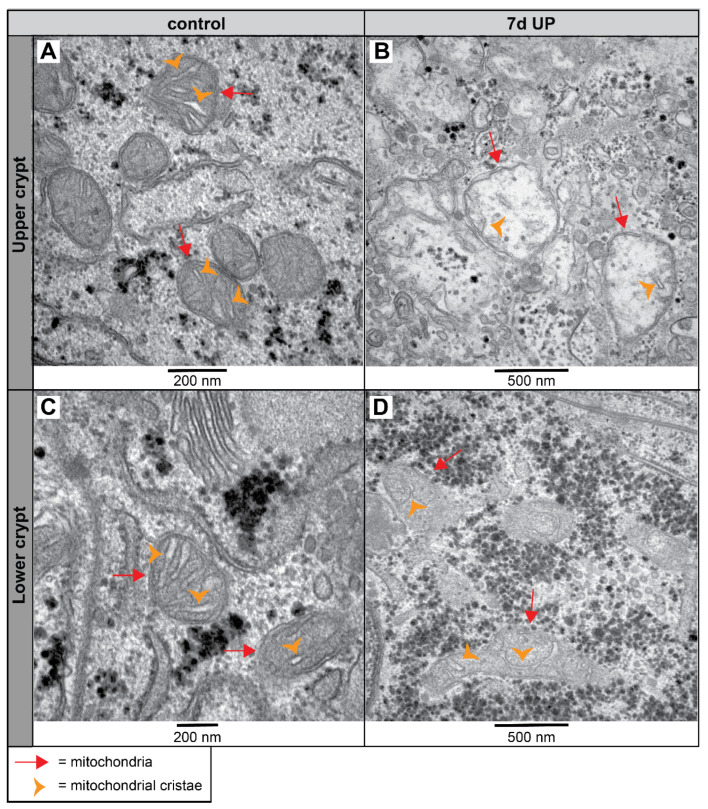
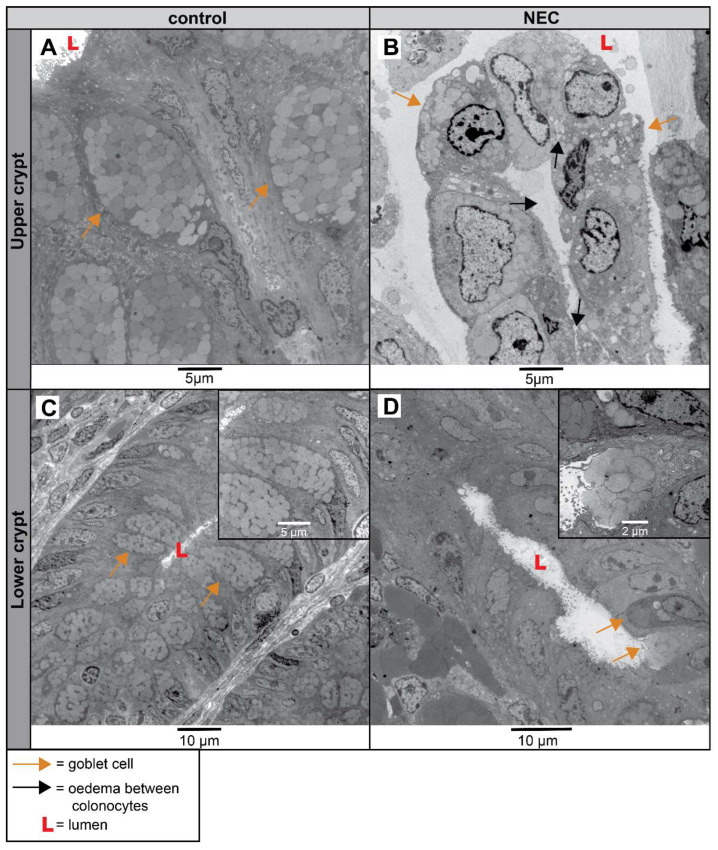
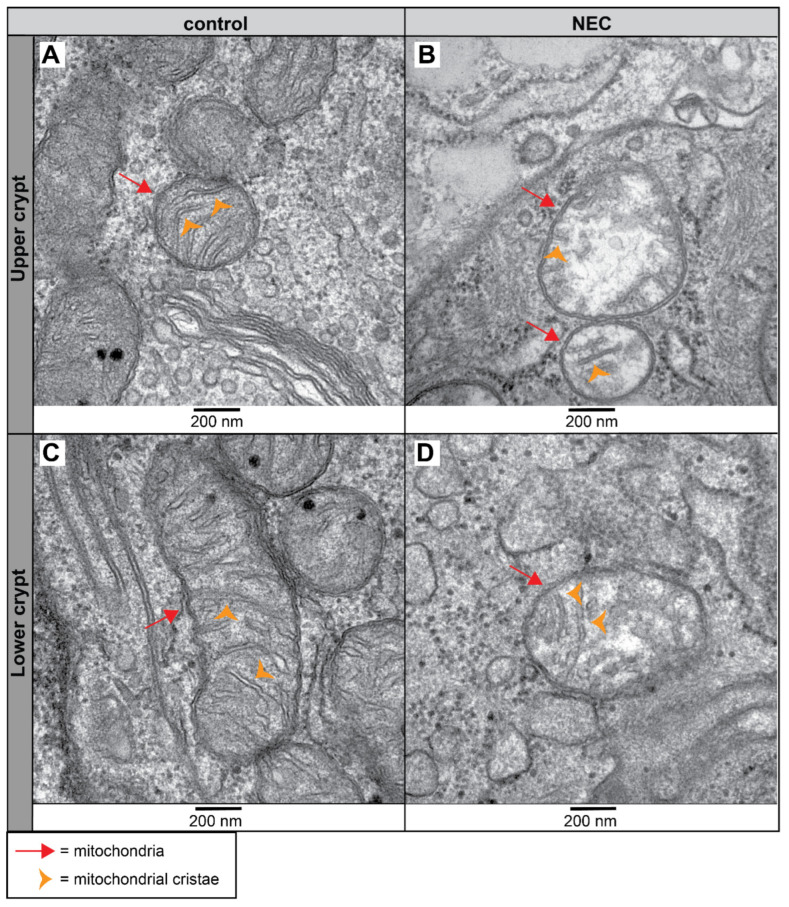
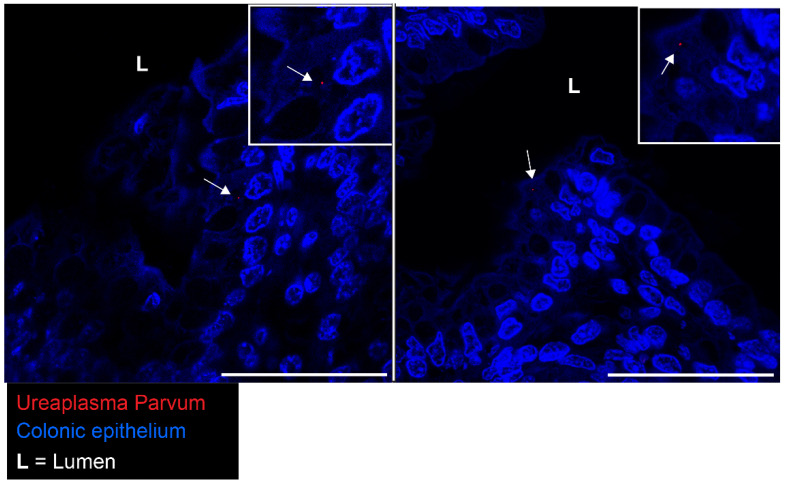
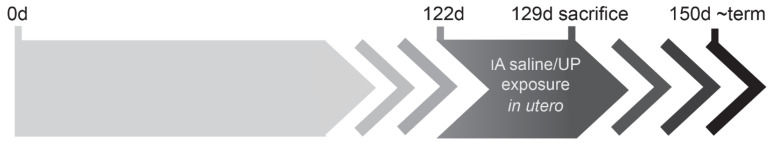
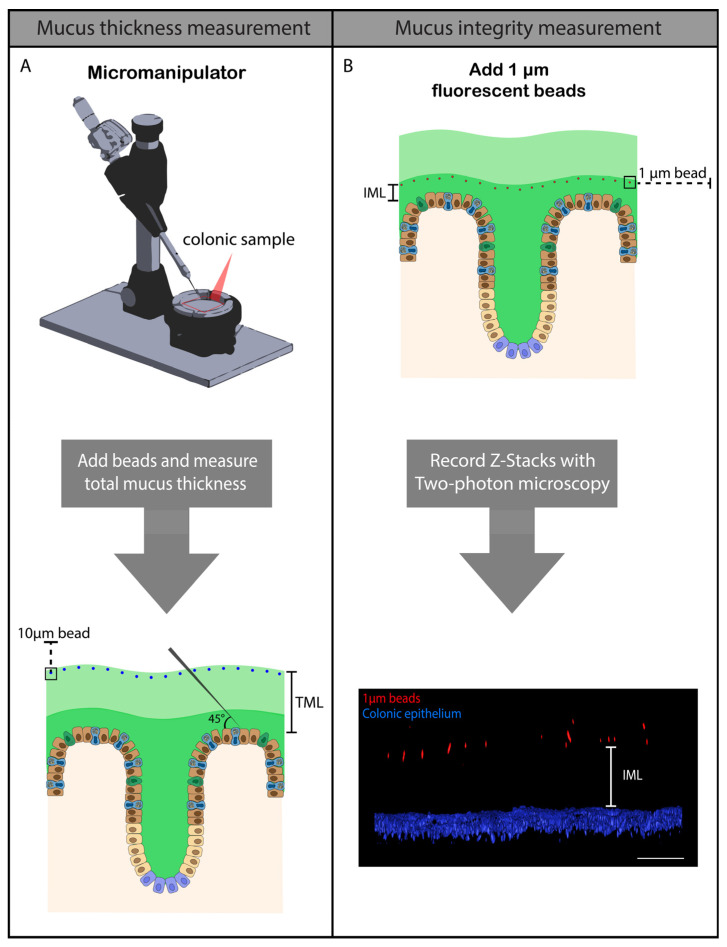
Chorioamnionitis is a risk factor for necrotizing enterocolitis (NEC). Ureaplasma parvum (UP) is clinically the most isolated microorganism in chorioamnionitis, but its pathogenicity remains debated. Chorioamnionitis is associated with ileal barrier changes, but colonic barrier alterations, including those of the mucus barrier, remain under-investigated, despite their importance in NEC pathophysiology. Therefore, in this study, the hypothesis that antenatal UP exposure disturbs colonic mucus barrier integrity, thereby potentially contributing to NEC pathogenesis, was investigated. In an established ovine chorioamnionitis model, lambs were intra-amniotically exposed to UP or saline for 7 d from 122 to 129 d gestational age. Thereafter, colonic mucus layer thickness and functional integrity, underlying mechanisms, including endoplasmic reticulum (ER) stress and redox status, and cellular morphology by transmission electron microscopy were studied. The clinical significance of the experimental findings was verified by examining colon samples from NEC patients and controls. UP-exposed lambs have a thicker but dysfunctional colonic mucus layer in which bacteria-sized beads reach the intestinal epithelium, indicating undesired bacterial contact with the epithelium. This is paralleled by disturbed goblet cell MUC2 folding, pro-apoptotic ER stress and signs of mitochondrial dysfunction in the colonic epithelium. Importantly, the colonic epithelium from human NEC patients showed comparable mitochondrial aberrations, indicating that NEC-associated intestinal barrier injury already occurs during chorioamnionitis. This study underlines the pathogenic potential of UP during pregnancy; it demonstrates that antenatal UP infection leads to severe colonic mucus barrier deficits, providing a mechanistic link between antenatal infections and postnatal NEC development.

Keywords: Ureaplasma; colon; goblet cell; intestinal mucus barrier; necrotizing enterocolitis; perinatal inflammation.


Conflict of interest statement

The authors declare no conflict of interest. The funders had no role in study design, data collection or analysis, data interpretation, manuscript writing, or decision to publish.

Figures

Figure 1
Figure 1
TML thickness and mucus barrier functional integrity (IML thickness) in the premature ovine colon. Total mucus thickness, evaluated ex vivo with 10 µm beads and a custom-made mucus measurement system, was statistically significantly increased in 7 d IA UP-exposed animals compared to preterm controls ((A), control N = 8, UP N = 8). Mucus barrier functional integrity was measured ex vivo in control and 7 d IA UP-exposed lambs with 1 µm (bacterial sized) beads and two photon microscopy. Compared to premature control lambs ((B,C) N = 3), mucus barrier functional integrity (IML thickness) was decreased in 7 d IA UP-exposed animals ((B,D), N = 4), with increased penetration of the 1 µm beads (red) towards the colonic epithelium (blue). In UP-exposed lambs, numerous beads reached the intestinal epithelium (B,D). In addition, whereas the organization of the colonic epithelium was intact in control premature lambs (C), this was disrupted following IA UP exposure (D). Data are displayed as the median ± interquartile range. Scale bars indicate 100 µm. * p < 0.05. Abbreviations: IA: intra-amniotic; IML: inner mucus layer; UP: Ureaplasma parvum.
Figure 2
Figure 2
Number of MUC2+ and iMUC2+ goblet cells in the proximal colon of premature lambs per mm2 tissue surface area. No changes in the number of MUC2+ goblet cells were observed between controls ((A,E), N = 9) and 7 d IA UP-exposed animals ((B,E), N = 8). Compared to controls ((C,F), N = 9), the number of iMUC2+ cells was statistically significantly increased in IA UP-exposed animals ((D,F), N = 8) and a more intense staining of iMUC+ goblet cells was observed in the upper crypt of 7 d IA UP-exposed animals (D) than in the upper crypt of controls (C). Each data point represents the average positive cell count of one animal of the MUC2 (E) and iMUC2 (F) immunohistochemical staining, respectively. Data are displayed as the median with the interquartile range. Scale bars indicate 100 µm. * p < 0.05. Abbreviations: IA: intra-amniotic; iMUC2: ‘immature’ apomucin-2; MUC2: mucin-2; UP: Ureaplasma parvum.
Figure 3
Figure 3
Number of SPDEF+ goblet cells in the proximal colon of premature lambs per mm2 tissue surface area. The number of SPDEF+ cells (black arrows) was unaltered compared to control premature lambs ((A,C), N = 8) following IA UP exposure ((B,C), N = 8). Each data point represents the average positive cell count of SPDEF immunohistochemical staining. Data are displayed as the median with the interquartile range. Scale bars indicate 100 µm. Abbreviations: IA: intra-amniotic; SPDEF: Sterile Alpha Motif Pointed Domain-containing Ets Transcription Factor; UP: Ureaplasma parvum.
Figure 4
Figure 4
BiP expression levels and the number of CHOP+ epithelial cells (black arrows) per mm2 tissue surface area in the proximal colons of premature lambs. BiP expression in the upper crypt was higher compared to the lower crypt in both the IA UP-exposed and control lambs ((A,B), control N = 8; UP N = 8). No difference was observed in BiP expression levels between the groups ((B), control N = 8; UP N = 8). Compared to controls ((C,E), N = 8), 7 d IA UP exposure leads to a statistically significant increase in CHOP+ epithelial cells ((D,E), N = 8). Each data point represents the average positive cell count of one animal in the CHOP immunohistochemical staining (E). Data are displayed as the median with the interquartile ranges. Scale bars indicate 100 µm. * p < 0.05. Abbreviations: IA: intra-amniotic; BiP: binding immunoglobulin protein; CHOP: C/EBP homologous protein; UP: Ureaplasma parvum.
Figure 5
Figure 5
Redox state (GSH/GSSG ratio) and mRNA expression of oxidative stress in the proximal colon of preterm lambs. GSH/GSSG ratio ((A), control N = 7; UP N = 8), determined by dividing GSH protein expression ((C), control N = 8; UP N = 8) by GSSG protein expression ((E), control N = 8; UP N = 8) is lower, albeit not statistically significant, following 7 d IA UP exposure compared to controls; 5 out of 8 UP exposed animals have a GSH/GSSG ratio below the interquartile range of controls compared to 1 out of 7 control animals. mRNA expression of GCLC ((B), control N = 8; UP N = 8) and TXNRD1 ((D), control N = 8; UP N = 8) was not altered between the control and 7 d UP-exposed group. Interestingly, the gene expression of HMOX1 tended to be lower in 7 d UP-exposed animals compared to controls ((F), control N = 8; UP N = 8). Each data point represents the GSH/GSSG protein expression ratio (A), average protein concentration (GSH, GSSG; (C,E)) or relative mRNA expression (GCLC, TXNRD1 and HMOX1; (B,D,F)) of one lamb. Data are displayed as the median with the interquartile range. # 0.05 < p < 0.1. Abbreviations: GCLC: glutamate-cysteine ligase catalytic subunit; GSH: glutathione; GSSG: oxidized glutathione; HMOX1: heme oxygenase-1; IA: intra-amniotic; Redox: reduction-oxidation; TXNRD1: thioredoxin reductase 1; UP: Ureaplasma parvum.
Figure 6
Figure 6
Cellular morphology of colonocytes and goblet cells and tissue organization in the upper and lower crypts of the proximal colons of preterm lambs imaged with TEM. 7 d IA UP exposure leads to damage of the colonic epithelial layer at the upper colonic crypt, characterized by edema (black arrows) between the mucosal barrier cells; this was not seen in control lambs ((A,B), control N = 5; UP N = 6). Compared to controls (C), an accumulation of glycogen (red arrowhead) was observed both in colonocytes and goblet cells in the lower crypt in 7 d IA UP-exposed lambs (D). The lumen is shown by L. Scale bars indicate 5 µm. Abbreviations: IA: intra-amniotic, TEM: transmission electron microscopy, UP: Ureaplasma parvum.
Figure 7
Figure 7
Mitochondrial morphological alterations in the colonocytes of the lower and upper crypt of the proximal colon in preterm lambs visualized with TEM imaging. Compared to parallelized structured cristae (orange arrowhead) of the mitochondria (red arrow) of premature controls ((A), N = 5), the mitochondria (red arrow) in the upper crypt of 7 d IA UP-exposed animals have a globular shape with disrupted and fewer organized cristae (orange arrowhead) ((B), N = 6). Compared to controls ((C), N = 5), mitochondria (red arrow) in the lower crypts of 7 d UP-exposed lambs appeared to have lobular-shaped (C-shape) cristae ((D), N = 6). Scale bars indicate 200 nm and 500 nm, respectively. Abbreviations: IA: intra-amniotic; TEM: transmission electron microscopy; UP: Ureaplasma parvum.
Figure 8
Figure 8
Cellular morphology and tissue organization in the upper and lower colonic crypts of NEC patients and controls visualized with TEM. In the upper crypt of the controls, an abundant amount of goblet cells (orange arrows) with a recognizable structure and organization was observed ((A), N = 2). In contrast, the organization of the colonic upper crypt of NEC patients was severely disrupted; no clear cell types (colonocytes or goblet cells) can be identified based on morphology, and edema (black arrows) was seen between cells ((B), N = 2). The cellular morphology and organization of the goblet cells (orange arrows) and colonocytes present in the lower crypt are normal in control infants ((C)), N = 2), whereas disorganization and reduced numbers of intact goblet cells (orange arrows and insert) were observed in the lower crypts of NEC patients ((D), N = 2). Scale bars indicate 5 µm and 10 µm respectively. Abbreviations: L: lumen; NEC: necrotizing enterocolitis; TEM: transmission electron microscopy.
Figure 9
Figure 9
Morphological alterations of the mitochondria in the colonocytes of the upper and lower crypts of NEC patients and controls imaged with TEM. Compared to the normal morphological appearance of mitochondria (red arrow) in the upper crypt of controls ((A), N = 2), the mitochondria (red arrow) in the upper crypt of NEC patients are disorganized with disturbed cristae (orange arrowhead) ((B), N = 2). Mitochondria (red arrow) in the lower crypts of the controls show an elongated morphology with an abundance of parallel organized cristae (orange arrowhead) ((C), N = 2). In NEC patients, the mitochondrial morphology is altered in the lower crypt; mitochondria (red arrow) are more globular shaped, containing a less electron dense matrix and have a lower number and disrupted cristae (orange arrowhead) ((D), N = 2). Scale bars indicate 200 nm. Abbreviations: NEC: necrotizing enterocolitis; TEM: transmission electron microscopy.
Figure 10
Figure 10
Detection of UP in proximal colonic tissue of premature lambs with IF staining. UP (indicated by white arrows) is present in the epithelial cells of premature lambs IA exposed to UP for 7 days. Two examples are shown. Control N = 9, UP N = 8. Scale bars indicate 50 µm. Abbreviations: IA: intra-amniotic; IF: immunofluorescence; L: lumen; UP: Ureaplasma parvum.
Figure 11
Figure 11
Study design of our ovine UP-induced chorioamnionitis model. Twin fetuses from time-mated Texel ewes were randomly assigned to two different study groups. Twins (both amniotic sacs) were IA injected with saline or UP serovar 3 (107 CCU) under ultrasound guidance at 122 d of GA, and IA injections were given 7 d before preterm birth (via cesarean section) at 129 d of GA (term~150 d). Abbreviations: CCU: color-changing units; GA: gestational age; IA: intra-amniotic; UP: Ureaplasma parvum.
Figure 12
Figure 12
Methodology of mucus thickness measurement and mucus integrity measurement of proximal preterm colon. (A) For TML thickness measurement, colon samples were cut open, macerated in Krebs buffer and stretched on a silicone coated Petri dish. Thereafter, black dyed microspheres were added to the apical side of the tissue and TML thickness was assessed by measuring the distance between the 10 µm mucus-attached beads and the colonic epithelium using a home-made microneedle on a custom-made micromanipulator at a 45° angle. The vertical mucus thickness was calculated by multiplying the 45° bead-epithelium distance by cosine 45. Five different regions were measured and the median was calculated to create TML thickness value per animal. (B) For mucus functional integrity measurement, colon samples were cut open, macerated in Krebs buffer and stretched on a silicone coated Petri dish. Thereafter, Hoechst solution (for colonic epithelium visualization) and 1 µm red-fluorescent beads (for mucus integrity visualization) were added to the apical side of the tissue and the distribution of the 1 µm beads in the colonic IML was analyzed by creating Z-stacks with a 5 µm interval using a two-photon microscope. Five regions per animal were analyzed by calculating distances between individual 1 µm beads and the colonic epithelium (IML thickness); the median of the IML thickness (µm) was calculated for each animal. Scale bar indicates 100 µm. Abbreviations: TML: total mucus layer; IML: inner mucus layer.

Similar articles

References

    1. Thomas W., Speer C.P. Chorioamnionitis: Important risk factor or innocent bystander for neonatal outcome? Neonatology. 2011;99:177–187. doi: 10.1159/000320170. - DOI - PubMed
    1. Goldenberg R.L., Hauth J.C., Andrews W.W. Intrauterine infection and preterm delivery. N. Engl. J. Med. 2000;342:1500–1507. doi: 10.1056/NEJM200005183422007. - DOI - PubMed
    1. Sweeney E.L., Dando S.J., Kallapur S.G., Knox C.L. The Human Ureaplasma Species as Causative Agents of Chorioamnionitis. Clin. Microbiol. Rev. 2017;30:349–379. doi: 10.1128/CMR.00091-16. - DOI - PMC - PubMed
    1. Gantert M., Been J.V., Gavilanes A.W., Garnier Y., Zimmermann L.J., Kramer B.W. Chorioamnionitis: A multiorgan disease of the fetus? J. Perinatol. 2010;30((Suppl. S1)):S21–S30. doi: 10.1038/jp.2010.96. - DOI - PubMed
    1. Gotsch F., Romero R., Kusanovic J.P., Mazaki-Tovi S., Pineles B.L., Erez O., Espinoza J., Hassan S.S. The fetal inflammatory response syndrome. Clin. Obs. Gynecol. 2007;50:652–683. doi: 10.1097/GRF.0b013e31811ebef6. - DOI - PubMed

LinkOut - more resources