. 2024 Apr 3;25(7):4008.
doi: 10.3390/ijms25074008.

Claudin-10 Expression and the Gene Expression Pattern of Thick Ascending Limb Cells

Affiliations

Claudin-10 Expression and the Gene Expression Pattern of Thick Ascending Limb Cells

Gaelle Brideau et al. Int J Mol Sci. .

Abstract

Many genomic, anatomical and functional differences exist between the medullary (MTAL) and the cortical thick ascending limb of the loop of Henle (CTAL), including a higher expression of claudin-10 (CLDN10) in the MTAL than in the CTAL. Therefore, we assessed to what extent the Cldn10 gene expression is a determinant of differential gene expression between MTAL and CTAL. RNAs extracted from CTAL and MTAL microdissected from wild type (WT) and Cldn10 knock out mice (cKO) were analyzed by RNAseq. Differential and enrichment analyses (GSEA) were performed with interactive R Shiny software. Between WT and cKO MTAL, 637 genes were differentially expressed, whereas only 76 were differentially expressed between WT and cKO CTAL. Gene expression patterns and GSEA analyses in all replicates showed that WT MTAL did not cluster with the other replicates; no hierarchical clustering could be found between WT CTAL, cKO CTAL and cKO MTAL. Compared to WT replicates, cKO replicates were enriched in Cldn16, Cldn19, Pth1r, (parathyroid hormone receptor type 1), Casr (calcium sensing receptor) and Vdr (Vitamin D Receptor) mRNA in both the cortex and medulla. Cldn10 is associated with gene expression patterns, including genes specifically involved in divalent cations reabsorption in the TAL.

Keywords: HELIX syndrome; claudin-10; epithelium; kidney; thick ascending limb of the loop of Henle; tight junction; transcriptional profiling.


Conflict of interest statement

P.H. and C.P.-B. have no conflicts of interest to declare regarding the content of the present study.

Figures

Figure 1
Figure 1
Supervised clustering of cKO MTAL and WT MTAL based on a list of genes with likely preferential expression in the TAL. The heatmap was generated using the pheatmap R package on three pools of cKO MTAL and five pools of WT MTAL. Clustering was constructed on 212 genes using Euclidean methods and complete linkage. The gradient of colors represents the expression level (z-score).
Figure 2
Figure 2
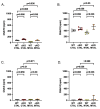
Gene expression analysis of claudins (Cldn) in WT and cKO MTAL and CTAL. (A) Cldn16. (B) Cldn19. (C) Cldn3. (D) Cldn14. Medians and interquartile ranges are shown (Mann–Whitney test); counts per millions (cpm).
Figure 3
Figure 3
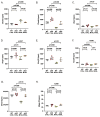
Gene expression analysis of specific ions channels, MageD2 and uromodulin in WT and cKO MTAL and CTAL. (A) Clcnka encodes the chloride channel ClC-Ka. (B) Clcnkb encodes the chloride channel ClC-Kb. (C) Bsnd encodes Barttin, an essential subunit for ClC chloride channel. (D) Kcnj1 encodes the potassium channel ROMK. (E) Kcnj16 encodes the potassium channel KIR5.1. (F) Kcnj10 encodes the potassium channel KIR4.1. (G) Umod (uromodulin). (H) MageD2. The scales are different for Umod and MageD2. Medians and interquartile ranges are shown (Mann–Whitney test); counts per millions (cpm).
Figure 4
Figure 4
Gene expression analysis of receptors in WT and cKO MTAL and CTAL. (A) Parathyroid hormone receptor type 1 (Pth1r). (B) Calcium-sensing receptor (Casr). (C) Vitamin D receptor (Vdr). Medians and interquartile ranges are shown (Mann–Whitney test); counts per millions (cpm).
Figure 5
Figure 5
Supervised clustering of cKO CTAL and WT CTAL based on a list of genes with a likely preferential expression in the TAL. The heatmap was generated using pheatmap R package on five pools of cKO CTAL and five pools of WT CTAL. Clustering was constructed on 212 genes using Euclidean methods and complete linkage. The gradient of colors represents the expression level (z-score).
Figure 6
Figure 6
Supervised clustering of WT MTAL and WT CTAL based on a list of genes with a likely preferential expression in the TAL. The heatmap was generated using pheatmap R package on five pools of WT CTAL and five pools of WT MTAL. Clustering was constructed on 217 genes using Euclidean methods and complete linkage. The gradient of colors represents the expression level (z-score).
Figure 7
Figure 7
Supervised clustering of cKO MTAL and cKO CTAL based on a list of genes with a likely preferential expression in the TAL. The heatmap was generated using a pheatmap R package on five pools of cKO CTAL and three pools of cKO MTAL. Clustering was constructed on 211 genes using Euclidean methods and complete linkage. The gradient of colors represents the expression level (z-score).
Figure 8
Figure 8
Heatmap showing gene expression pattern for all replicates of cKO MTAL, WT MTAL, cKO CTAL and WT CTAL. The heatmap was generated using pheatmap R package on five pools of WT CTAL, five pools of cKO CTAL, five pools of WT MTAL and three pools of cKO MTAL. Clustering was constructed on 10,548 genes using correlation methods and complete linkage. The gradient of colors represents the expression level (z-score).
Figure 9
Figure 9
Supervised clustering of cKO MTAL, WT MTAL, cKO CTAL and WT CTAL based on a list of genes with a likely preferential expression in the TAL. The heatmap was generated using pheatmap R package on five pools of WT CTAL, five pools of cKO CTAL, five pools of WT MTAL and three pools of cKO MTAL. Clustering was constructed on 202 genes using correlation methods and complete linkage. The gradient of colors represents the expression level (z-score).

Similar articles

Cited by

References

    1. Bankir L., Figueres L., Prot-Bertoye C., Bouby N., Crambert G., Pratt J.H., Houillier P. Medullary and cortical thick ascending limb: Similarities and differences. Am. J. Physiol. Renal. Physiol. 2020;318:F422–F442. doi: 10.1152/ajprenal.00261.2019. - DOI - PubMed
    1. Dimke H., Schnermann J. Axial and cellular heterogeneity in electrolyte transport pathways along the thick ascending limb. Acta Physiol. 2018;223:e13057. doi: 10.1111/apha.13057. - DOI - PubMed
    1. Konrad M., Nijenhuis T., Ariceta G., Bertholet-Thomas A., Calo L.A., Capasso G., Emma F., Schlingmann K.P., Singh M., Trepiccione F., et al. Diagnosis and management of Bartter syndrome: Executive summary of the consensus and recommendations from the European Rare Kidney Disease Reference Network Working Group for Tubular Disorders. Kidney Int. 2021;99:324–335. doi: 10.1016/j.kint.2020.10.035. - DOI - PubMed
    1. Bongers E., Shelton L.M., Milatz S., Verkaart S., Bech A.P., Schoots J., Cornelissen E.A.M., Bleich M., Hoenderop J.G.J., Wetzels J.F.M., et al. A Novel Hypokalemic-Alkalotic Salt-Losing Tubulopathy in Patients with CLDN10 Mutations. J. Am. Soc. Nephrol. 2017;28:3118–3128. doi: 10.1681/ASN.2016080881. - DOI - PMC - PubMed
    1. Klar J., Piontek J., Milatz S., Tariq M., Jameel M., Breiderhoff T., Schuster J., Fatima A., Asif M., Sher M., et al. Altered paracellular cation permeability due to a rare CLDN10B variant causes anhidrosis and kidney damage. PLoS Genet. 2017;13:e1006897. doi: 10.1371/journal.pgen.1006897. - DOI - PMC - PubMed