

Soy Product Consumption and the Risk of Cancer: A Systematic Review and Meta-Analysis of Observational Studies
- PMID: 38613019
- PMCID: PMC11013307
- DOI: 10.3390/nu16070986
Soy Product Consumption and the Risk of Cancer: A Systematic Review and Meta-Analysis of Observational Studies
Abstract
Background: The association between soy product consumption and cancer risk varies among studies. Therefore, this comprehensive meta-analysis of observational studies examines the association between soy product consumption and total cancer risk.
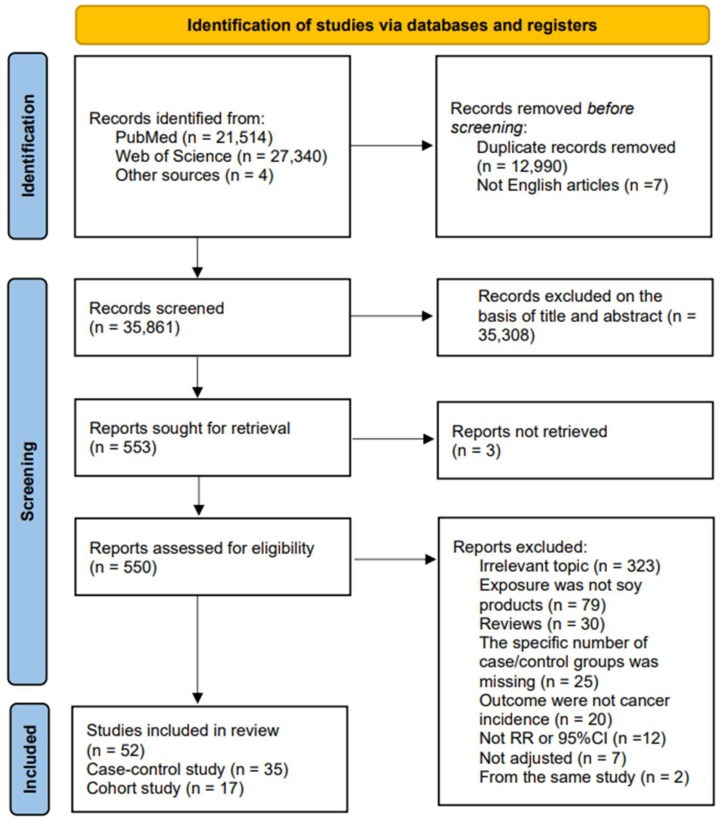
Methods: This study was conducted following the PRISMA guidelines. Up to October 2023, all eligible published studies were searched through PubMed and Web of Science databases.
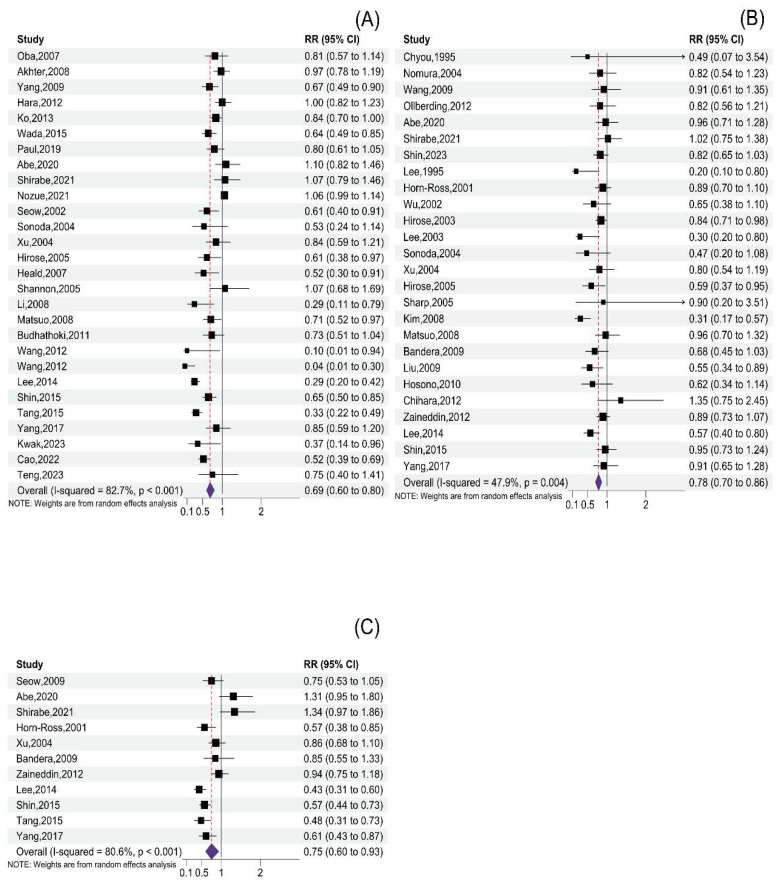
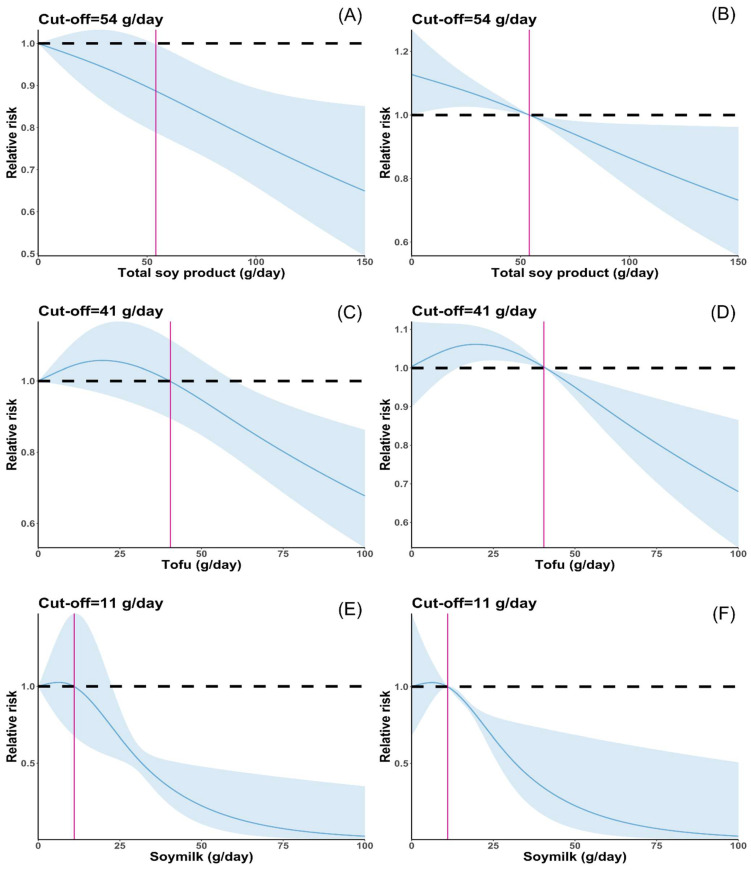
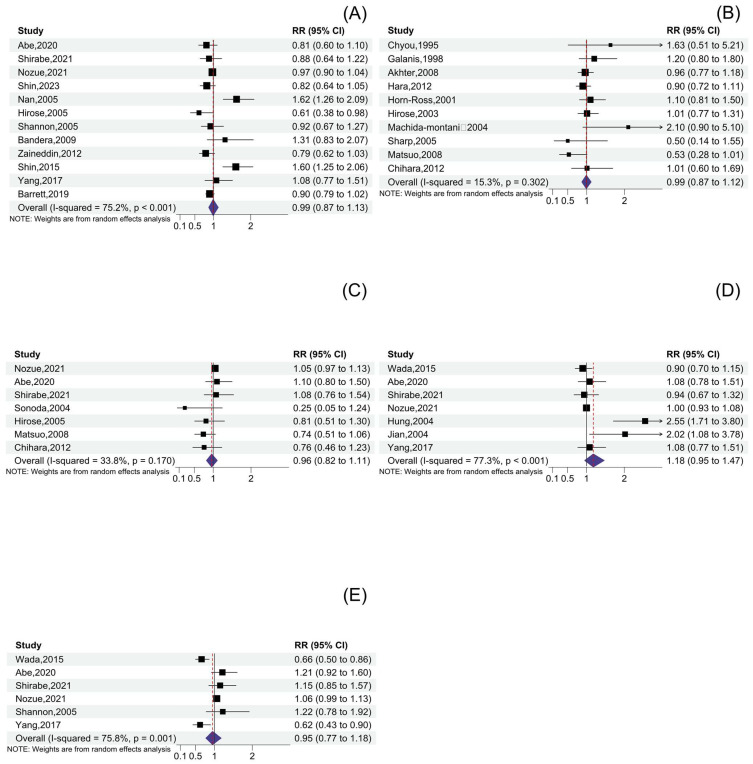
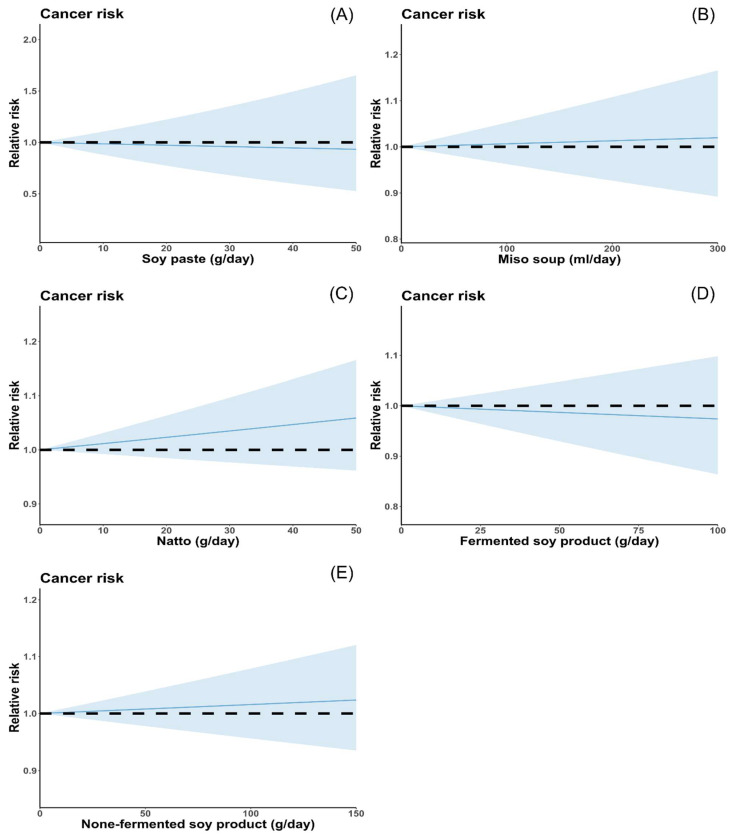
Results: A total of 52 studies on soy product consumption were included in this meta-analysis (17 cohort studies and 35 case-control studies). High consumption of total soy products (RR: 0.69; 95% CI: 0.60, 0.80), tofu (RR: 0.78; 95% CI: 0.70, 0.86), and soymilk (RR: 0.75; 95% CI: 0.60, 0.93) were associated with reduced total cancer risk. No association was found between high consumption of fermented soy products (RR: 1.18; 95% CI: 0.95, 1.47), non-fermented soy products (RR: 0.95; 95% CI: 0.77, 1.18), soy paste (RR: 1.00; 95% CI: 0.88, 1.14), miso soup (RR: 0.99; 95% CI: 0.87, 1.12), or natto (RR: 0.96; 95% CI: 0.82, 1.11) and cancer risk. A 54 g per day increment of total soy products reduced cancer risk by 11%, a 61 g per day increment of tofu reduced cancer risk by 12%, and a 23 g per day increment of soymilk reduced cancer risk by 28%, while none of the other soy products were associated with cancer risk.
Conclusion: Our findings suggest that high total soy product consumption, especially soymilk and tofu, is associated with lower cancer risk. More prospective cohort studies are still needed to confirm the causal relationship between soy product consumption and cancer risk.
Keywords: cancer; dose–response; meta-analysis; observational study; soy product.
Conflict of interest statement
The authors declare no conflict of interest.
Figures
Similar articles
-
Selenium for preventing cancer.Cochrane Database Syst Rev. 2018 Jan 29;1(1):CD005195. doi: 10.1002/14651858.CD005195.pub4. Cochrane Database Syst Rev. 2018. PMID: 29376219 Free PMC article.
-
Sertindole for schizophrenia.Cochrane Database Syst Rev. 2005 Jul 20;2005(3):CD001715. doi: 10.1002/14651858.CD001715.pub2. Cochrane Database Syst Rev. 2005. PMID: 16034864 Free PMC article.
-
Soy product consumption and the risk of all-cause, cardiovascular and cancer mortality: a systematic review and meta-analysis of cohort studies.Food Funct. 2018 May 23;9(5):2576-2588. doi: 10.1039/c7fo01622k. Food Funct. 2018. PMID: 29666853
-
Systemic pharmacological treatments for chronic plaque psoriasis: a network meta-analysis.Cochrane Database Syst Rev. 2017 Dec 22;12(12):CD011535. doi: 10.1002/14651858.CD011535.pub2. Cochrane Database Syst Rev. 2017. Update in: Cochrane Database Syst Rev. 2020 Jan 9;1:CD011535. doi: 10.1002/14651858.CD011535.pub3. PMID: 29271481 Free PMC article. Updated.
-
Soy formula for prevention of allergy and food intolerance in infants.Cochrane Database Syst Rev. 2006 Oct 18;2006(4):CD003741. doi: 10.1002/14651858.CD003741.pub4. Cochrane Database Syst Rev. 2006. PMID: 17054183 Free PMC article.
Cited by
-
Aspartame and ischemic stroke: unraveling the molecular link through network toxicology and molecular docking analysis.Sci Rep. 2025 Jul 4;15(1):23871. doi: 10.1038/s41598-025-08898-z. Sci Rep. 2025. PMID: 40615604 Free PMC article.
-
Diet Habits, Smoking, and Alcohol Consumption Among Chinese Patients with Cancer.Integr Cancer Ther. 2025 Jan-Dec;24:15347354251343004. doi: 10.1177/15347354251343004. Epub 2025 Jun 3. Integr Cancer Ther. 2025. PMID: 40458872 Free PMC article.
-
Quantification of Naturally Occurring Prebiotics in Selected Foods.Nutrients. 2025 Feb 14;17(4):683. doi: 10.3390/nu17040683. Nutrients. 2025. PMID: 40005011 Free PMC article.
-
Nutritional Quality, Safety and Environmental Benefits of Alternative Protein Sources-An Overview.Nutrients. 2025 Mar 26;17(7):1148. doi: 10.3390/nu17071148. Nutrients. 2025. PMID: 40218906 Free PMC article. Review.
-
Enhanced Quality in Bean Products Through Mixed Fermentation: A Comparative Analysis of Physicochemical, Structural, and Functional Properties of Soybean Products.Foods. 2025 Jun 4;14(11):1985. doi: 10.3390/foods14111985. Foods. 2025. PMID: 40509512 Free PMC article.
References
Publication types
MeSH terms
Grants and funding
LinkOut - more resources
Full Text Sources
Medical
