. 2024 Apr 13;81(1):180.
doi: 10.1007/s00018-024-05212-4.

Identification of the role of DAB2 and CXCL8 in uterine spiral artery remodeling in early-onset preeclampsia

Affiliations

Identification of the role of DAB2 and CXCL8 in uterine spiral artery remodeling in early-onset preeclampsia

Yu Liu et al. Cell Mol Life Sci. .

Abstract

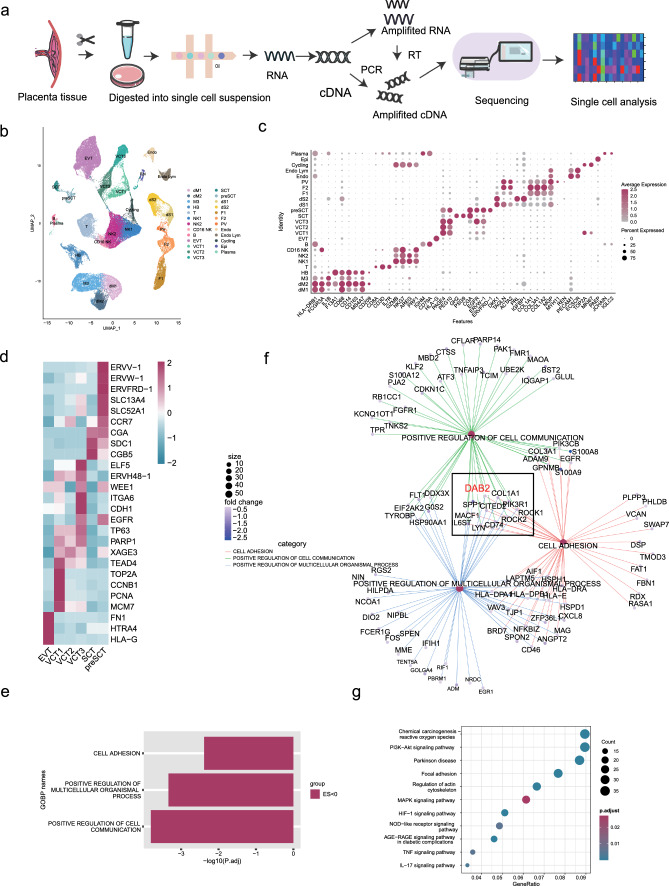
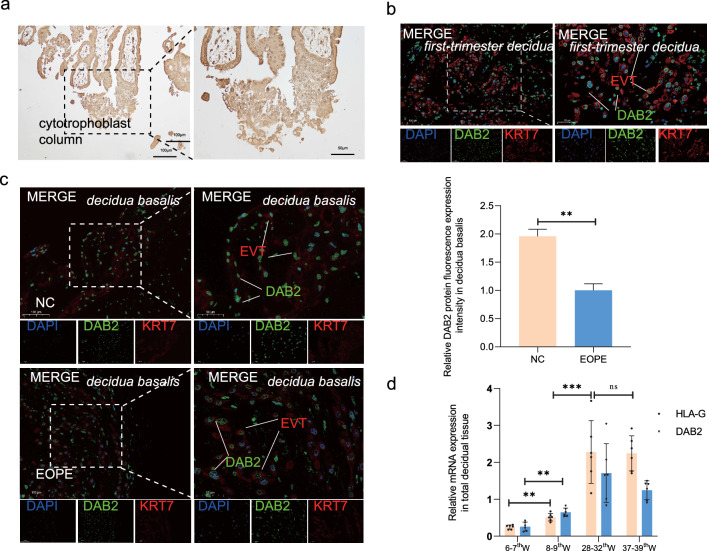
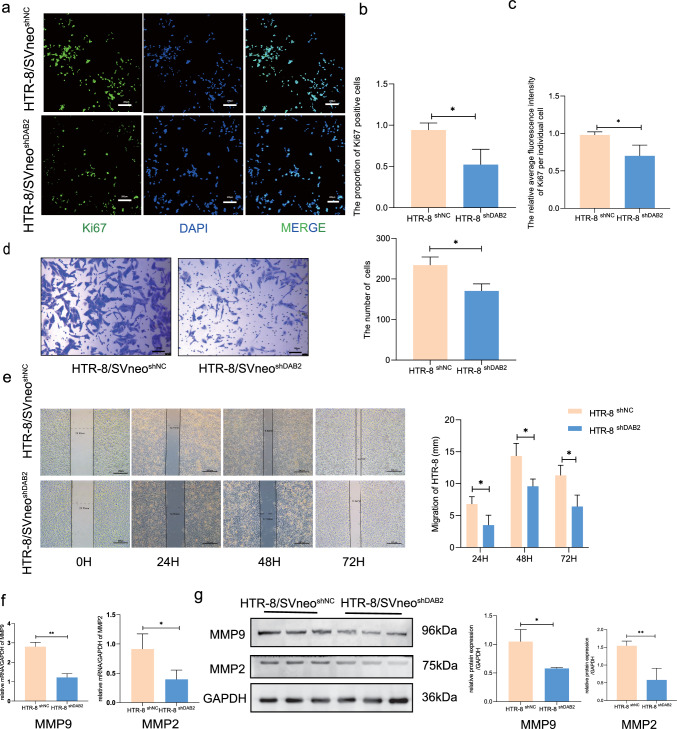
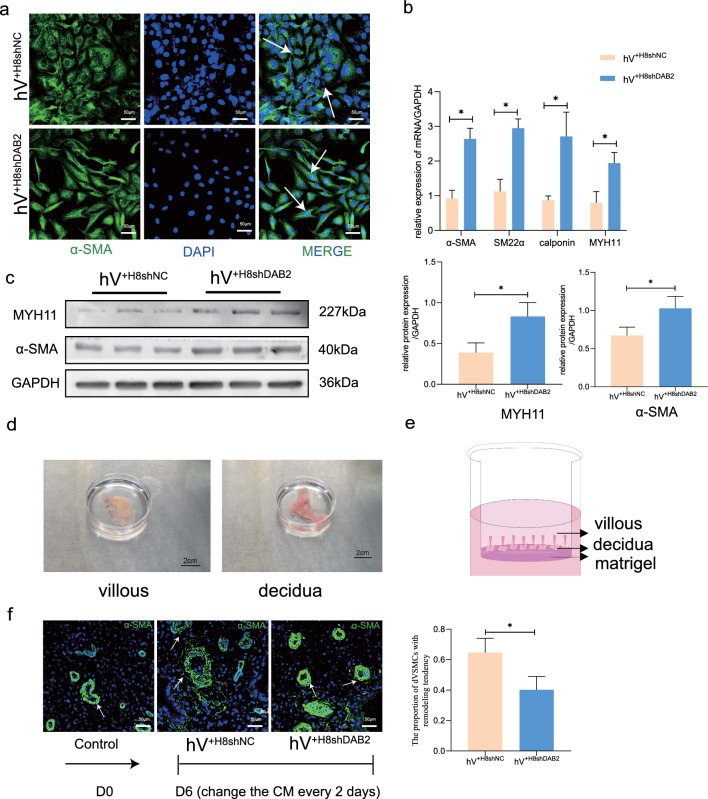
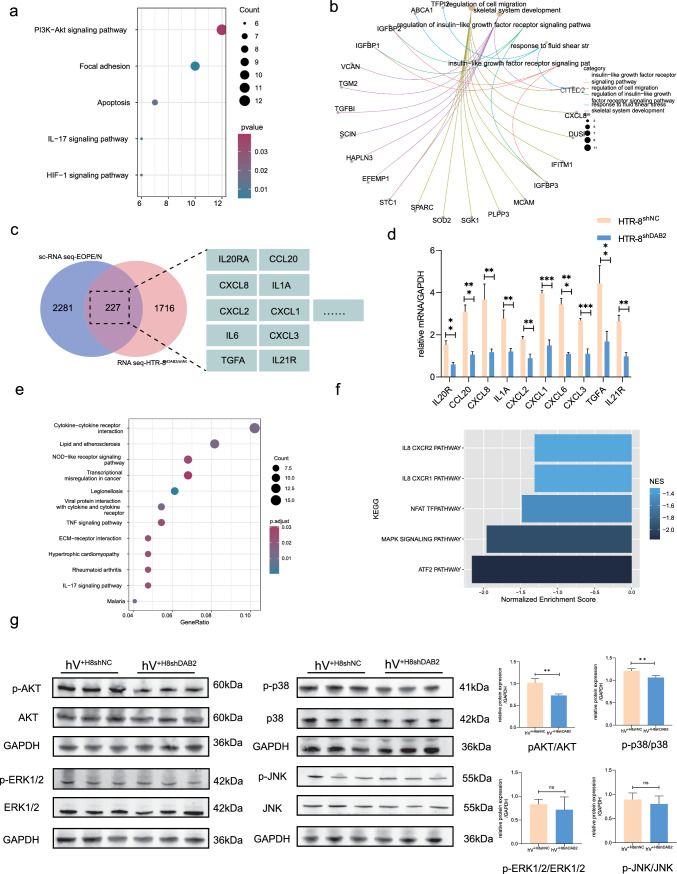
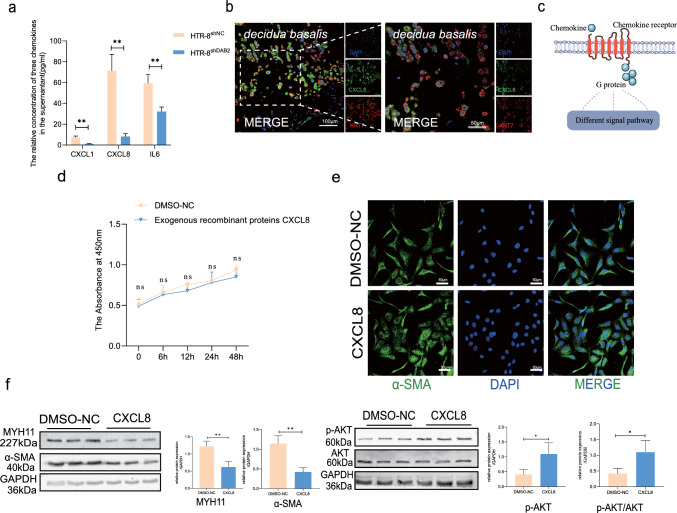
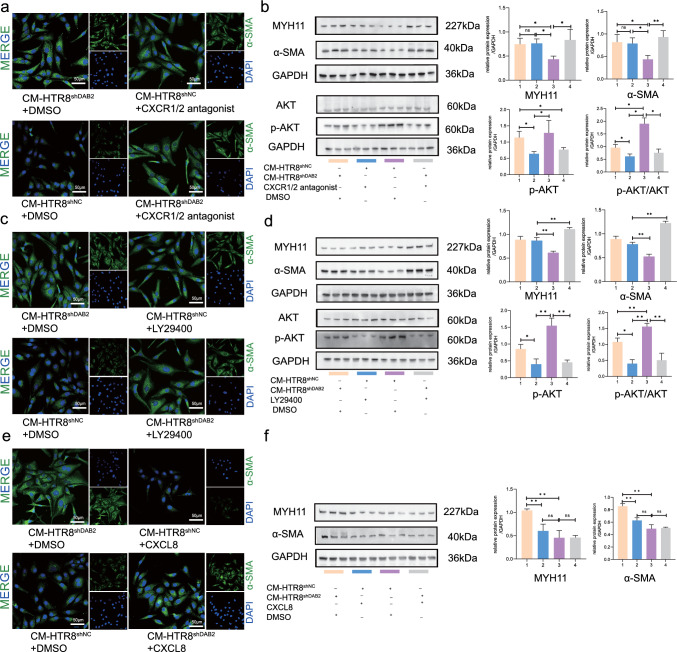
Aberrant remodeling of uterine spiral arteries (SPA) is strongly associated with the pathogenesis of early-onset preeclampsia (EOPE). However, the complexities of SPA transformation remain inadequately understood. We conducted a single-cell RNA sequencing analysis of whole placental tissues derived from patients with EOPE and their corresponding controls, identified DAB2 as a key gene of interest and explored the mechanism underlying the communication between Extravillous trophoblast cells (EVTs) and decidual vascular smooth muscle cells (dVSMC) through cell models and a placenta-decidua coculture (PDC) model in vitro. DAB2 enhanced the motility and viability of HTR-8/SVneo cells. After exposure to conditioned medium (CM) from HTR-8/SVneoshNC cells, hVSMCs exhibited a rounded morphology, indicative of dedifferentiation, while CM-HTR-8/SVneoshDAB2 cells displayed a spindle-like morphology. Furthermore, the PDC model demonstrated that CM-HTR-8/SVneoshDAB2 was less conducive to vascular remodeling. Further in-depth mechanistic investigations revealed that C-X-C motif chemokine ligand 8 (CXCL8, also known as IL8) is a pivotal regulator governing the dedifferentiation of dVSMC. DAB2 expression in EVTs is critical for orchestrating the phenotypic transition and motility of dVSMC. These processes may be intricately linked to the CXCL8/PI3K/AKT pathway, underscoring its central role in intricate SPA remodeling.

Keywords: CXCL8; DAB2; Early-onset preeclampsia; Spiral artery remodeling.


Conflict of interest statement

There are no competing financial or nonfinancial interests regarding this work.

Figures

Fig. 1
Fig. 1
Single-Cell RNA Sequencing Analysis of EOPE Compared with Matched Control Gestation. a A schematic representation of the single-cell RNA sequencing analysis conducted on the placenta from EOPE and its corresponding control gestation. b A Uniform Manifold Approximation Plot (UMAP) showcasing individual cells, each distinguished by its specific cell type through unique coloring. c Dot plots illustrating the expression levels of recognized lineage markers in conjunction with co-expressed lineage-specific genes. d A heatmap that delineates the marker genes present across different trophoblast categories, encompassing EVT, VCT1s, VCT2, VCT3, SCT, and preSCT. e Go-biologicalanalysis of DEGs-downregulated in EVTs picked up the cell communication, multicellular organismal, and cell adhesion three biological processes. f The major enriched genes in three biological signaling functions in Fig. 1e. DAB2 was picked up for further research. g The enriched KEGG pathways of the DEGs- downregulated in VSMCs of EOPE compared with matched control gestation
Fig. 2
Fig. 2
Localization and Expression of DAB2 in First-Trimester Villi, Early-Onset Preeclamptic, and Control Group decidua basalis. a DAB2 is localized in the cytrophoblast column of first-trimester villi. The brown signal denotes a positive DAB2 expression at this location (bar = 100 μm, 50 μm), n = 6. b KRT7 marks the extravillous trophoblast cells in decidua. DAB2, indicated by the green fluorescence, is localized within the cytoplasm of extravillous trophoblast cells in first-trimester decidua (bar = 100 μm, 50 μm), n = 6. c Immunofluorescence (IF) was utilized to compare the DAB2 expression between EOPE and gestational-matched normal pregnant decidua basalis. The results revealed a weaker fluorescence intensity in the EOPE group compared to the control group (NC vs EOPE: 1.734 ± 0.27 vs 1.064 ± 0.26, p** < 0.01). This suggests a down-regulation of DAB2 expression in the EVT of the EOPE group (bar = 100 μm, 50 μm), n = 6. d qRT-PCR analysis of DAB2 and HLA-G mRNA expression in lysates from decidua basalis tissues from 6–7th week, 8–9th week, 28–32th week to 37–39th week, n = 6. Above all each bar represents the mean ± SD, n = 6
Fig. 3
Fig. 3
Knockdown of DAB2 Impedes Survival and Migration Functions of HTR-8/SVneo Cells. a Ki67 staining assay was used to detect the survival of HTR-8/SVneo cells. The HTR-8/SVneoshNC group exhibited denser green fluorescence than the HTR-8/SVneo shDAB2 group, indicating that DAB2 knockdown diminishes HTR-8/SVneo proliferation. b The proportion of Ki67-positive HTR-8/SVneo cells (HTR-8/SVneo shNC vs HTR-8/SVneo shDAB2: 0.94 ± 0.09 vs 0.52 ± 0.19, p* < 0.05), n = 3. c The relative average fluorenscence intensity of Ki67 per individual HTR-8/SVneo cells (HTR-8/SVneo shNC vs HTR-8/SVneo shDAB2: 0.98 ± 0.04 vs 0.70 ± 0.15), n = 3. d Transwell assay wasused to detected the cell migration. HTR-8/SVneoshNC group displayed a higher count of migrated cells than HTR-8/SVneoshDAB2 group (HTR-8/SVneo shNC vs HTR-8/SVneo shDAB2: 234 ± 20 vs 170.3 ± 17.56, bar = 200 μm, p* < 0.05). e The scratch assay was performed to track cell migration over intervals of 24, 48, and 72 h. HTR-8/SVneoshNC group consistently exhibited greater migration distances than HTR-8/SVneoshDAB2 group in 24, 48 and 72 h, suggesting DAB2's role in enhancing HTR-8/SVneo cell migration (HTR-8/SVneoshNC vs HTR-8/SVneoshDAB2: 24H: 5.117 ± 1.355 vs 3.947 ± 0.684; 48H: 9.58 ± 1.012 vs 6.3 ± 1.72; 72H: 13.037 ± 2.16 vs 9.86 ± 0.931, bar = 200 μm, all p** < 0.01). f qRT-PCR showed that the mRNA level of MMP2 and MMP9 expression were decreased in HTR-8/SVneoshDAB2 group (mRNA level: HTR-8/SVneoshNC vs HTR-8/SVneoshDAB2: MMP2: 0.91 ± 0.3 vs 0.4 ± 0.16, p* < 0.05; MMP9: 2.80 ± 0.23 vs 1.22 ± 0.20, p** < 0.01). g Western blotting (WB) showed that the protein level of MMP2 and MMP9 expression were decreased in HTR-8/SVneoshDAB2 group (protein level: HTR-8/SVneoshNC vs HTR-8/SVneoshDAB2: MMP2: 1.55 ± 0.13 vs 0.4 ± 0.16, p* < 0.05; MMP9: 1.05 ± 0.21 vs 0.58 ± 0.02, p** < 0.01)
Fig. 4
Fig. 4
DAB2 in HTR-8/SVneo Facilitates hVSMCs Phenotypic Transition and Modulates SPA Remodeling. a Cell immunofluorescent staining of α-SMA in hVSMCs, which treated with the different group CM-HTR-8/SVneo (hV+H8shNC group and hV+H8shDAB2 group), for investigate the effect of DAB2 differences in trophoblast cells on hVSMCs. The cells in hV+H8shDAB2 group remain hold the spindle shape, and the hV+H8NC group turned to round shape, as the white arrows indicated. bar = 200 μm. b The relative mRNA level (calponin, MYH-11, α-SMA and SM22α) were detected by qRT-PCR. The contractile indicators in hV+H8shNC group were lower than hV+H8shDAB2 group, which means that the DAB2 in trophoblasts could switch hVSMCs phenotype (hV+H8shNC vs hV+H8shDAB2: calponin: 0.871 ± 0.122 vs 2.7 ± 0.702; MYH-11: 0.797 ± 0.324 vs 1.941 ± 0.306; α-SMA: 0.921 ± 0.236 vs 2.638 ± 0.309; SM22α: 1.125 ± 0.349 vs 2.947 ± 0.27, all p* < 0.05). c The relative protein level (MYH-11, α-SMA) were detected by WB. The contractile indicators in CM of HTR-8/SVneo were lower than the hV+H8shDAB2 group (hV+H8shNC vs hV+H8shDAB2: MYH-11: 0.389 ± 0.118 vs 0.8315 ± 0.098; α-SMA: 0.672 ± 0.11 vs 1.029 ± 0.157, all p* < 0.05). d Images of the villi and decidua in the first trimester. e Schematic representation of the PDC model system. f Immunofluorescent staining of the dedicua tissue in co-cultured villous-decidua model with different conditioned media treatments. α-SMA-positive (green) represent the VSMC of spiral artery vascular. bar = 50 μm. Samples were were acquired from 12 pregnant women. The statistical analysis is performed based on the record from five cases for each section and five random views in each case. The proportions of remodeling are as follows: (hV+H8shNC vs hV+H8shDAB2: 0.647 ± 0.09 vs 0.403 ± 0.087, p* < 0.05)
Fig. 5
Fig. 5
Comprehensive Discovery of Target Genes Modulating HTR-8/SVneo Function and the Mediators Governing hVSMCs Reprogramming. a KEGG enrichment pathway analysis of the intersection gene of down regulated genes in HTR-8/SVneoshDAB2 group of RNAseq and EVT genes in sc-RNA seq. b The enrichment circle figure showed that these co-down-regulated genes were enriched in insulin-like growth factor receptor signaling pathway and other pathways, which related with the cell survival and motility. c Intersection of downregulated genes from HTR-8/SVneo RNA-seq and EVT from scRNA-seq. Ten distinctly different chemokines and inflammatory factors potentially involved in the regulation of the maternal–fetal interface were selected for further enrichment analysis. d The mRNA level of chemokine and inflammatory factors were decreased in HTR-8/SVneoshDAB2 group then verified by qRT-PCR. ( HTR-8shNC vs HTR-8shDAB2: IL20R: 1.525 ± 0.193 vs 0.594 ± 0.093; CCL20: 3.442 ± 0.286; CXCL8: 3.670 ± 0.737 vs 1.177 ± 0.1521, IL1A: 2.771 ± 0.407 vs 1.207 ± 0.143, CXCL2: 1.795 ± 0.131 vs 0.889 ± 0.198; CXCL1: 3.098 ± 0.318 vs 1.062 ± 0.143; IL6: 3.951 ± 0.154 vs 1.498 ± 0.262 vs 1.099 ± 0.063; CXCL3: 2.676 ± 0.108 vs 1.105 ± 0.226; TGFA: 4.436 ± 0.853 vs 1.681 ± 0.486; IL21R: 2.641 ± 0.286 vs 0.977 ± 0.183, p* < 0.05, p** < 0.01). e Go biological analysis of co-downregulated genes in hV+H8shDAB2 group of hVSMCs RNA seq and PV of sc-RNA seq. f GSEA KEGG enrichment analysis of co-down-regulated genes in hV+H8shDAB2 group of hVSMCs RNA seq and PV of sc-RNA seq. The enrichment analysis of GSEA KEGG signaling pathway showed that IL8 CXCR1/2 signaling pathway, and MAPK signaling pathway were down-regulated by analyzing the differential gene expression levels of co-down-regulated genes in hV+H8shDAB2 group of hVSMC RNA seq and PV of sc-RNA seq. g After hVSMC was co-cultured with medium supernatants from different groups, WB was used to detect important molecules (AKT, p-AKT, p38, p-p38, p-ERK1/2, ERK1/2, p-JNK, JNK) in both pathways. The results showed that only PI3K/AKT pathway and p-p38 MAPK pathway were significantly different (hV+H8shNC vs hV+H8shDAB2: p-AKT/AKT: 1.02 ± 0.09 vs 0.73 ± 0.03, p** < 0.01; p-p38/p38: 1.211 ± 0.05 vs 1.062 ± 0.04, p* < 0.05; p-ERK1/2/ERK1/2: 0.083 ± 0.11 vs 0.715 ± 0.27, p = 0.53; p-JNK/JNK: 0.893 ± 0.14 vs 0.80 ± 0.17, p = 0.49; n = 3)
Fig. 6
Fig. 6
CXCL8 was expressed in trophoblast and could modulate hVSMCs dedifferentiation. a The relative concentration of CXCL1, CXCL8 and IL-6 in supernatant of HTR-8/SVneoshNC and HTR-8/SVneoshDAB2 were detected by Elisa analysis. The relative concentration expression of CXCL1, IL-6 and CXCL8 were exhibited. (HTR-8shNC vs HTR-8shDAB2: CXCL1: 7.313 ± 1.315 vs 1.164 ± 0.417, p** < 0.01; CXCL8: 71.29 ± 15.9 vs 8.164 ± 2.765, p** < 0.01; IL6: 59.49 ± 8.166 vs 32.19 ± 4.315, p** < 0.01, respectively). b CXCL8 (The green fluorensecen) was expressed in first trimester decidua basalis and located in EVTs (KRT7+ represents EVT cells in decidua). c Schematic representation illustrating the interaction of chemokines with seven-transmembrane G-protein-coupled receptors, leading to G-protein subunit dissociation, activation of signaling pathways, and subsequent cellular function modulation. d CCK8 cytotoxicity assay was performed at 6 h, 12 h, 24 h and 48 h time points, and there was no significant difference between them (DMSO-NC vs CXCL8: 0 h: 0.52 ± 0.06 vs 0.49 ± 0.05; 6 h: 0.67 ± 0.07 vs 0.65 ± 0.06; 12 h: 0.74 ± 0.04 vs 0.68 ± 0.06; 24 h: 0.78 ± 0.06 vs 0.79 ± 0.10; 48 h: 0.93 ± 0.05 vs 0.88 ± 0.06; p > 0.05). n = 6. e A morphological shift towards a rounded cell shape was observed after been treated with CXCL8, whereas cells in the DMSO control group maintained a spindle shape. f The dedifferentiation marker (MYH-11 and α-SMA) were examined by western-blot analysis. The protein expression of MYH-11 and α-SMA were decreased (DMSO-NC vs CXCL8: MYH-11: 1.222 ± 0.151 vs 0.619 ± 0.153, p** < 0.01; α-SMA: 1.145 ± 0.203 vs 0.424 ± 0.111, p** < 0.01) when treated with exogenous recombinant protein CXCL8, which means that CXCL8 could promote hVSMCs dedifferentiation and might participate in the process of spiral artery remodeling. AKT and pAKT were important indexes in the PI3K/AKT pathway. After treatment with CXCL8, the pAKT expression was increased and indicated that CXCL8 could activate PI3K signal pathway (DMSO-NC vs CXCL8: p-AKT: 0.4129 ± 0.168 vs 1.095 ± 0.379, p* < 0.05; p-AKT/AKT: 0.4126 ± 0.167 vs 1.096 ± 0.379, p* < 0.05)
Fig. 7
Fig. 7
DAB2 in EVTs mediated CXCL8/PI3K/AKT pathway regulating hVSMC dedifferentiation. a Cell immunofluorescent staining of α-SMA in hVSMCs, which treated with the above four different supernatant to investigate the hVSMCs morphology four find out the effect on hVSMC dedifferentiation. CXCR1/2 antagonist could inhibit the function of CXCL8. When treated with the CXCR1/2 antagonist, hVSMC morphology remain spindle in CM-HTR/8-SVneoshNC and CM-HTR/8-SVneoshDAB2 group. The CM-HTR/8-SVneoshNC + DMSO group hVSMC turn to round and consistent with the previous results. At the same time, the CM-HTR/8-SVneoshDAB2 + DMSO group hVSMC remain spindle shape. b The relative protein level (MYH-11, α-SMA) were detected by WB. The contractile indicators were not downregulated after co-cultured with CXCR1/2 antagonist. The CM-HTR/8-SVneoshNC + DMSO group find that could promote hVSMC dedifferentiation (CM-HTR/8-SVneoshDAB2 + DMSO vs CM-HTR/8-SVneoshNC + CXCR1/2 antagonist vs CM-HTR/8-SVneoshNC + DMSO group vs CM-HTR-8/SVneoshDAB2 + CXCR1/2 antagonist: MYH-11: 1.011 ± 0.245 vs 0.924 ± 0.1422 vs 0.583 ± 0.054 vs 1.294 ± 0.029, p* < 0.05; α-SMA: 1.162 ± 0.223 vs 0.983 ± 0.101 vs 0.611 ± 0.014 vs 1.291 ± 0.147, p* < 0.05, p** < 0.01). Moreover, AKT and pAKT two molecular in PI3K pathway were detected by WB analysis (CM-HTR/8-SVneoshDAB2 + DMSO vs CM-HTR/8-SVneoshNC + CXCR1/2 antagonist vs CM-HTR/8-SVneoshNC + DMSO group vs CM-HTR-8/SVneoshDAB2 + CXCR1/2 antagonist: p-AKT: 1.141 ± 0.192 vs 0.639 ± 0.068 vs 1.283 ± 0.383 vs 0.767 ± 0.064, p* < 0.05; p-AKT/AKT: 0.959 ± 0.1278 vs 0.616 ± 0.094 vs 1.903 ± 0.230 vs 0.7575 ± 0.1468, p* < 0.05). n = 3. c Cell immunofluorescent staining of α-SMA in hVSMCs, which treated with the above four different supernatant to investigate the hVSMC morphology four find out the effect on hVSMCs dedifferentiation. When treated with the LY29400, hVSMCs morphology remain spindle in CM-HTR/8-SVneoshNC and CM-HTR/8-SVneoshDAB2 group. The CM-HTR/8-SVneoshNC + DMSO group hVSMC turn to round and consistent with the previous results. At the same time, the CM-HTR/8-SVneoshDAB2 + DMSO group hVSMCs remain spindle. d The relative protein level (MYH-11, α-SMA) were detected by WB. The contractile indicators were not downregulated after co-cultured with LY29400 (CM-HTR/8-SVneoshDAB2 + DMSO vs CM-HTR/8-SVneoshNC + LY29400 vs CM-HTR/8-SVneoshNC + DMSO group vs CM-HTR-8/SVneoshDAB2 + LY29400: MYH-11: 0.890 ± 0.071 vs 0.870 ± 0.066 vs 0.616 ± 0.030 vs 1.11 ± 0.032, p** < 0.01; α-SMA: 0.890 ± 0.061 vs 0.782 ± 0.041 vs 0.525 ± 0.049 vs 1.22 ± 0.040, p** < 0.01). pAKT was decreased when treated with LY29400 (CM-HTR/8-SVneoshDAB2 + DMSO vs CM-HTR/8-SVneoshNC + LY29400 vs CM-HTR/8-SVneoshNC + DMSO group vs CM-HTR-8/SVneoshDAB2 + LY29400: p-AKT: 0.875 ± 0.094 vs 0.379 ± 0.139 vs 1.592 ± 0.344 vs 0.523 ± 0.034, p* < 0.05, p** < 0.01; p-AKT/AKT: 1.079 ± 0.1215 vs 0.399 ± 0.127 vs 1.560 ± 0.099 vs 0.508 ± 0.2168, p* < 0.05). n = 3. e In order to further verify the critical role of CXCL8, exogenous factors of CXCL8 were added to different supernatants to observe whether CXCL8 could restore the dedifferentiated phenotype of the supernatant in the CM-HTR-8/SVneoshDAB2 group. The results showed that after CXCL8 was added to the supernatant in the knockout group, the cells turned round. The results suggest that CXCL8 is one of the key factors in dedifferentiation of hVSMC. f Consistent with the results of cell fluorescence, the differentiation index decreased after the addition of CXCL8 (CM-HTR/8-SVneoshDAB2 + DMSO vs CM-HTR/8-SVneoshNC + CXCL8 vs CM-HTR/8-SVneoshNC + DMSO group vs CM-HTR-8/SVneoshDAB2 + CXCL8: MYH-11: 1.044 ± 0.032 vs 0.603 ± 0.145 vs 0.457 ± 0.155vs 0.460 ± 0.047, p** < 0.01; α-SMA: 0.858 ± 0.042 vs 0.629 ± 0.042 vs 0.493 ± 0.066 vs 0.508 ± 0.012, p** < 0.01, ns means there was no difference between them). n = 3

Similar articles

Cited by

References

    1. Graham JB, Christopher WR, James MR, Ashley M. Pre-eclampsia: pathophysiology and clinical implications. BMJ. 2019;366:l2381. - PubMed
    1. Gardiner C, Vatish M. Impact of haemostatic mechanisms on pathophysiology of preeclampsia. Thromb Res. 2017;151(Suppl 1):S48–S52. doi: 10.1016/S0049-3848(17)30067-1. - DOI - PubMed
    1. Roberts JM, Rich-Edwards JW, McElrath TF, Garmire L, Myatt L. Subtypes of preeclampsia: recognition and determining clinical usefulness. Hypertension. 2021;77(5):1430–1441. doi: 10.1161/HYPERTENSIONAHA.120.14781. - DOI - PMC - PubMed
    1. Gupta AK, Gebhardt S, Hillermann R, Holzgreve W, Hahn S. Analysis of plasma elastase levels in early and late onset preeclampsia. Arch Gynecol Obstet. 2006;273(4):239–242. doi: 10.1007/s00404-005-0093-z. - DOI - PubMed
    1. Gogoi P, Sinha P, Gupta B, Firmal P, Rajaram S. Neutrophil-to-lymphocyte ratio and platelet indices in pre-eclampsia. Int J Gynaecol Obstet. 2019;144(1):16–20. doi: 10.1002/ijgo.12701. - DOI - PubMed

Substances

LinkOut - more resources