. 2024 Jun:170:35-45.
doi: 10.1016/j.molimm.2024.04.002. Epub 2024 Apr 12.

SHIP inhibition mediates select TREM2-induced microglial functions

Affiliations

SHIP inhibition mediates select TREM2-induced microglial functions

Gautham S Ramakrishnan et al. Mol Immunol. 2024 Jun.

Abstract

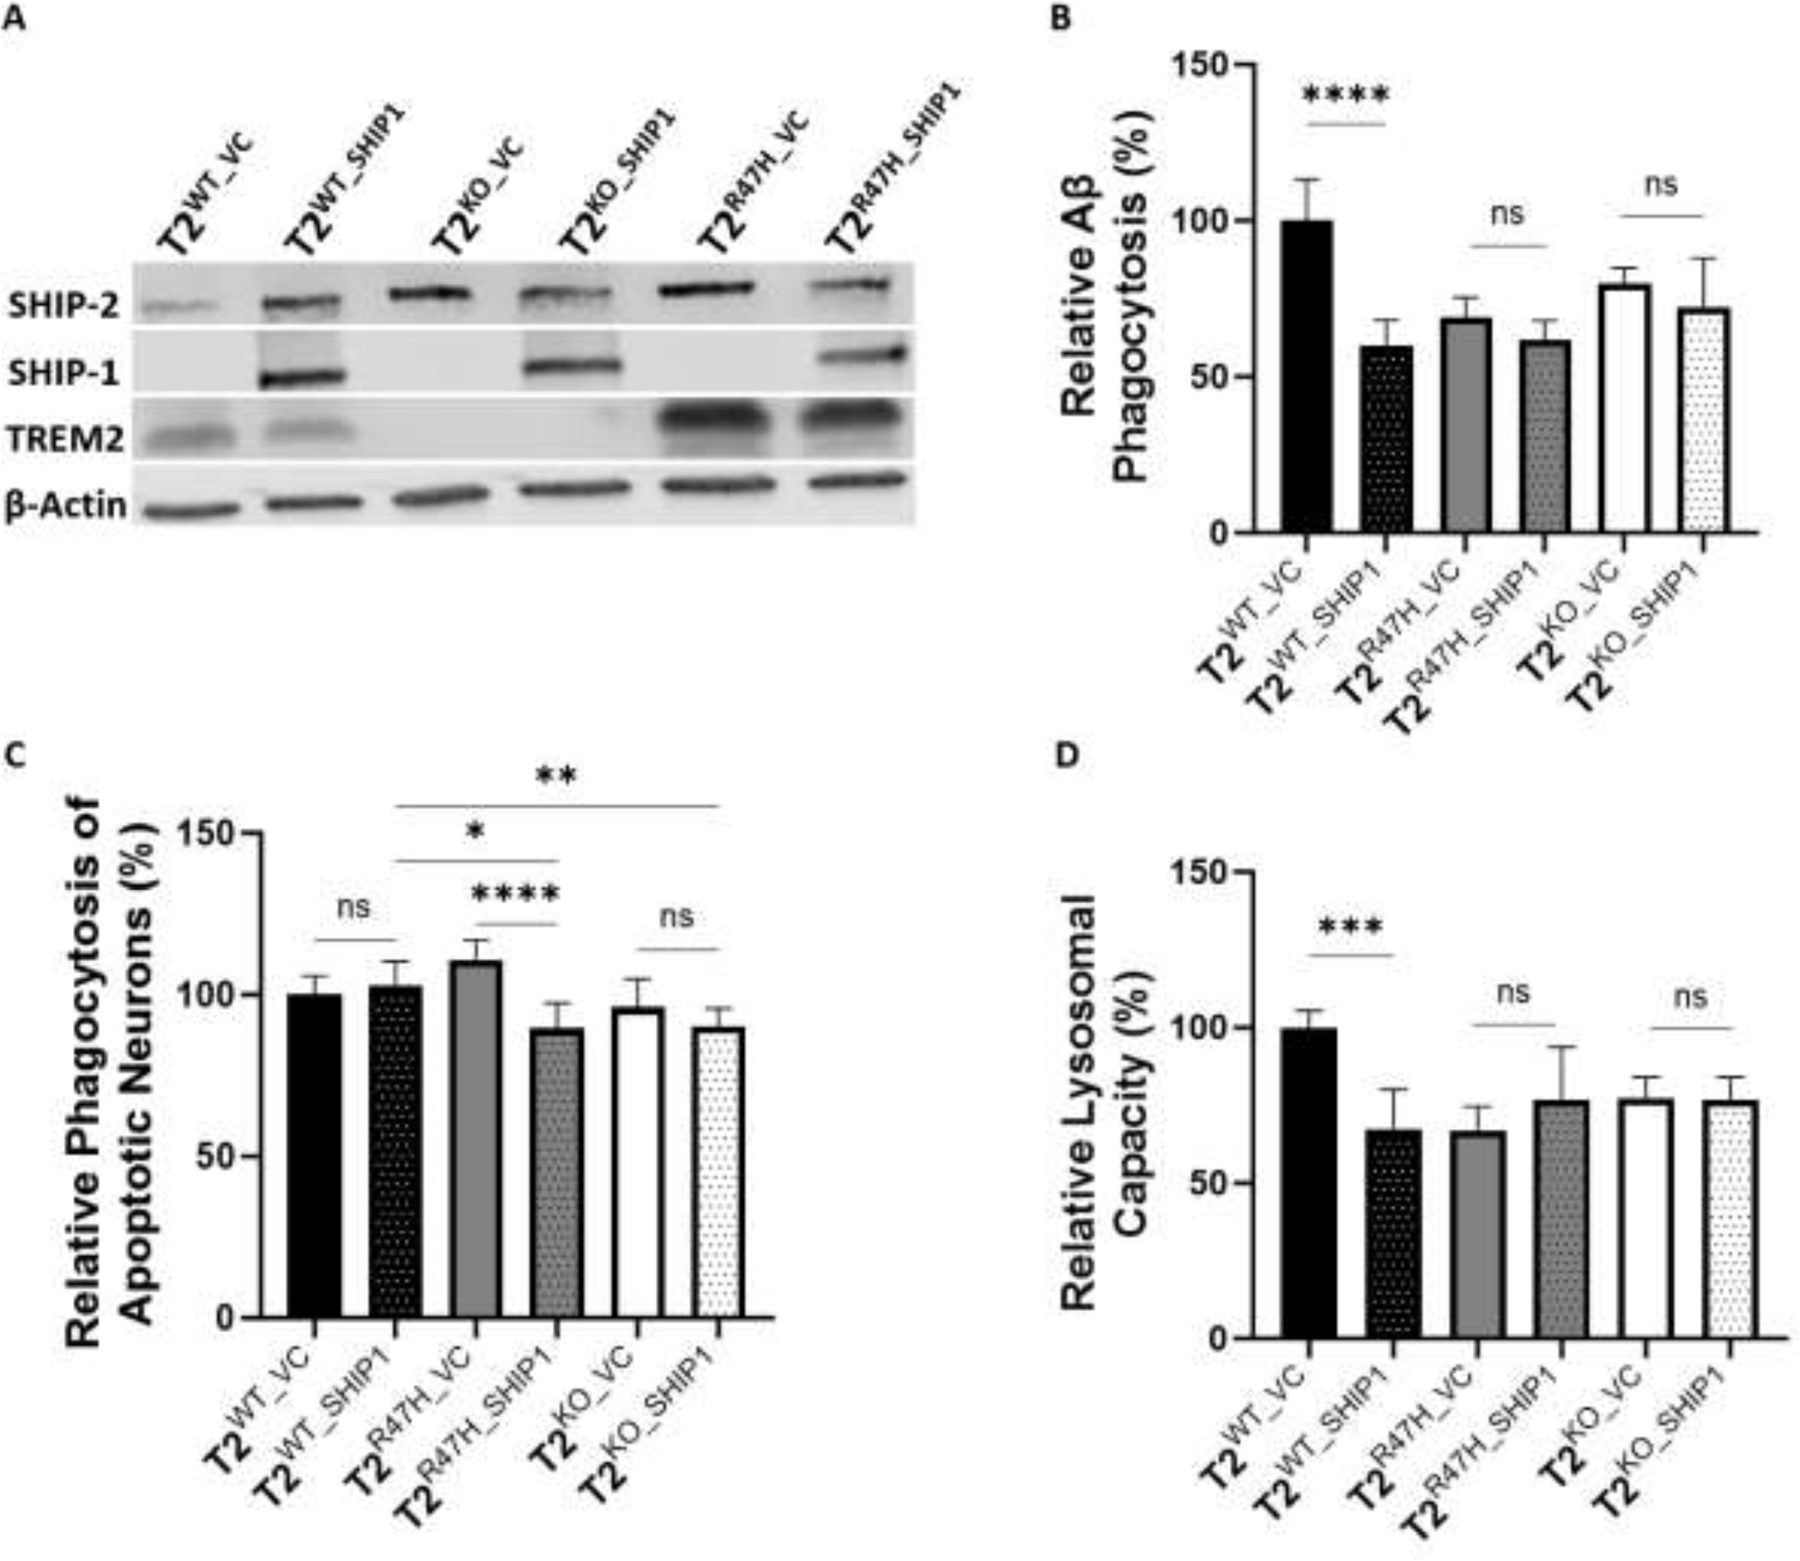
Microglia play a pivotal role in the pathology of Alzheimer's Disease (AD), with the Triggering Receptor Expressed on Myeloid cells 2 (TREM2) central to their neuroprotective functions. The R47H variant of TREM2 has emerged as a significant genetic risk factor for AD, leading to a loss-of-function phenotype in mouse AD models. This study elucidates the roles of TREM2 in human microglia-like HMC3 cells and the regulation of these functions by SH2-containing inositol-5'-phosphatase 1 (SHIP1). Using stable cell lines expressing wild-type TREM2, the R47H variant, and TREM2-deficient lines, we found that functional TREM2 is essential for the phagocytosis of Aβ, lysosomal capacity, and mitochondrial activity. Notably, the R47H variant displayed increased phagocytic activity towards apoptotic neurons. Introducing SHIP1, known to modulate TREM2 signaling in other cells, revealed its role as a negative regulator of these TREM2-mediated functions. Moreover, pharmacological inhibition of both SHIP1 and its isoform SHIP2 amplified Aβ phagocytosis and lysosomal capacity, independently of TREM2 or SHIP1 expression, suggesting a potential regulatory role for SHIP2 in these functions. The absence of TREM2, combined with the presence of both SHIP isoforms, suppressed mitochondrial activity. However, pan-SHIP1/2 inhibition enhanced mitochondrial function in these cells. In summary, our findings offer a deeper understanding of the relationship between TREM2 variants and SHIP1 in microglial functions, and emphasize the therapeutic potential of targeting the TREM2 and SHIP1 pathways in microglia for neurodegenerative diseases.

Keywords: Alzheimer’s disease; Microglia; Phagocytosis; SHIP inhibitors; SHIP1; TREM2.


Conflict of interest statement

Declaration of Competing Interest WGK, CP and JDC have patents issued and pending regarding the use of SHIP paralog inhibitors in disease. The other authors declare no conflict of interest.

Figures

Fig 1.
Fig 1.
TREM2 regulates phagocytosis in HMC3 cells. (A) Cell lysates from HMC3 T2KO cells stably transfected with either WT or R47H mutant human TREM2 were analyzed for TREM2 expression by Western blotting. β-actin was used as a loading control. (B) T2R47H and T2KO cells exhibit diminished Aβ phagocytosis compared to T2WT cells. Phagocytosis of Aβ1–42APC by HMC3 clones at 8 hours was measured as the MFI of intracellular Aβ1–42APC using flow cytometry. This data is from 3 independent experiments each normalized to T2WT and performed with 3 technical replicates. Statistical tests: Brown-Forsythe and Welch’s ANOVA with Dunnett’s T3 multiple comparison test. ***p= 0.0003, **p= 0.0075. (C-D) T2R47H cells exhibit increased phagocytosis of apoptotic neurons compared to and T2WT and T2KO cells. (C) Gating strategy to identify CellTrace Violet stained microglial cells that have phagocytosed Zombie Red dye stained apoptotic neurons. (D) Phagocytic uptake of apoptotic neurons was carried out for 8 hours and was measured as percentage of Zombie+ HMC3 cells to total HMC3 cells. This data is from 3 independent experiments each normalized to T2WT and performed with 3 technical replicates. Statistical tests: Brown-Forsythe and Welch’s ANOVA with Dunnett’s T3 multiple comparison test. **p=0.0083, *p=0.0103.
Fig 2.
Fig 2.
TREM2 regulates lysosomal capacity and mitochondrial function in HMC3 cells. (A-B) T2R47H and T2KO cells have decreased lysosomal capacity compared to T2WT cells. (A) Lysosomal capacity was measured as the MFI of LysoTracker Red internalized in cells using flow cytometry. This data is from 3 independent experiments each normalized to T2WT and performed with 3 technical replicates. Statistical tests: Brown-Forsythe and Welch’s ANOVA with Dunnett’s T3 multiple comparison test. ****p<0.0001. (B) Lysosomes were visualized by imaging the LysoTracker Red + puncta in cells using imaging flow cytometry. (C) Mitochondrial respiratory activity was diminished in T2R47H and T2KO cells compared to T2WT cells. Mitochondrial activity was determined by measuring changes to cellular oxygen consumption rate after sequential injection of mitochondrial electron transport chain inhibitors (oligomycin and rotenone + antimycin A) and the mitochondrial uncoupling agent carbonyl cyanide-4-(trifluoromethoxy)phenylhydrazone (FCCP). This data is from 3 independent experiments each normalized to T2WT and performed with at least 5 technical replicates. (D) T2R47H and T2KO cells have a lower basal OCR than T2WT cells. Basal OCR was calculated by subtracting the non-mitochondrial OCR (after rotenone/ antimycin A injection) from the OCR at baseline. Statistical tests: Brown-Forsythe and Welch’s ANOVA with Dunnett’s T3 multiple comparison test. ****p<0.0001, ***p=0.0010. (E) T2R47H and T2KO cells have diminished ATP production compared to T2WT cells. ATP production is calculated by subtracting the OCR after oligomycin treatment from the basal OCR. Statistical tests: Brown-Forsythe and Welch’s ANOVA with Dunnett’s T3 multiple comparison test. ****p<0.0001. (F) T2R47H and T2KO cells have a reduced spare respiratory capacity (SRC) than T2WT cells. SRC is the ability of the cell to respond to energy demands and is calculated by subtracting basal OCR from the maximal OCR after treatment with FCCP. Statistical tests: Brown-Forsythe and Welch’s ANOVA with Dunnett’s T3 multiple comparison test. ****p<0.0001.
Fig 3.
Fig 3.
SHIP1 expression regulates phagocytosis and lysosomal capacity in HMC3 cells in a TREM2-dependent manner. (A) Expression of SHIP1 was identified by Western blotting in cell lysates from HMC3 T2WT, T2R47H and T2KO cells stably transfected with either SHIP1 or vector control (VC). β-actin was used as a loading control. (B) SHIP1 expression results in decreased phagocytosis of Aβ in T2WT cells but not in T2R47H and T2KO cells. Phagocytosis was carried out for 8 hours and measured as the MFI of Aβ1–42APC using flow cytometry. This data is from 3 independent experiments each normalized to T2WT_VC and performed with 3 technical replicates. Statistical tests: Brown-Forsythe and Welch’s ANOVA with Dunnett’s T3 multiple comparison test. ****p<0.0001. (C) SHIP1 expression decreases phagocytic uptake of apoptotic neurons in T2R47H cells but not in T2WT and T2KO cells. Phagocytic uptake of apoptotic neurons was carried out for 8 hours and was measured as percentage of Zombie+ HMC3 cells to total HMC3 cells. This data is from 3 independent experiments each normalized to T2WT_VC and performed with 3 technical replicates. Statistical tests: Brown-Forsythe and Welch’s ANOVA with Dunnett’s T3 multiple comparison test. ****p<0.0001, **p=0.0062, *p=0.0103–0.0129. (D) SHIP1 expression results in a diminished lysosomal capacity in T2WT cells but not in T2R47H and T2KO cells. Lysosomal capacity was measured as the MFI of LysoTracker Red internalized in cells using flow cytometry. This data is from 3 independent experiments each normalized to T2WT_VC and performed with 3 technical replicates. Statistical tests: Brown-Forsythe and Welch’s ANOVA with Dunnett’s T3 multiple comparison test. ***p=0.0001.
Fig 4.
Fig 4.
SHIP1 reduces mitochondrial activity of HMC3 cells in a TREM2-dependent manner. (A) Mitochondrial respiratory activity is decreased because of SHIP1 expression in T2WT and T2R47H but not T2KO cells. Mitochondrial function was measured as described previously using a Seahorse XF analyzer. This data is from 3 independent experiments each normalized to T2WT_VC and performed with at least 5 technical replicates. (B) Basal OCR is lower in T2WT_SHIP1 and T2R47H_SHIP1 cells but remains largely unchanged in T2KO_SHIP1 cells compared to their respective vector controls. Statistical tests: Brown-Forsythe and Welch’s ANOVA with Dunnett’s T3 multiple comparison test. ****p<0.0001, *p=0.0105. (C) ATP production is decreased in T2WT_SHIP1 and T2R47H_SHIP1 cells but not in T2KO_SHIP1 cells compared to their respective vector controls. Statistical tests: Brown-Forsythe and Welch’s ANOVA with Dunnett’s T3 multiple comparison test. ****p<0.0001, ***p=0.0003. (D) Spare respiratory capacity (SRC) is decreased in T2WT_SHIP1 and T2R47H_SHIP1 cells but not in T2KO_SHIP1 cells compared to their respective vector controls. Statistical tests: Brown-Forsythe and Welch’s ANOVA with Dunnett’s T3 multiple comparison test. ****p<0.0001, **p=0.0017.
Fig 5.
Fig 5.
Pan SHIP inhibition (K161) modulates microglial functions in HMC3 cells independently of TREM2 and SHIP1. (A) Expression of TREM2, SHIP1 and SHIP2 was identified by Western blotting in cell lysates from 2B4 GFP-NFAT reporter cells stably transfected with TREM2. β-actin was used as a loading control. (B) TREM2 activation was measured as the percentage of GFP+ 2B4 GFP-NFAT reporter cells observed after incubation with an activating anti-TREM2 antibody (Ab), or isotype control Ab (IC), for 2, 4, 6, and 8 hours. Compared to vehicle control (CON), K161 significantly increased GFP expression indicating TREM2 activation. This data is representative of 3 independent experiments, which were performed using 3 technical replicates. Statistical tests: 2-way ANOVA with Tukey’s multiple comparisons test. ****p<0.0001 (C) K161 improves phagocytosis of Aβ in HMC3 cells. Phagocytosis of Aβ1–42APC by HMC3 clones at 8 hours was measured as the MFI of intracellular Aβ1–42APC using flow cytometry. This data is from 3 independent experiments each normalized to T2WT_VC Con and performed with 3 technical replicates. Statistical tests: 2-way ANOVA with Sidak’s multiple comparisons test. ****p<0.0001, ***p=0.0007, **p=0.0059, *p=0.0332. (D) K161 decreases phagocytosis of apoptotic neurons. Phagocytic uptake of apoptotic neurons was carried out for 8 hours and was measured as percentage of Zombie+ HMC3 cells to total HMC3 cells. This data is from 3 independent experiments each normalized to T2WT_VC Con and performed with 3 technical replicates. Statistical tests: 2-way ANOVA with Sidak’s multiple comparisons test. ***p=0.0010–0.0004, **p=0.0013, *p=0.0166. (E) K161 increases lysosomal capacity in HMC3 cells. Lysosomal capacity was measured as the MFI of LysoTracker Red internalized in cells using flow cytometry. This data is from 3 independent experiments each normalized to T2WT_VC Con and performed with 3 technical replicates. Statistical tests: 2-way ANOVA with Sidak’s multiple comparisons test. ****p<0.0001, **p=0.0026.
Fig 6.
Fig 6.
Pan SHIP inhibition (K161) increases mitochondrial activity in a SHIP1 independent manner in TREM2-deficient cells. K161 treatment has no effect on mitochondrial respiratory activity in T2WT cells (A)and T2R47H cells (B) but increases mitochondrial respiratory activity in both T2KO_VC and T2KO_SHIP1 cells (C). Mitochondrial function was measured as described previously following treatment with K161 for 1 hour prior to start of the assay. This data is normalized to T2WT_VC Con and is a representative of 3 independent experiments, which were performed using up to 6 technical replicates. (D) K161 increases basal OCR in T2KO_VC and T2KO_SHIP1 cells. Statistical tests: 2-way ANOVA with Sidak’s multiple comparisons test. ***p=0.0001, ****p<0.0001. (E) K161 increases ATP production in T2KO_VC and T2KO_SHIP1 cells. Statistical tests: 2-way ANOVA with Sidak’s multiple comparisons test. **p=0.0028, **p=0.0036. (F) K161 increases spare respiratory capacity in T2KO_VC and T2KO_SHIP1 cells. Statistical tests: 2-way ANOVA with Sidak’s multiple comparisons test. *p=0.0460, ***p=0.0003.

References

    1. Inppl1 expression in the brain - data available from The Human Protein Atlas (v23) - https://www.proteinatlas.org/ENSG00000165458-INPPL1/single+cell+type/brain. 2023.
    1. Ai J, Maturu A, Johnson W, Wang Y, Marsh CB, Tridandapani S. The inositol phosphatase SHIP-2 down-regulates FcgammaR-mediated phagocytosis in murine macrophages independently of SHIP-1. Blood. 2006;107:813–20.10.1182/blood-2005-05-1841 - DOI - PMC - PubMed
    1. Akhter R, Shao Y, Formica S, Khrestian M, Bekris LM. TREM2 alters the phagocytic, apoptotic and inflammatory response to Abeta(42) in HMC3 cells. Mol Immunol. 2021;131:171–9.10.1016/j.molimm.2020.12.035 - DOI - PMC - PubMed
    1. Association As. 2023. Alzheimer’s disease facts and figures. Alzheimers Dement. 2023;19:1598–695.10.1002/alz.13016 - DOI - PubMed
    1. Atagi Y, Liu CC, Painter MM, Chen XF, Verbeeck C, Zheng H, et al. Apolipoprotein E Is a Ligand for Triggering Receptor Expressed on Myeloid Cells 2 (TREM2). J Biol Chem. 2015;290:26043–50.10.1074/jbc.M115.679043 - DOI - PMC - PubMed

Publication types

MeSH terms

Substances