. 2024 Apr 23;43(4):114058.
doi: 10.1016/j.celrep.2024.114058. Epub 2024 Apr 12.

The nociceptive activity of peripheral sensory neurons is modulated by the neuronal membrane proteasome

Affiliations

The nociceptive activity of peripheral sensory neurons is modulated by the neuronal membrane proteasome

Eric Villalón Landeros et al. Cell Rep. .

Abstract

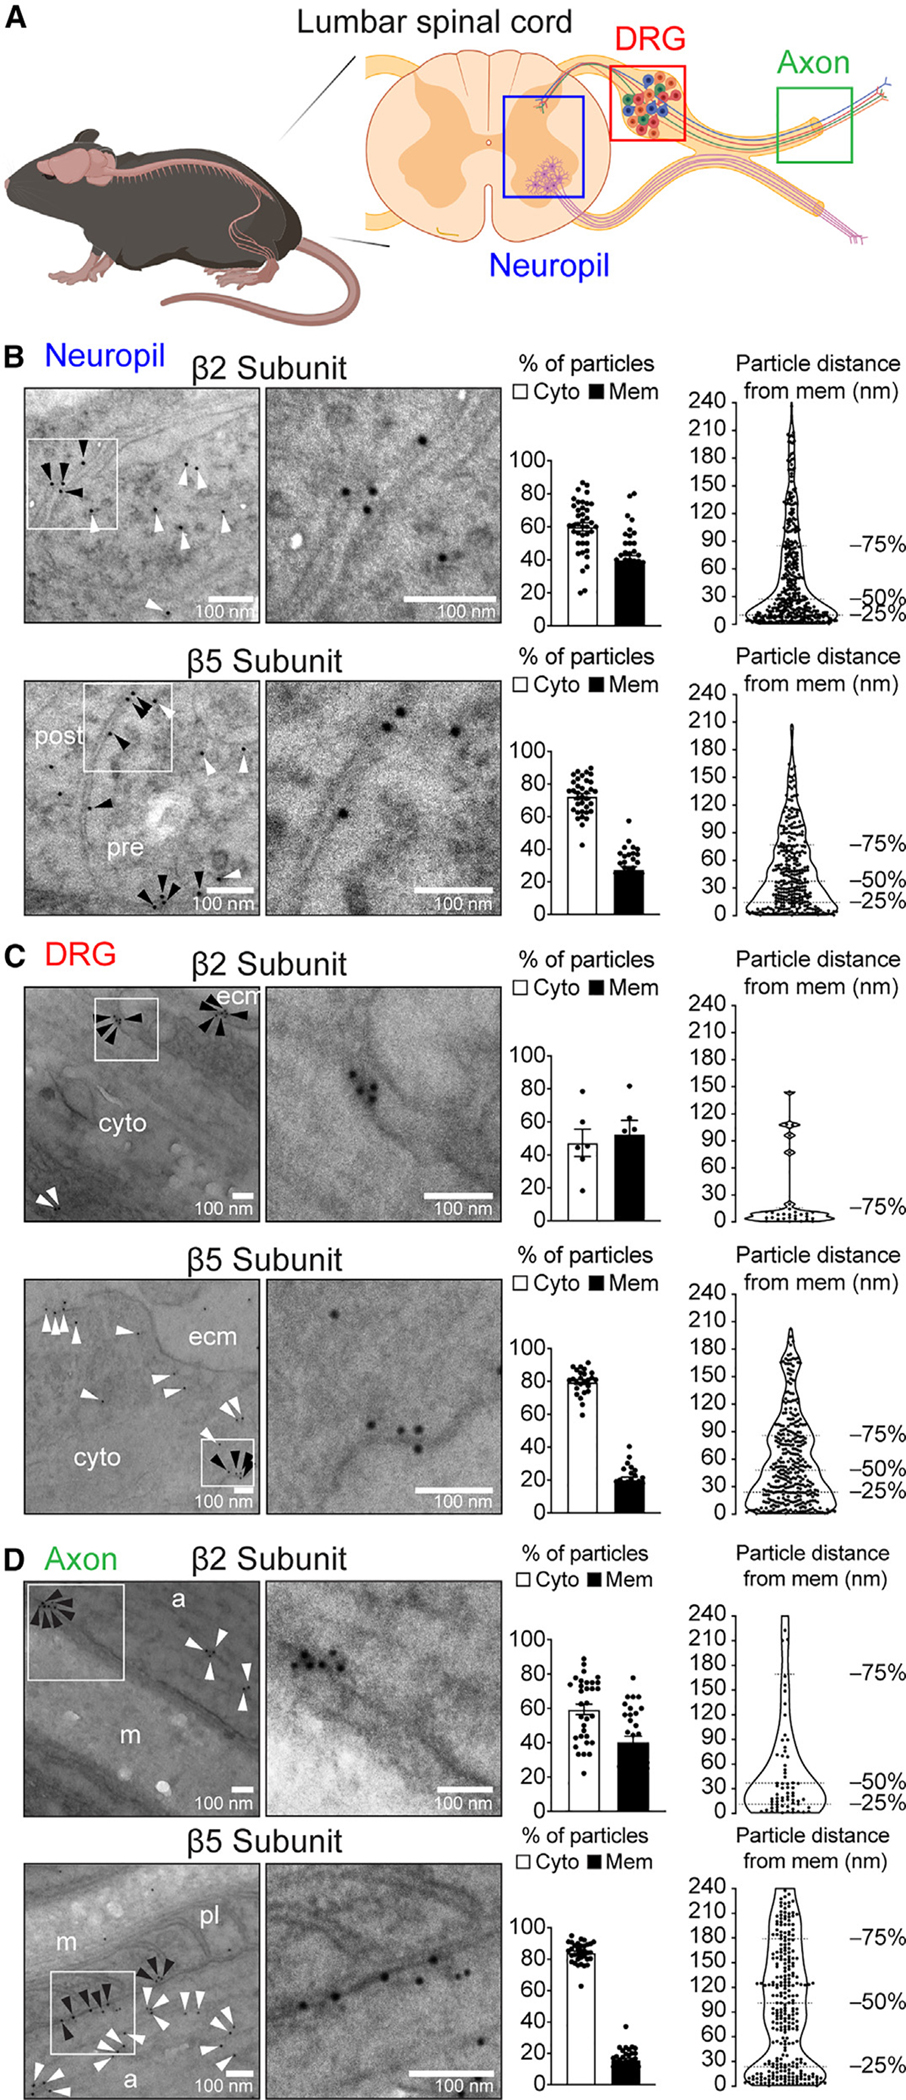
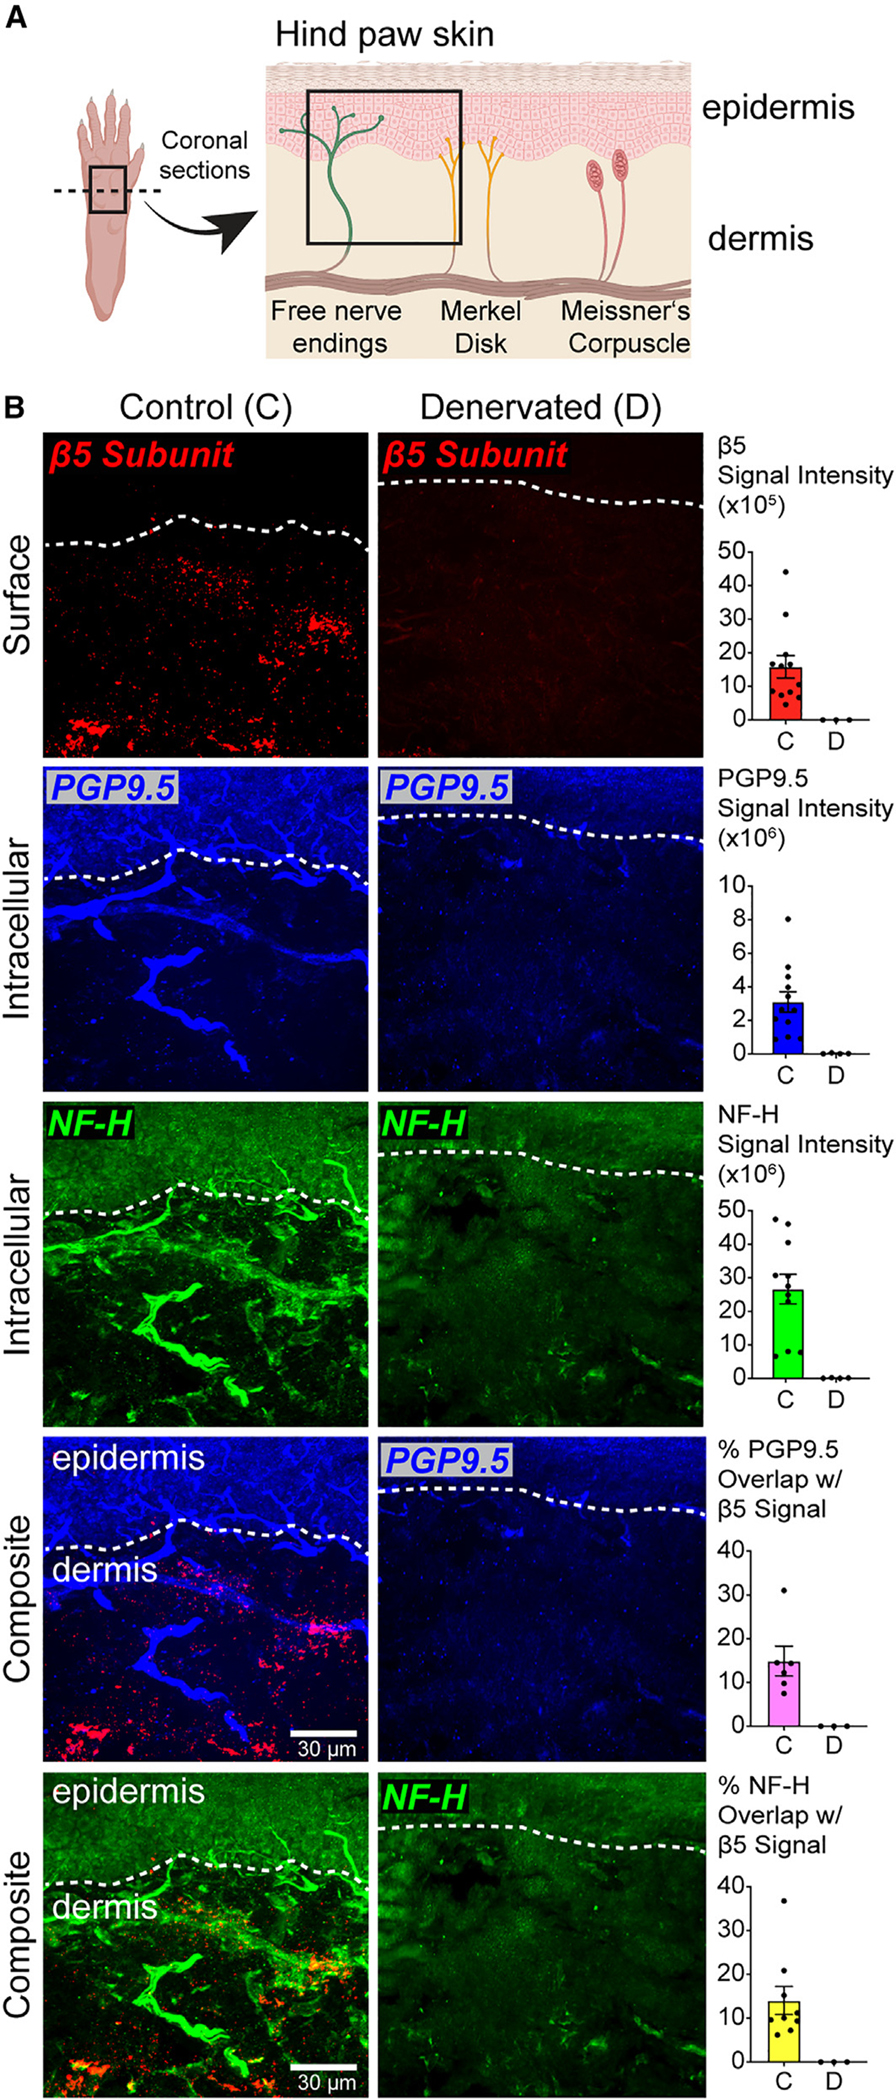
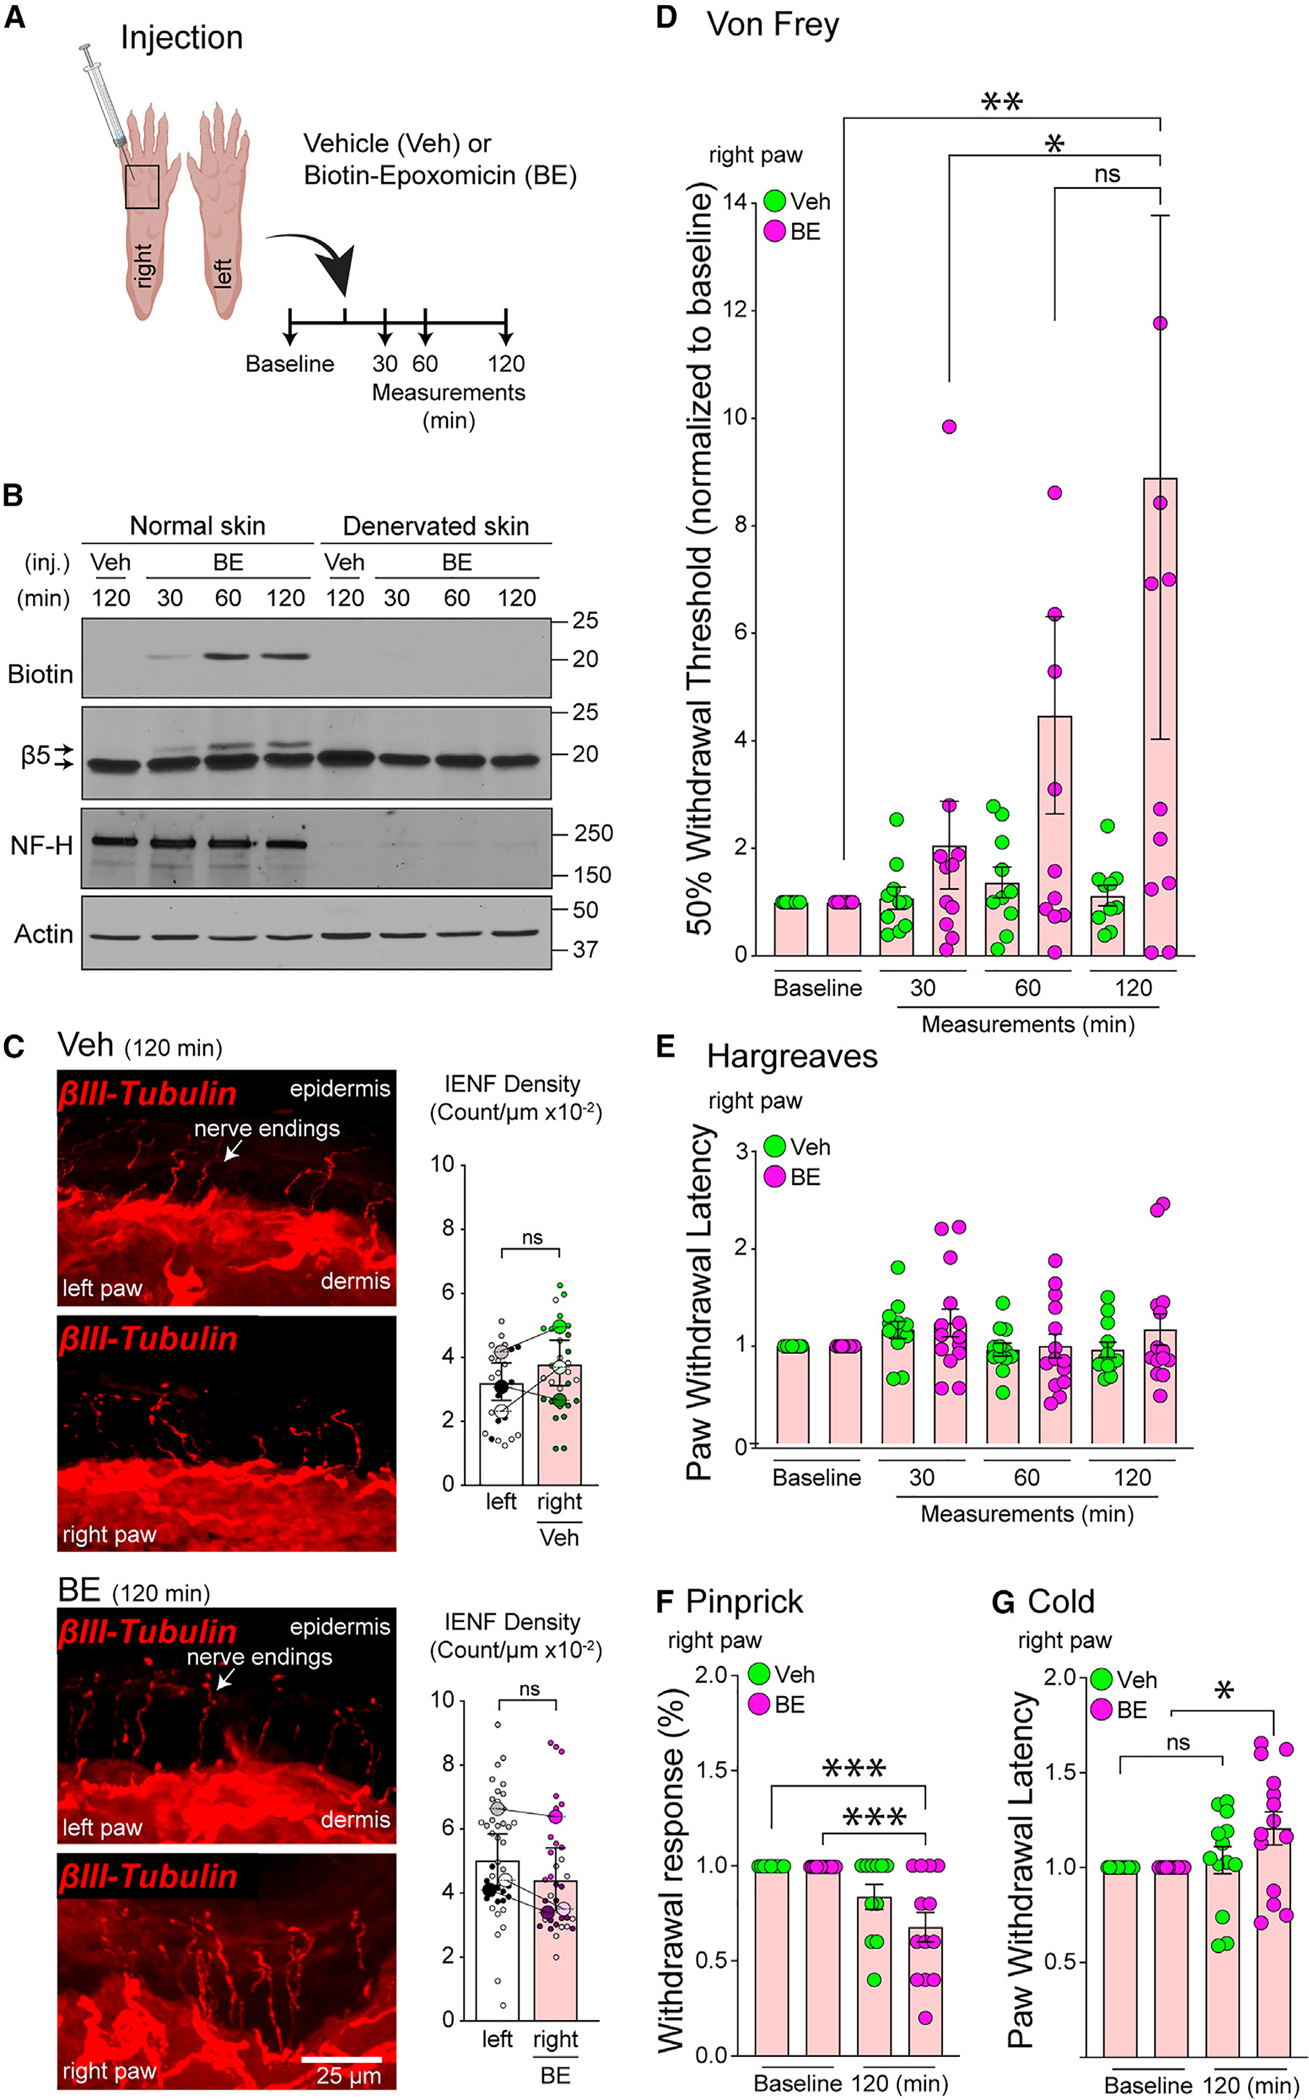
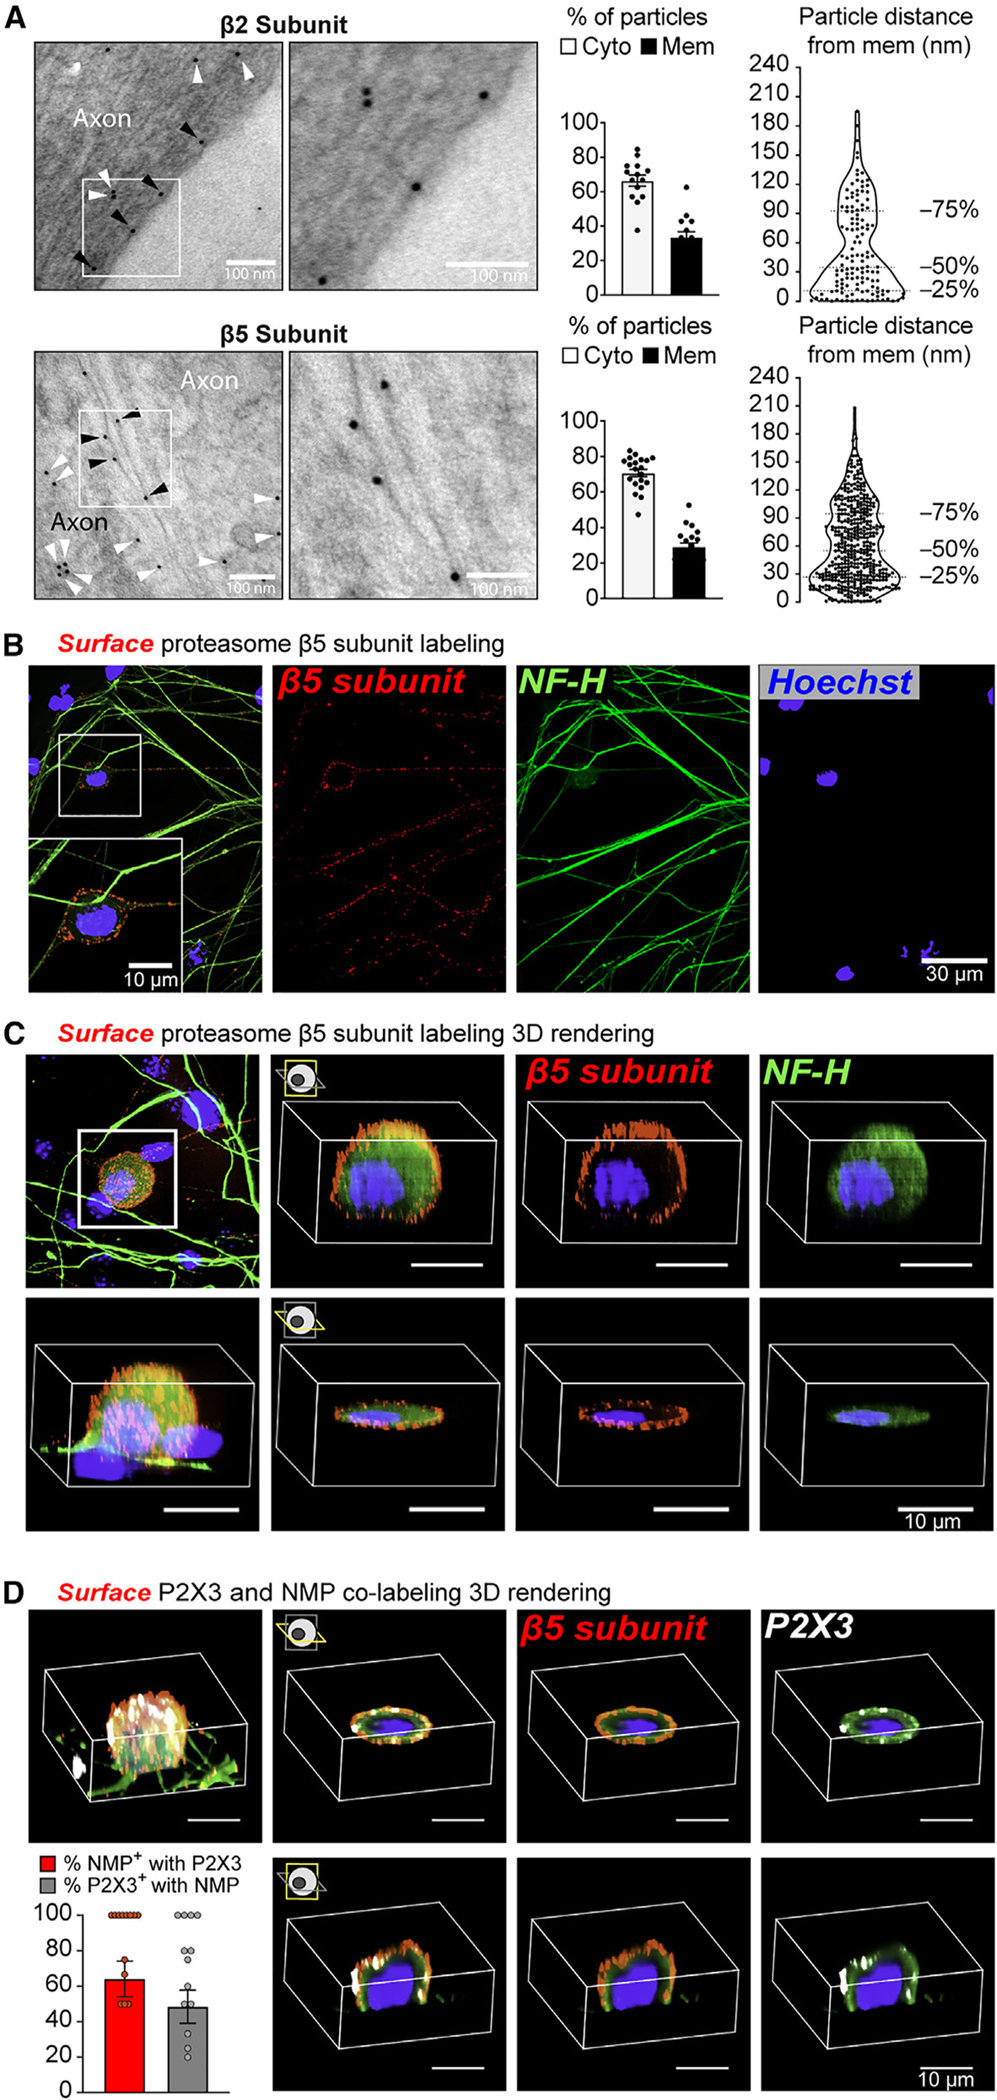
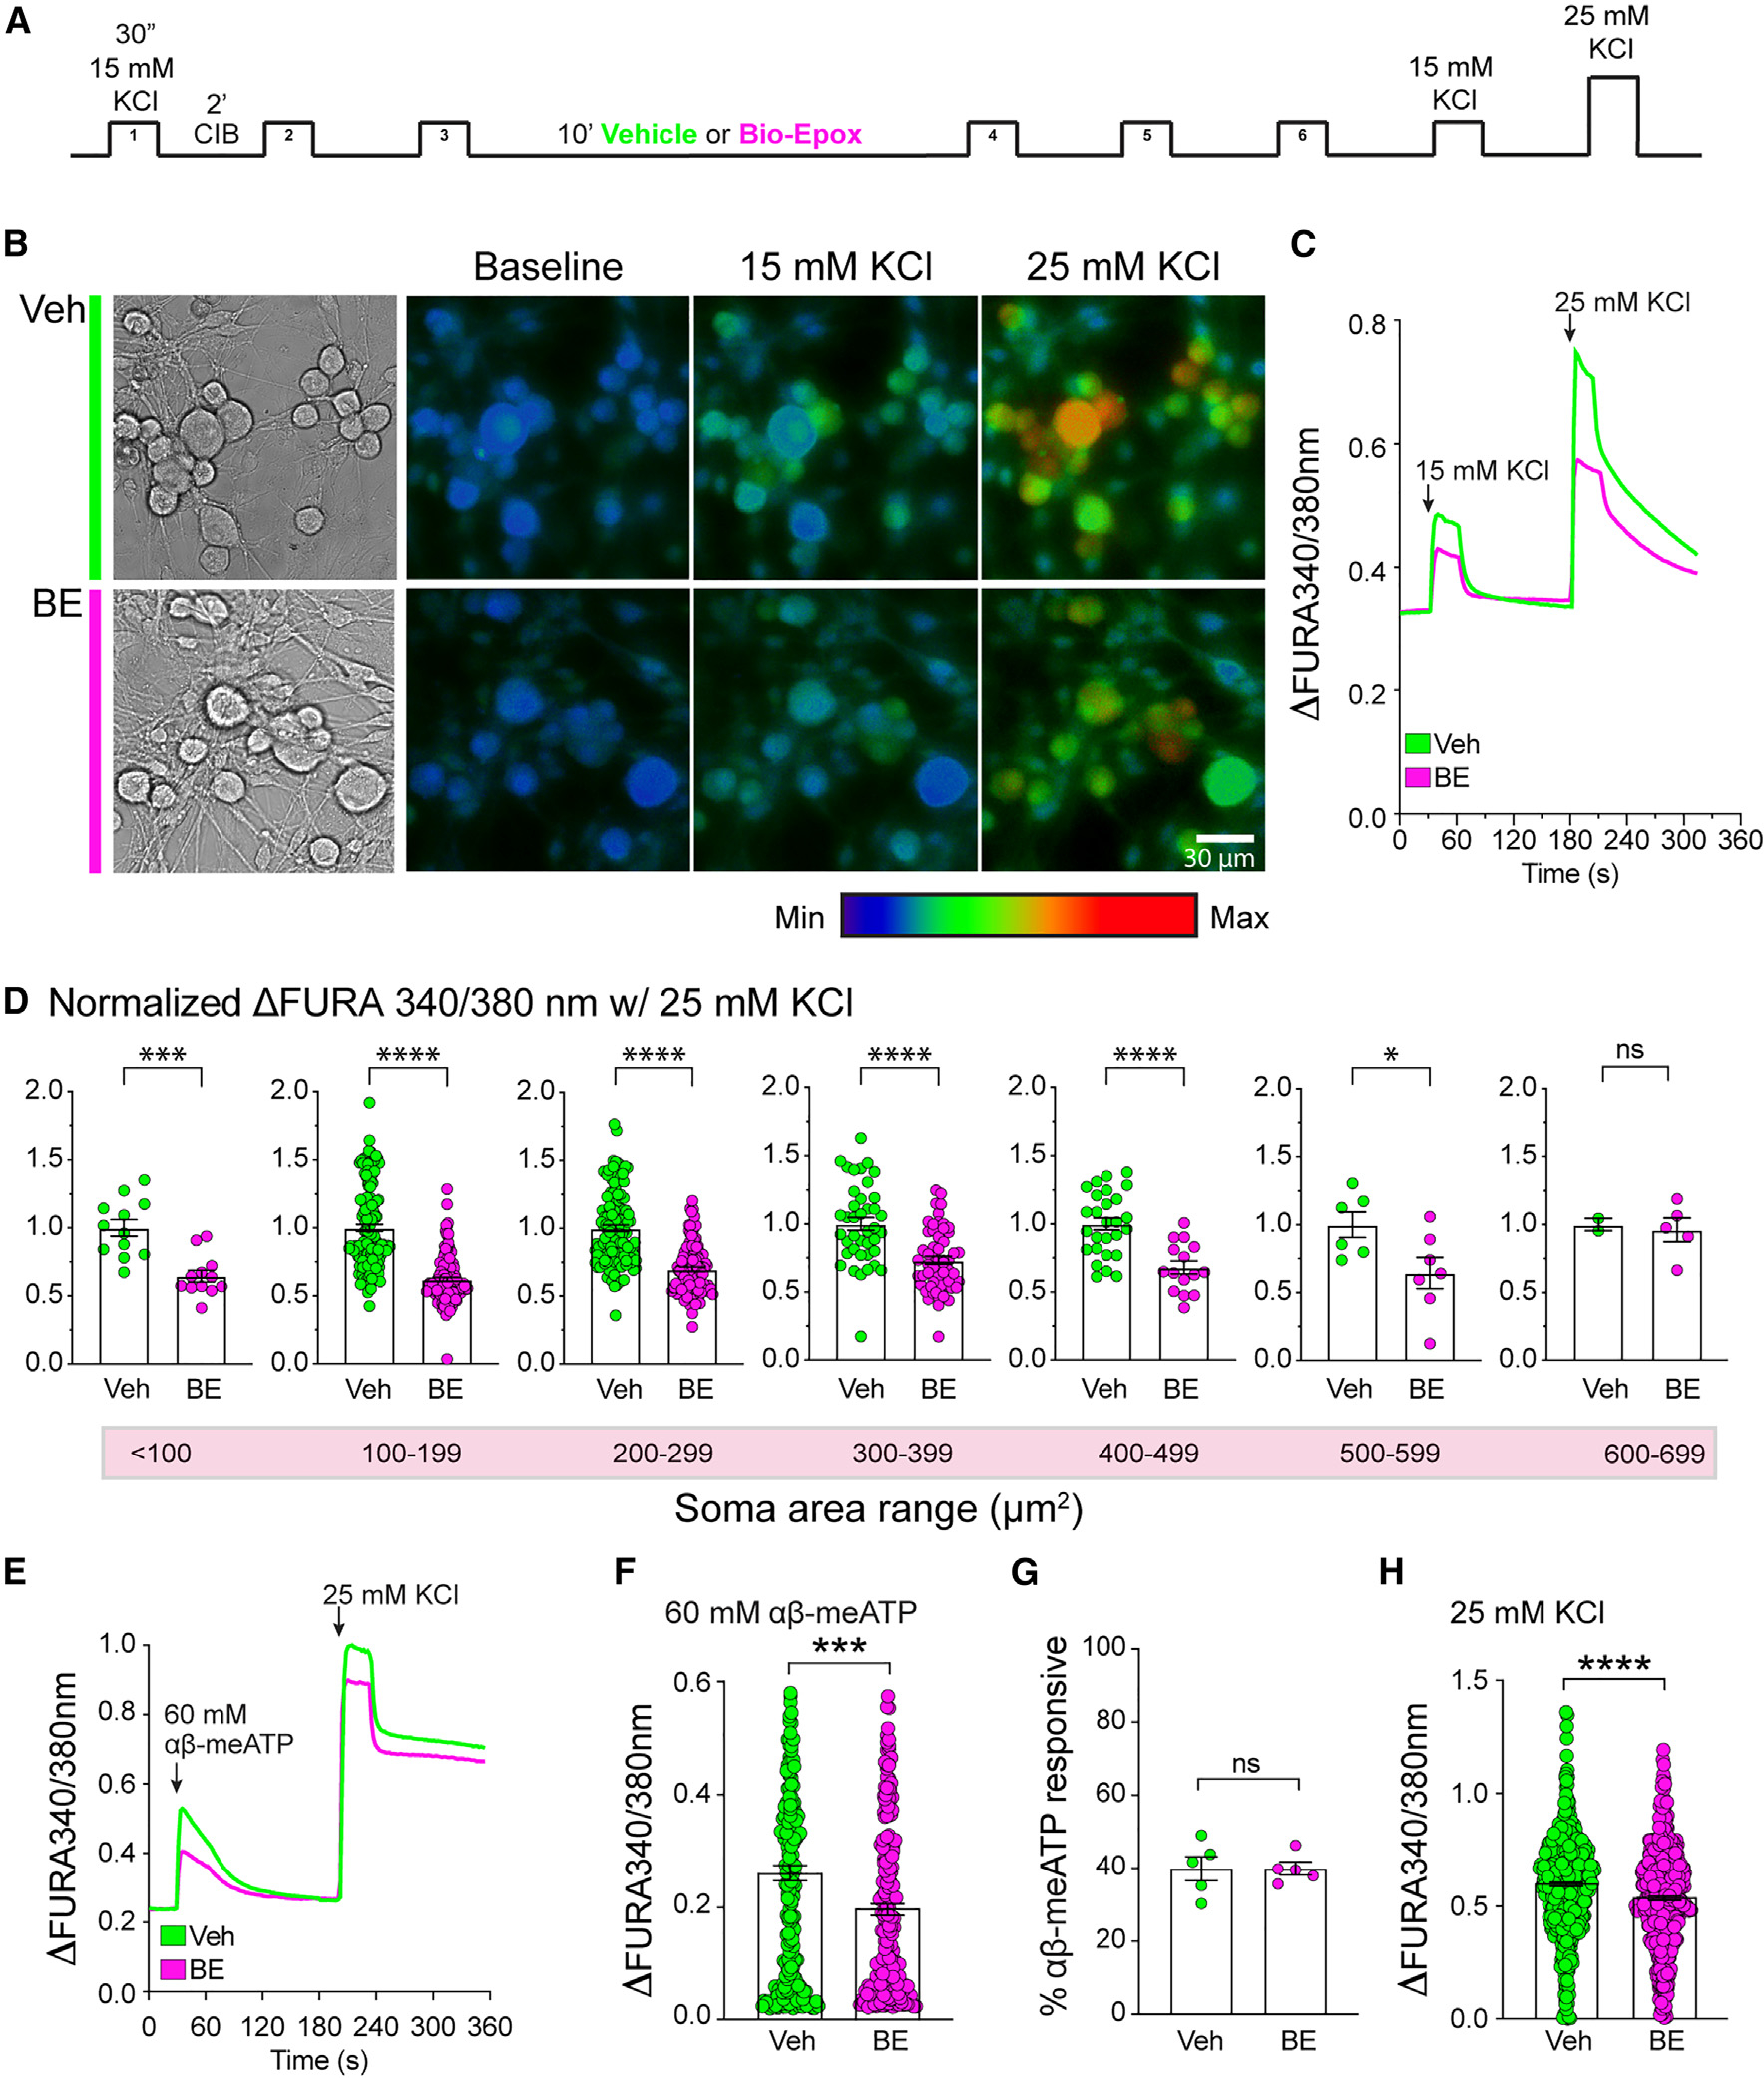
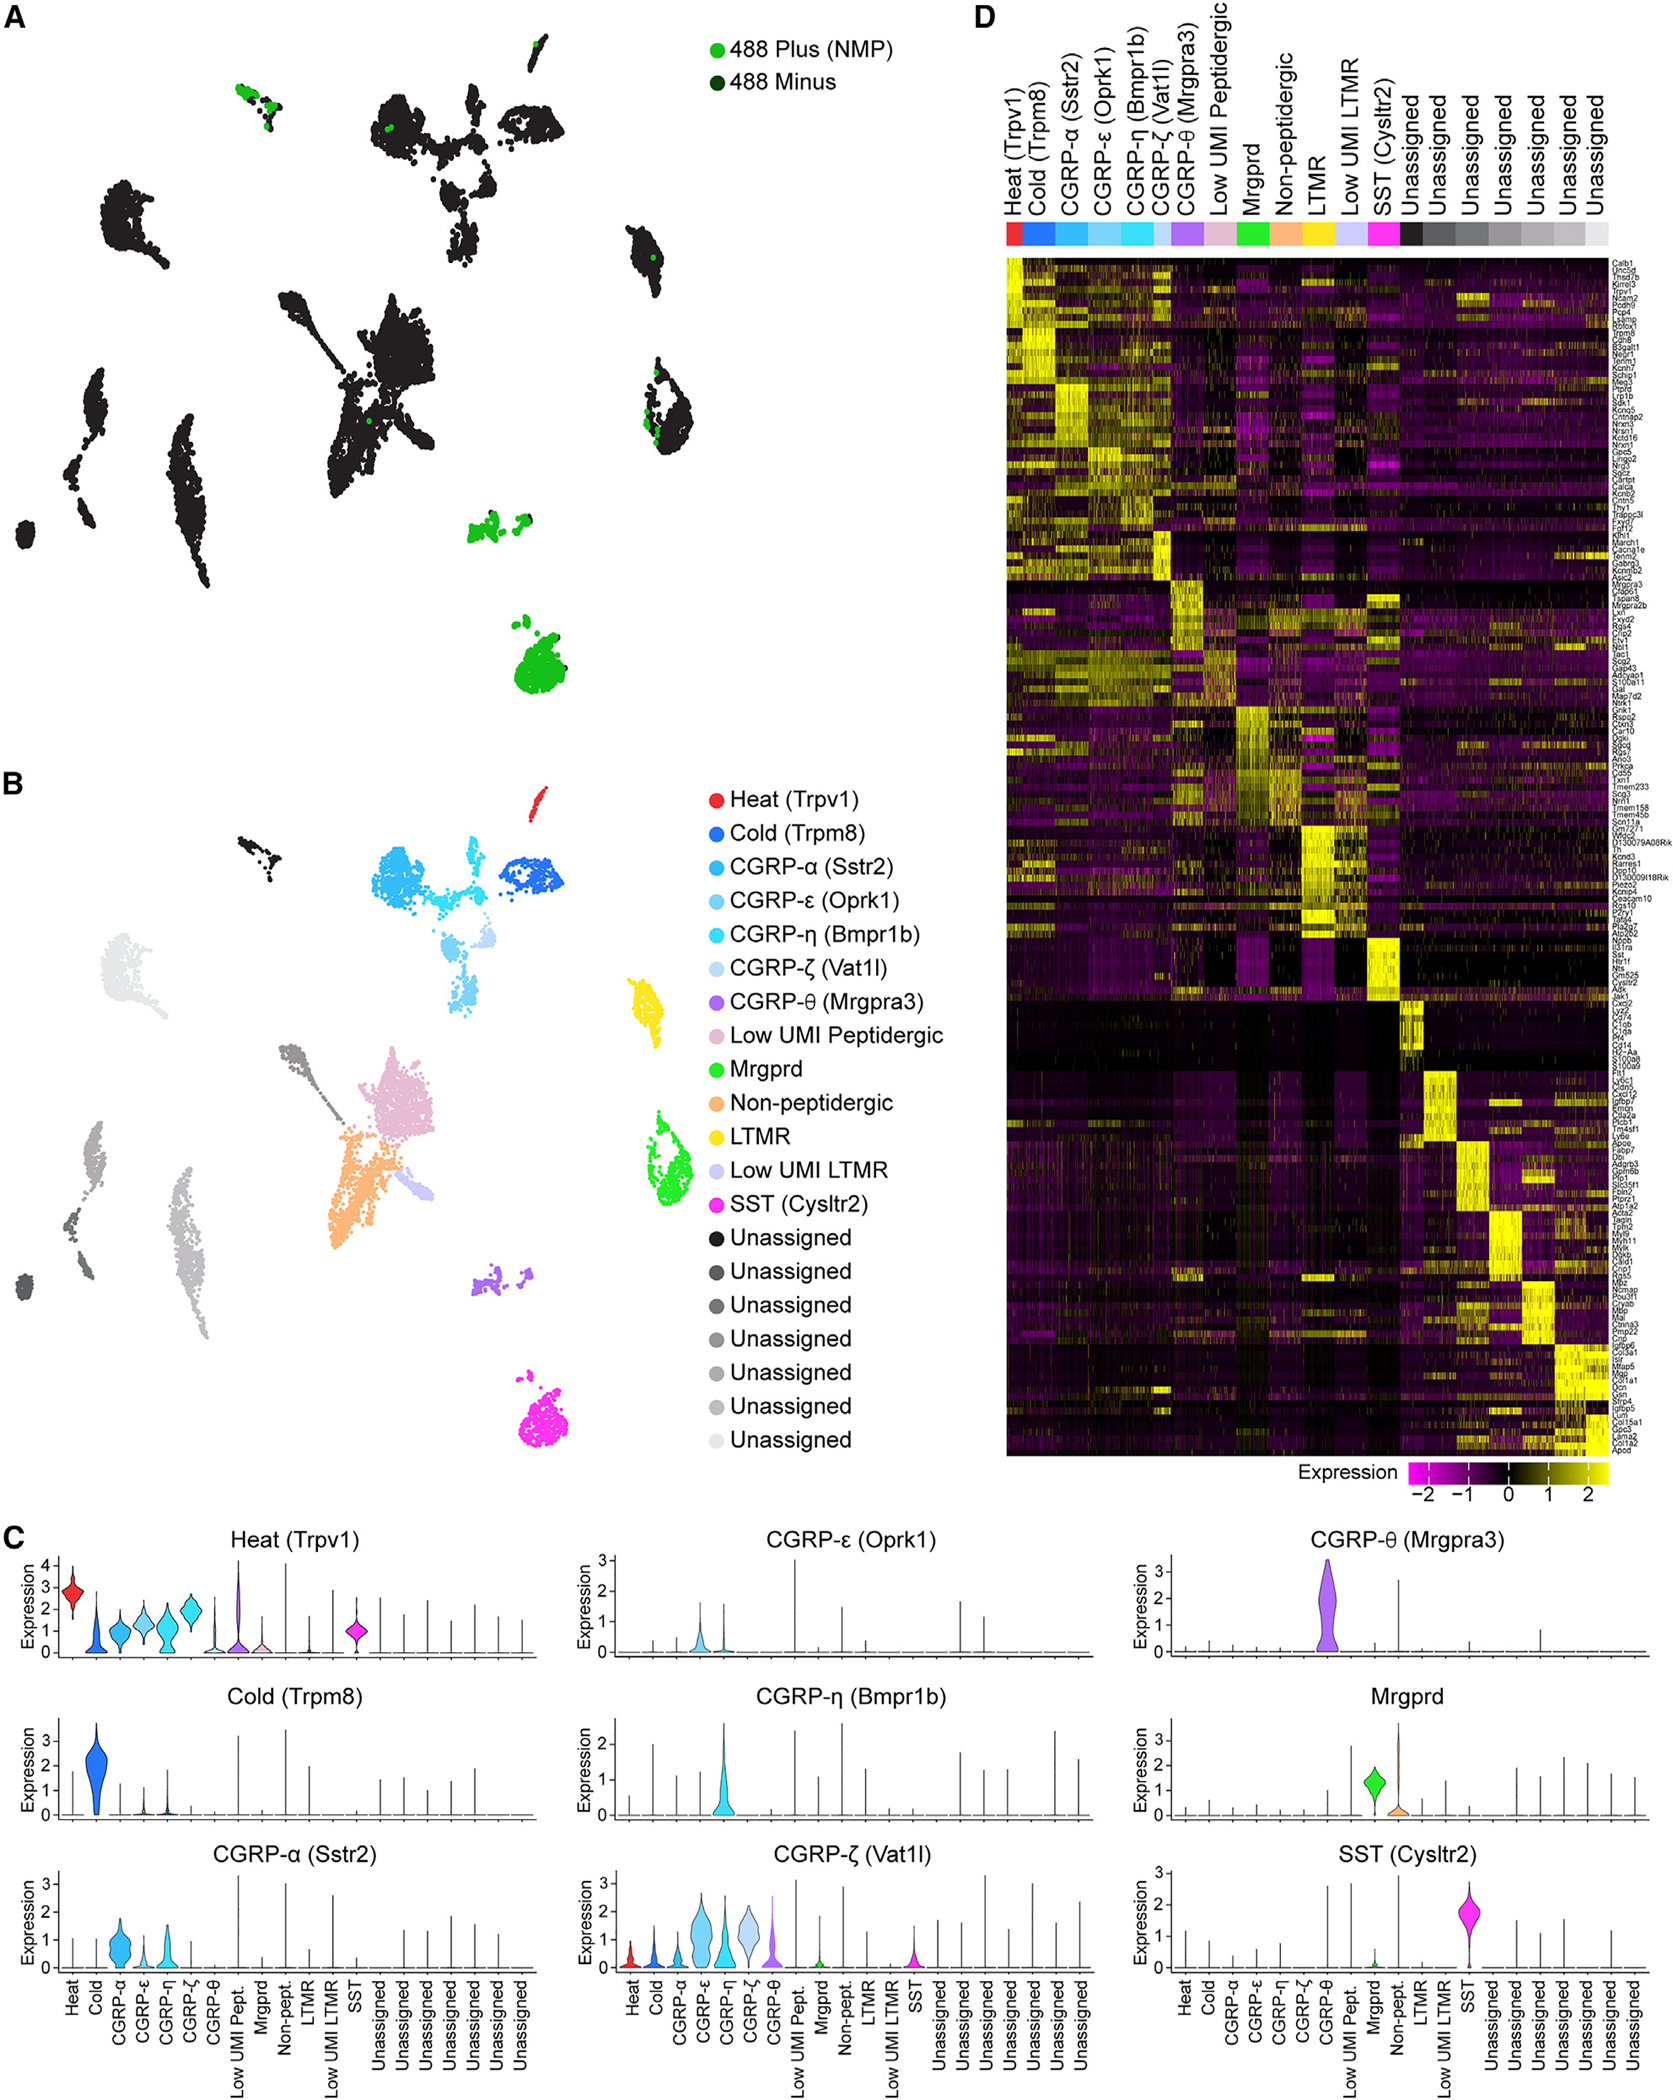
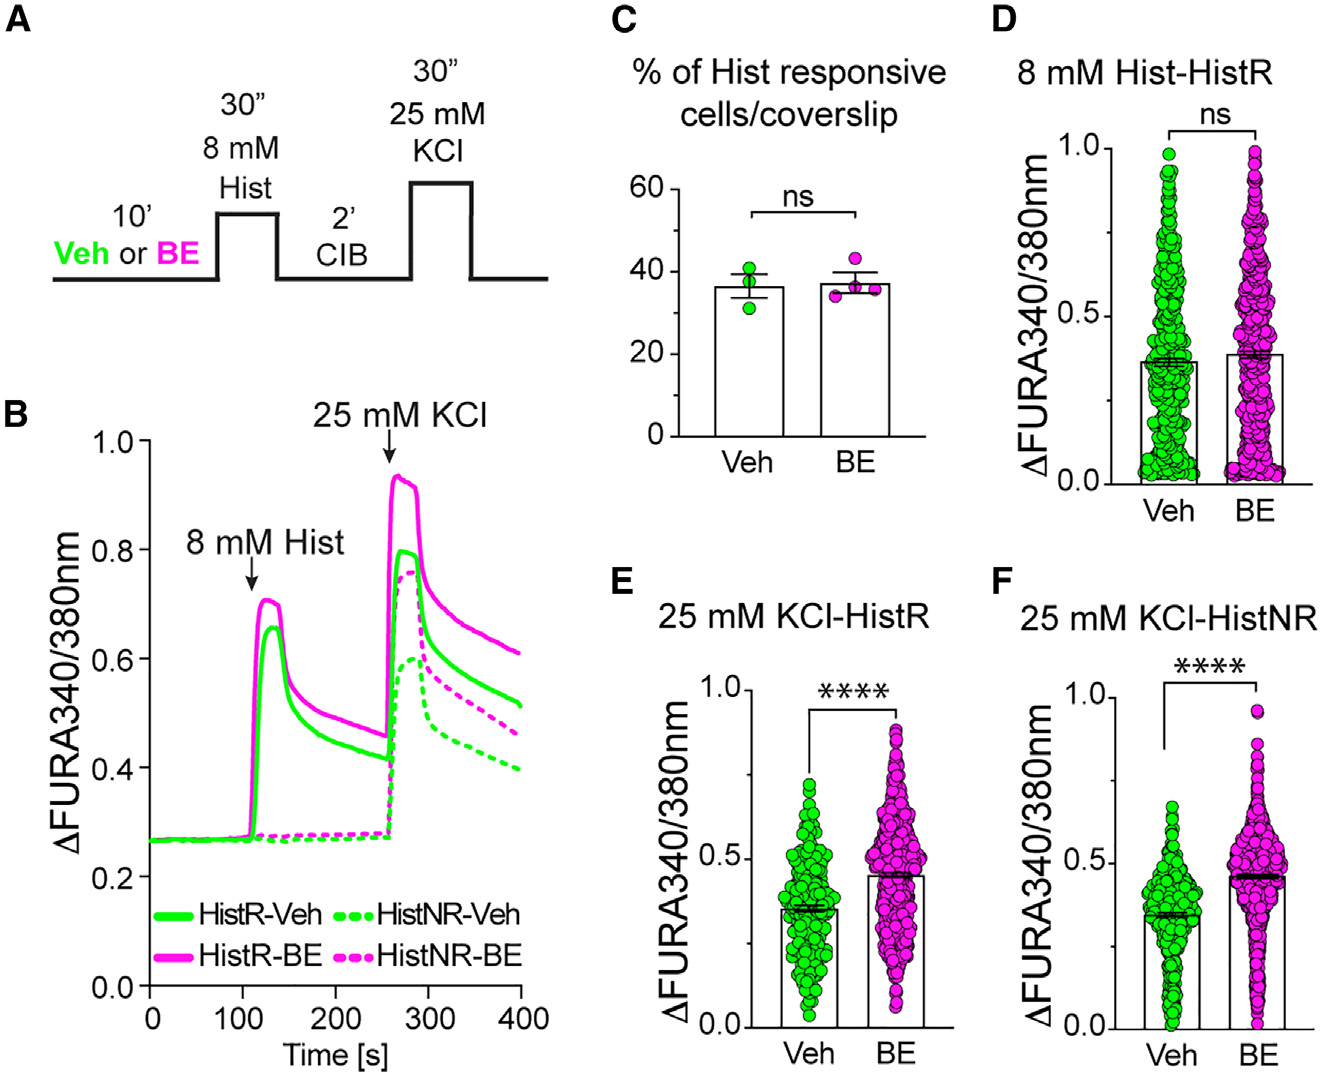
Proteasomes are critical for peripheral nervous system (PNS) function. Here, we investigate mammalian PNS proteasomes and reveal the presence of the neuronal membrane proteasome (NMP). We show that specific inhibition of the NMP on distal nerve fibers innervating the mouse hind paw leads to reduction in mechanical and pain sensitivity. Through investigating PNS NMPs, we demonstrate their presence on the somata and proximal and distal axons of a subset of dorsal root ganglion (DRG) neurons. Single-cell RNA sequencing experiments reveal that the NMP-expressing DRGs are primarily MrgprA3+ and Cysltr2+. NMP inhibition in DRG cultures leads to cell-autonomous and non-cell-autonomous changes in Ca2+ signaling induced by KCl depolarization, αβ-meATP, or the pruritogen histamine. Taken together, these data support a model whereby NMPs are expressed on a subset of somatosensory DRGs to modulate signaling between neurons of distinct sensory modalities and indicate the NMP as a potential target for controlling pain.

Keywords: CP: Molecular biology; CP: Neuroscience; DRG; neuronal membrane proteasome; neuronal signaling; peripheral nervous system; sensory behavior; sensory neurons.


Conflict of interest statement

Declaration of interests The authors declare no competing interests.

Figures

Figure 1.
Figure 1.. The NMP is expressed in PNS neuron soma, axon, and nerve endings
(A) Schematic of tissues used in immuno-EM experiments. (B–D) Representative images of immunogold labeling in neuropil of the spinal cord (B), DRG (C), and axon (D). White boxes: sections shown magnified on the right. White arrowheads: gold particles localized on the cytoplasm. Black arrowheads: gold particles localized on the membrane. Bar graphs to the right show the proportion of gold particles localized on the cytoplasm (Cyto) and membrane (Mem). Violin plots show the distribution of gold particles within 240 nm of the neuronal membranes. Twelve to twenty micrographs for each antibody were analyzed for each tissue region from two mice. ecm, extracellular matrix; post, post-synaptic cell; pre, pre-synaptic cell; a, axon; m, myelin; pl, paranodal loop. Data are presented as mean ± SEM (n = 25–45 [except for C, top, where n = 6] micrographs analyzed from two independent animals). See also Figure S1.
Figure 2.
Figure 2.. The NMP localizes to nerve endings on the skin
(A) Schematic of paw skin nerve endings. (B–D) (B) Representative maximum projection of z-stack images of plantar skin coronal sections showing immunostaining on nerves in control (C) and denervated (D) tissue. Bar graphs show the quantification of surface β5 (i.e., NMP) and intracellular PGP9.5 and NF-H signal intensities. For composite images, bar graphs show the quantification of percent overlap of NMP labeling on detectable nerves on the skin. Data are presented as mean ± SEM (n = 3–9 groups of images analyzed from three independent animals). See also Figure S2.
Figure 3.
Figure 3.. Selective inhibition of NMP in PNS results in reduced mechanical and pain nociception without nerve degeneration
(A) Schematic of experimental design. (B) Immunoblot of normal and denervated skin samples from (A) using indicated antibodies. β5 signal upper arrow is biotin-epoxomicin (BE)-bound. (C) Representative images of nerve endings in paw skin sections from (A) at 120 min post treatment with vehicle (Veh) or BE. Bar graphs show intraepidermal nerve fiber density (IENF) density quantifications. The contralateral untreated (left) paw was used as an internal control (n = 3 mice per group/time point). Data are presented as super plots showing individual observations (small dots) from multiple experiments (larger dots) and mean ± SEM. No statistically significant differences were observed (unpaired t test). (D) Von Frey up-down test quantification. Data are presented as mean ± SEM (n = 10–12 mice per treatment). *p < 0.05, **p < 0.01 (two-way ANOVA with Tukey’s post hoc test). (E) Hargreaves test quantification. Data are presented as mean ± SEM (n = 14 mice per treatment). No statistically significant differences were observed (two-way ANOVA with Tukey’s post hoc test). (F) Pinprick test quantification. Data are presented as mean ± SEM (n = 14 mice per treatment). ***p < 0.001 (two-way ANOVA with Tukey’s post hoc test). (G) Cold test quantification. Data are presented as mean ± SEM (n = 14 mice per treatment). *p < 0.05 (two-way ANOVA with Tukey’s post hoc test). All behavioral data were normalized to baseline measurements per mouse. See also Figure S3.
Figure 4.
Figure 4.. The NMP is enriched in specific subtypes of DRG neurons
(A) Representative micrographs of immuno-EM labeling on primary DRG cultures. White arrowheads: gold particles localized on the cytoplasm. Black arrowheads: gold particles localized on the membrane. Bar graphs to the right show the proportion of gold particles localized on the cytoplasm (Cyto) and membrane (Mem). Violin plots show the distribution of gold particles within 240 nm of the neuronal membranes. Data are presented as mean ± SEM (n = 14–20 micrographs analyzed from two independent animals). (B) Representative images of antibody feeding experiments in DRG cultures against the β5 proteasome subunit followed by cytoplasmic NF-H staining. White box: magnified section shown on bottom of composite image. (C) Representative 3D projection images of antibody feeding experiments in DRG cultures against the β5 proteasome subunit followed by cytoplasmic NF-H staining. (D) Representative 3D projection images of antibody feeding experiments in DRG cultures against the P2X3 and β5 proteasome subunit co-labeling. Bar graph shows quantification of surface P2X3 and β5 co-labeling under the conditions that at least one neuron in the field of view was positive for both NMP and P2X3. Data are presented as mean ± SEM (n = 13 images analyzed). See also Figure S4.
Figure 5.
Figure 5.. Inhibition of PNS NMP function reduces depolarization and P2X3-signaling-evoked neuronal responses
(A) Schematic representation of experimental paradigm. (B) Representative images of DRG neuron calcium imaging. (C) Representative calcium response traces of DRGs in culture showing KCl stimulations in the presence of vehicle (Veh) or 10 μM BE. (D) Normalized peak response to 25 mM KCl in different-sized neuron groups. Data are presented as mean ± SEM (n = 4). *p < 0.05, ***p < 0.001, ****p < 0.0001 (Welch’s t test). (E) Representative calcium traces of DRGs in culture showing response to αβ-meATP followed by 25 mM KCl stimulation in the presence of Veh or 10 μM BE. (F) Quantification of DRG peak calcium response to αβ-meATP in the presence of Veh or 10 μM BE. Data are presented as mean ± SEM (n = 5). ***p < 0.001 (Welch’s t test). (G) Quantification of the proportion of αβ-meATP-responsive DRG neurons. Data are presented as mean ± SEM (n = 5). Statistically significant differences between samples were not observed (Welch’s t test). (H) Quantification of DRG peak calcium response to 25 mM KCl following αβ-meATP treatment. Data are presented as mean ± SEM (n = 5). ****p < 0.0001 (Welch’s t test). See also Figure S5.
Figure 6.
Figure 6.. Transcriptional characterization of NMP-positive DRG neurons
(A) UMAP visualization of scRNA-seq analysis of NMP-positive (green) and NMP-negative (black) neurons showing cell clusters of putative different DRG neuronal subtypes. (B) UMAP showing identification of 13 cell clusters as distinct sensory neuronal subtypes and 7 unassigned clusters using previously defined gene sets., UMAP legend shows the marker gene that can be used to identify the different sensory neuronal subtype clusters. (C) Violin plots showing expression profile of the marker genes that identify the different neuronal subtypes. (D) Heatmap showing up to ten differentially expressed genes that specifically map to each cluster and can be used to identify the different sensory neuronal subtypes. Differential expression was performed by comparing each cluster to all other cells in the dataset using a Mann-Whitney U test. Genes were selected by fold change. Expression scale is shown below the heatmap. A random selection of up to 200 cells was selected in clusters with more than 200 cells to allow for visualization of gene expression patterns in smaller clusters. See also Figure S6 and Table S1.
Figure 7.
Figure 7.. Pruritogen stimulation mediates NMP-dependent inhibition of pruritogen-responsive and pruritogen-non-responsive neurons
(A) Schematic representation of experimental paradigm. (B) Representative calcium response traces of DRGs in culture showing response to histamine (Hist) followed by KCl stimulation in the presence of vehicle (Veh) or 10 μM BE. Traces show both histamine-responsive neurons (HistR, solid line) and histamine-non-responsive neurons (HisNR, dashed line). (C) Quantification of the percentage of histamine-responsive (HisR) neurons in the presence of Veh or 10 μM BE. Data are presented as mean ± SEM (n = 4). No statistically significant differences were observed (Welch’s t test). (D) Quantification of DRG peak calcium response to histamine for HisR neurons in the presence of Veh or 10 μM BE. Data are presented as mean ± SEM (n = 4). No statistically significant differences were observed (Welch’s t test). (E and F) Quantification of DRG peak calcium response to KCl stimulation for both HisR (E) and HisNR (F) neurons in the presence of Veh or 10 μM BE. Data are presented as mean ± SEM (n = 4). ****p < 0.0001 (Welch’s t test).

References

    1. Thibaudeau TA, and Smith DM (2019). A Practical Review of Proteasome Pharmacology. Pharmacol. Rev. 71, 170–197. 10.1124/pr.117.015370. - DOI - PMC - PubMed
    1. Fortun J, Li J, Go J, Fenstermaker A, Fletcher BS, and Notterpek L (2005). Impaired proteasome activity and accumulation of ubiquitinated substrates in a hereditary neuropathy model. J. Neurochem. 92, 1531–1541. 10.1111/j.1471-4159.2004.02987.x. - DOI - PubMed
    1. VerPlank JJS, Lokireddy S, Feltri ML, Goldberg AL, and Wrabetz L (2018). Impairment of protein degradation and proteasome function in hereditary neuropathies. Glia 66, 379–395. 10.1002/glia.23251. - DOI - PMC - PubMed
    1. Cartelli D, Cavaletti G, Lauria G, and Meregalli C (2022). Ubiquitin Proteasome System and Microtubules Are Master Regulators of Central and Peripheral Nervous System Axon Degeneration. Cells 11, 1358. 10.3390/cells11081358. - DOI - PMC - PubMed
    1. Cavaletti G, Gilardini A, Canta A, Rigamonti L, Rodriguez-Menendez V, Ceresa C, Marmiroli P, Bossi M, Oggioni N, D’Incalci M, and De Coster R (2007). Bortezomib-induced peripheral neurotoxicity: a neurophysiological and pathological study in the rat. Exp. Neurol. 204, 317–325. 10.1016/j.expneurol.2006.11.010. - DOI - PubMed

Publication types

Substances

LinkOut - more resources