. 2024 May 21;5(5):101511.
doi: 10.1016/j.xcrm.2024.101511. Epub 2024 Apr 12.

A comprehensive single-cell breast tumor atlas defines epithelial and immune heterogeneity and interactions predicting anti-PD-1 therapy response

Affiliations

A comprehensive single-cell breast tumor atlas defines epithelial and immune heterogeneity and interactions predicting anti-PD-1 therapy response

Lily Xu et al. Cell Rep Med. .

Abstract

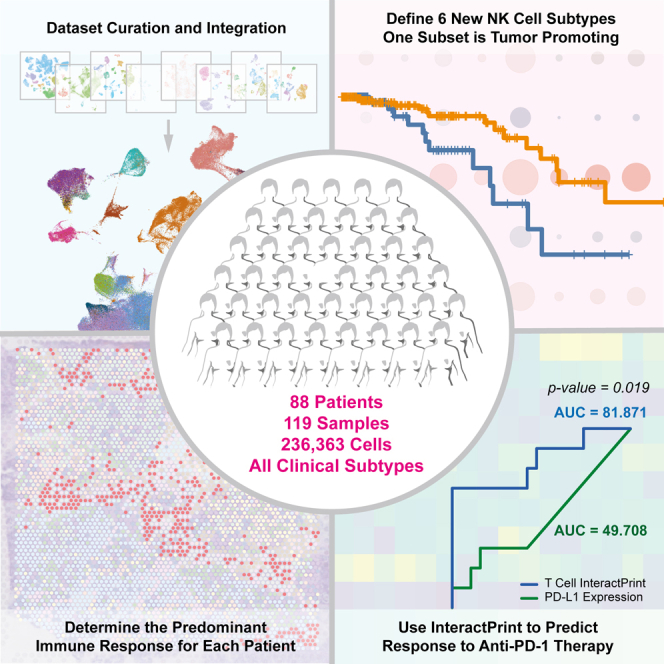
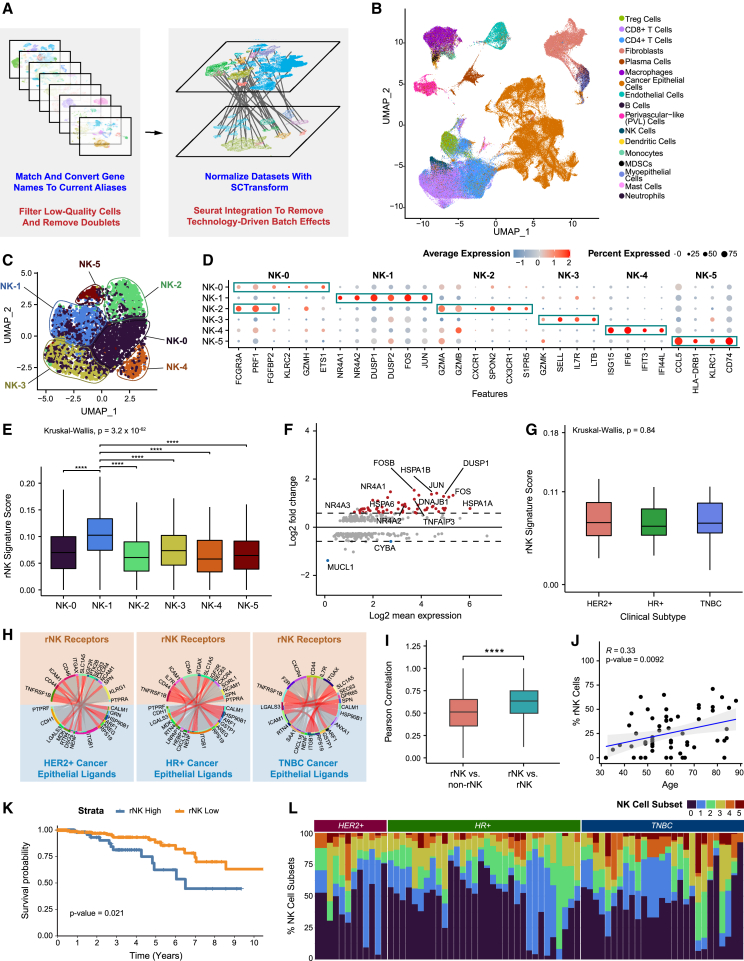
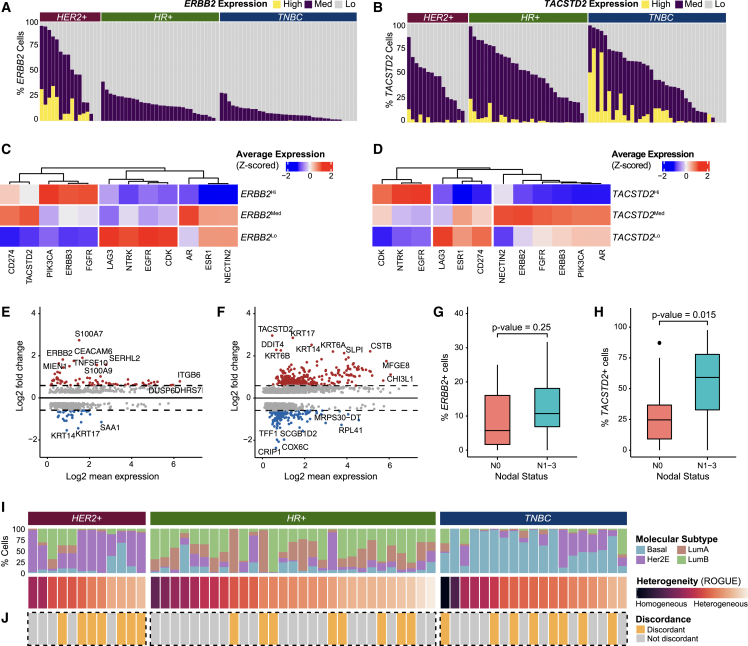
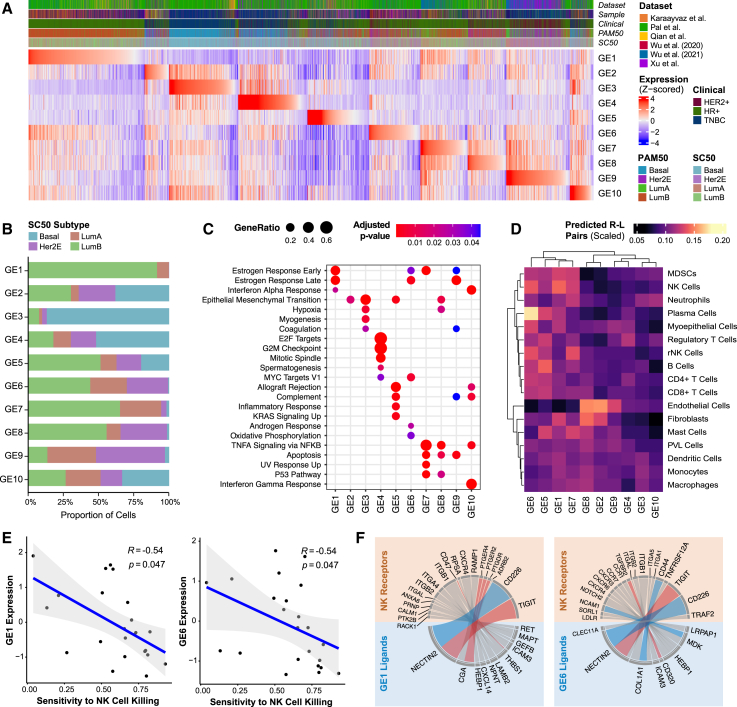
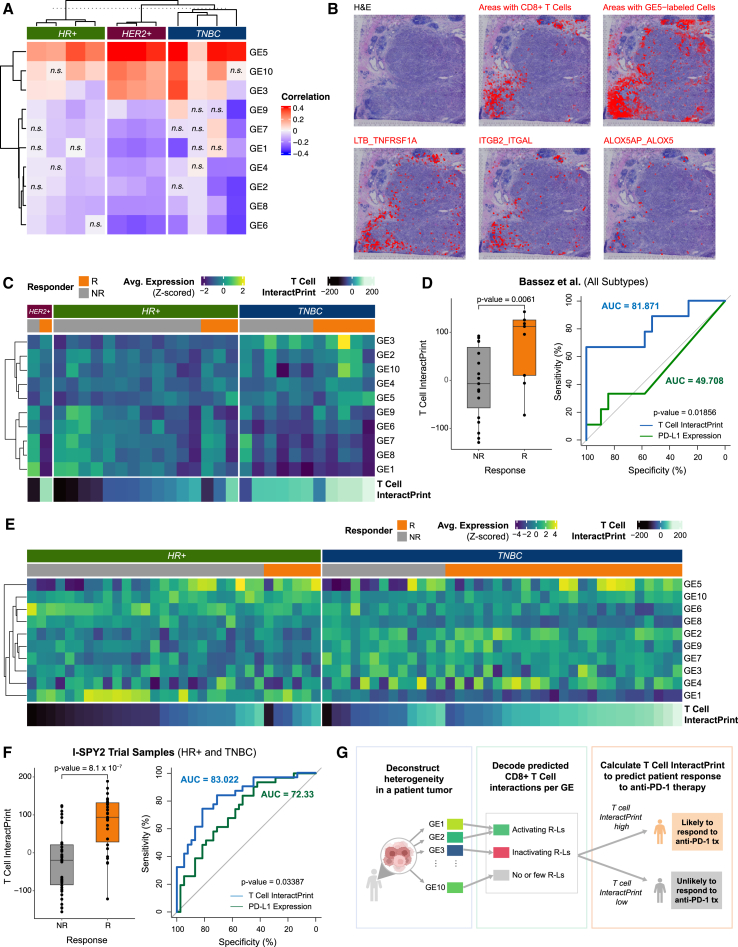
We present an integrated single-cell RNA sequencing atlas of the primary breast tumor microenvironment (TME) containing 236,363 cells from 119 biopsy samples across eight datasets. In this study, we leverage this resource for multiple analyses of immune and cancer epithelial cell heterogeneity. We define natural killer (NK) cell heterogeneity through six subsets in the breast TME. Because NK cell heterogeneity correlates with epithelial cell heterogeneity, we characterize epithelial cells at the level of single-gene expression, molecular subtype, and 10 categories reflecting intratumoral transcriptional heterogeneity. We develop InteractPrint, which considers how cancer epithelial cell heterogeneity influences cancer-immune interactions. We use T cell InteractPrint to predict response to immune checkpoint inhibition (ICI) in two breast cancer clinical trials testing neoadjuvant anti-PD-1 therapy. T cell InteractPrint was predictive of response in both trials versus PD-L1 (AUC = 0.82, 0.83 vs. 0.50, 0.72). This resource enables additional high-resolution investigations of the breast TME.


Conflict of interest statement

Declaration of interests I.S.C., L.X., and K.S. are co-inventors on a pending patent application for a method to determine a predominant immune signal in a breast tumor microenvironment.

Figures

None
Graphical abstract
Figure 1
Figure 1
Integrated scRNA-seq dataset of primary breast cancer identifies six NK cell subsets in breast cancer (A) Brief overview of the processing and integration pipeline for 8 primary breast cancer datasets. (B) UMAP visualization of 236,363 cells across 119 samples from 88 patients analyzed by scRNA-seq. (C) UMAP visualization showing major subsets of natural killer (NK) cells. (D) Bubble heatmap showing expression of upregulated differentially expressed genes for each major NK cell subset (Bonferroni-adjusted p < 0.05). (E) Boxplot showing expression of the rNK cell signature in each NK cell subset. NK-1 was significantly different from all other clusters (Kruskal-Wallis p < 0.0001, with post hoc Dunn test p values shown; ∗∗∗∗p < 0.0001). (F) MA plot of differentially expressed genes between rNK and non-rNK cells (Bonferroni-adjusted p < 0.05). (G) Boxplot showing the expression level of the rNK signature by clinical subtype. No significant difference was found between subtypes (Kruskal-Wallis p > 0.05). (H) Circos plots showing representative predictive receptor-ligand pairs between rNK cells and all cancer epithelial cells separated by clinical subtype. Shared receptors across all subtypes are colored in red. (I) Boxplot showing the Pearson correlations of rNK signature gene expression in reprogrammed NK (rNK) cells compared with non-rNK cells versus rNK cells compared with rNK cells (across all clinical subtypes of breast cancer). Pearson correlations between rNK cells and rNK cells are higher than those between rNK cells and non-rNK cells (two-sided Wilcoxon test, ∗∗∗∗p < 0.0001). (J) Scatterplot showing the Pearson correlation of age and proportion of rNK cells by sample (p <0.01). (K) Kaplan-Meier plot showing worse clinical outcome in breast cancer patients with high expression of the rNK cell gene signature (log rank test, p < 0.05). (L) Bar plot showing relative proportions of NK subsets across tumor samples and clinical subtypes. See also Figures S1–S5 and Data S1 and S4.
Figure 2
Figure 2
Cancer epithelial cells demonstrate substantial ITTH (A) Bar plot showing proportions of ERBB2Hi, ERBB2Med, and ERBB2Lo cells by sample. (B) Bar plot showing proportions of TACSTD2Hi, TACSTD2Med, and TACSTD2Lo cells by sample. (C) Heatmap of Z-scored average expression of clinically actionable targets in ERBB2Hi, ERBB2Med, and ERBB2Lo cells. (D) Heatmap of Z-scored average expression of clinically actionable targets in TACSTD2Hi, TACSTD2Med, and TACSTD2Lo cells. (E) MA plot showing differentially expressed genes between ERBB2Hi vs. ERBB2Med and ERBB2Lo cells (Bonferroni-adjusted p < 0.05). (F) MA plot showing differentially expressed genes between TACSTD2Hi vs. TACSTD2Med and TACSTD2Lo cells (Bonferroni-adjusted p < 0.05). (G) Boxplot showing the proportion of ERBB2-expressing cells per sample by nodal status (two-sided Wilcoxon test, p > 0.05). (H) Boxplot showing the proportion of TACSTD2-expressing cells per sample by nodal status (two-sided Wilcoxon test, p < 0.05). (I) Percentage of cancer epithelial cells by molecular subtype, sorted by sample score by the ROGUE metric. (J) Plot showing discordance in predicted heterogeneity by molecular subtype and by ROGUE metric by sample. Samples with >50% difference between the normalized ROGUE metric and the maximum percentage of cells within the sample that belonged to a single molecular subtype are classified as discordant. See also Figures S6 and S7 and Data S5 and S6.
Figure 3
Figure 3
Cancer epithelial cell heterogeneity can be defined by 10 GEs that influence immune cell interactions (A) Heatmap of Z-scored signature scores of the 10 identified gene elements (GEs) representing all cancer epithelial cells, ordered based on the maximum Z-scored GE signature score. Annotations represent dataset origin, clinical subtype, PAM50 subtype, and SC50 subtype. The “sample” annotation was included to demonstrate that no individual patient sample contributed heavily to a particular GE. (B) Percentage of cancer epithelial cells assigned to each GE by molecular subtype. (C) Gene set enrichment using ClusterProfiler of the differentially expressed genes by GE. Significantly enriched gene sets from the MSigDB Hallmark collection are shown (Benjamini-Hochberg-adjusted p < 0.05). (D) Heatmap of the scaled number of curated predicted receptor-ligand pairs between cancer epithelial cells by GE and interacting immune and stromal cells. (E) Scatterplots showing Spearman correlations of expression of NK-cell related GE1 and GE6 with sensitivity to NK cell killing (Benjamini-Hochberg-adjusted p < 0.05). (F) Circos plots showing curated receptor-ligand pairs between cancer epithelial cells that highly express NK cell-related GE1 and GE6 with NK cells. NK cell activating receptor-ligand pairs are colored blue; NK cell inactivating receptor-ligand pairs are colored red. See also Figure S8.
Figure 4
Figure 4
GE-immune interactions predict response to anti-PD-1 therapy (A) Heatmap of Pearson correlations between expression of each of the 10 GEs and the presence of CD8+ T cells for 6 spatial transcriptomics samples across spots containing CD8+ T cells (n.s., Benjamini-Hochberg-adjusted p > 0.05). (B) For a representative TNBC sample, pathological annotation of morphological regions into distinct categories. UCell signature scores of CD8+ T cells are overlaid onto spatial tumor sample spots (red). A UCell signature score of GE5 (a CD8+ T cell activating GE) is overlaid onto tumor sample spots (red). A colocalization score for ITGB2_ITGAL, LTB_TNFRSF1A, and ALOX5AP_ALOX5 (predicted receptor-ligand pairs for GE5 and CD8+ T cells) is overlaid onto tumor sample spots (red). (C) Heatmap of average expression of each of the 10 GEs across cancer epithelial cells in each sample from Bassez et al.57 T cell InteractPrint is shown below. (D) Boxplot showing T cell InteractPrint prediction of response to anti-PD-1 therapy across all clinical subtypes in Bassez et al.57 (R, responder; NR, non-responder; p < 0.05). Also shown is the AUC of ROC comparing the performance of T cell InteractPrint (AUC = 81.87) and of PD-L1 expression (AUC = 49.71) in Bassez et al.57 samples (bootstrap test with n = 10,000, p < 0.05). (E) Heatmap of average expression of each of the 10 GEs across cancer epithelial cells in each sample from the I-SPY2 trial. T cell InteractPrint is shown below. (F) Boxplot showing T cell InteractPrint prediction of response to anti-PD-1 therapy across all clinical subtypes in I-SPY2 trial samples (two-sided Wilcoxon test p <0.0001). Also shown is the AUC of ROC comparing the performance of T cell InteractPrint (AUC = 83.02) and of PD-L1 expression (AUC = 72.33) in the I-SPY2 trial (bootstrap test with n = 10,000, p <0.05). (G) Schematic of T cell InteractPrint to predict patient response to anti-PD-1 therapy. See also Figure S9.

References

    1. Siegel R.L., Miller K.D., Fuchs H.E., Jemal A. Cancer statistics, 2022. CA A Cancer J. Clin. 2022;72:7–33. doi: 10.3322/caac.21708. - DOI - PubMed
    1. Hanker A.B., Sudhan D.R., Arteaga C.L. Overcoming Endocrine Resistance in Breast Cancer. Cancer Cell. 2020;37:496–513. doi: 10.1016/j.ccell.2020.03.009. - DOI - PMC - PubMed
    1. Al-Hajj M., Wicha M.S., Benito-Hernandez A., Morrison S.J., Clarke M.F. Prospective identification of tumorigenic breast cancer cells. Proc. Natl. Acad. Sci. USA. 2003;100:3983–3988. doi: 10.1073/pnas.0530291100. - DOI - PMC - PubMed
    1. Feng Y., Spezia M., Huang S., Yuan C., Zeng Z., Zhang L., Ji X., Liu W., Huang B., Luo W., et al. Breast cancer development and progression: Risk factors, cancer stem cells, signaling pathways, genomics, and molecular pathogenesis. Genes Dis. 2018;5:77–106. doi: 10.1016/j.gendis.2018.05.001. - DOI - PMC - PubMed
    1. Place A.E., Jin Huh S., Polyak K. The microenvironment in breast cancer progression: biology and implications for treatment. Breast Cancer Res. 2011;13:227. doi: 10.1186/bcr2912. - DOI - PMC - PubMed

MeSH terms

Substances