. 2024 Jun 19;112(12):1959-1977.e10.
doi: 10.1016/j.neuron.2024.03.017. Epub 2024 Apr 12.

Microglial P2Y6 calcium signaling promotes phagocytosis and shapes neuroimmune responses in epileptogenesis

Affiliations

Microglial P2Y6 calcium signaling promotes phagocytosis and shapes neuroimmune responses in epileptogenesis

Anthony D Umpierre et al. Neuron. .

Abstract

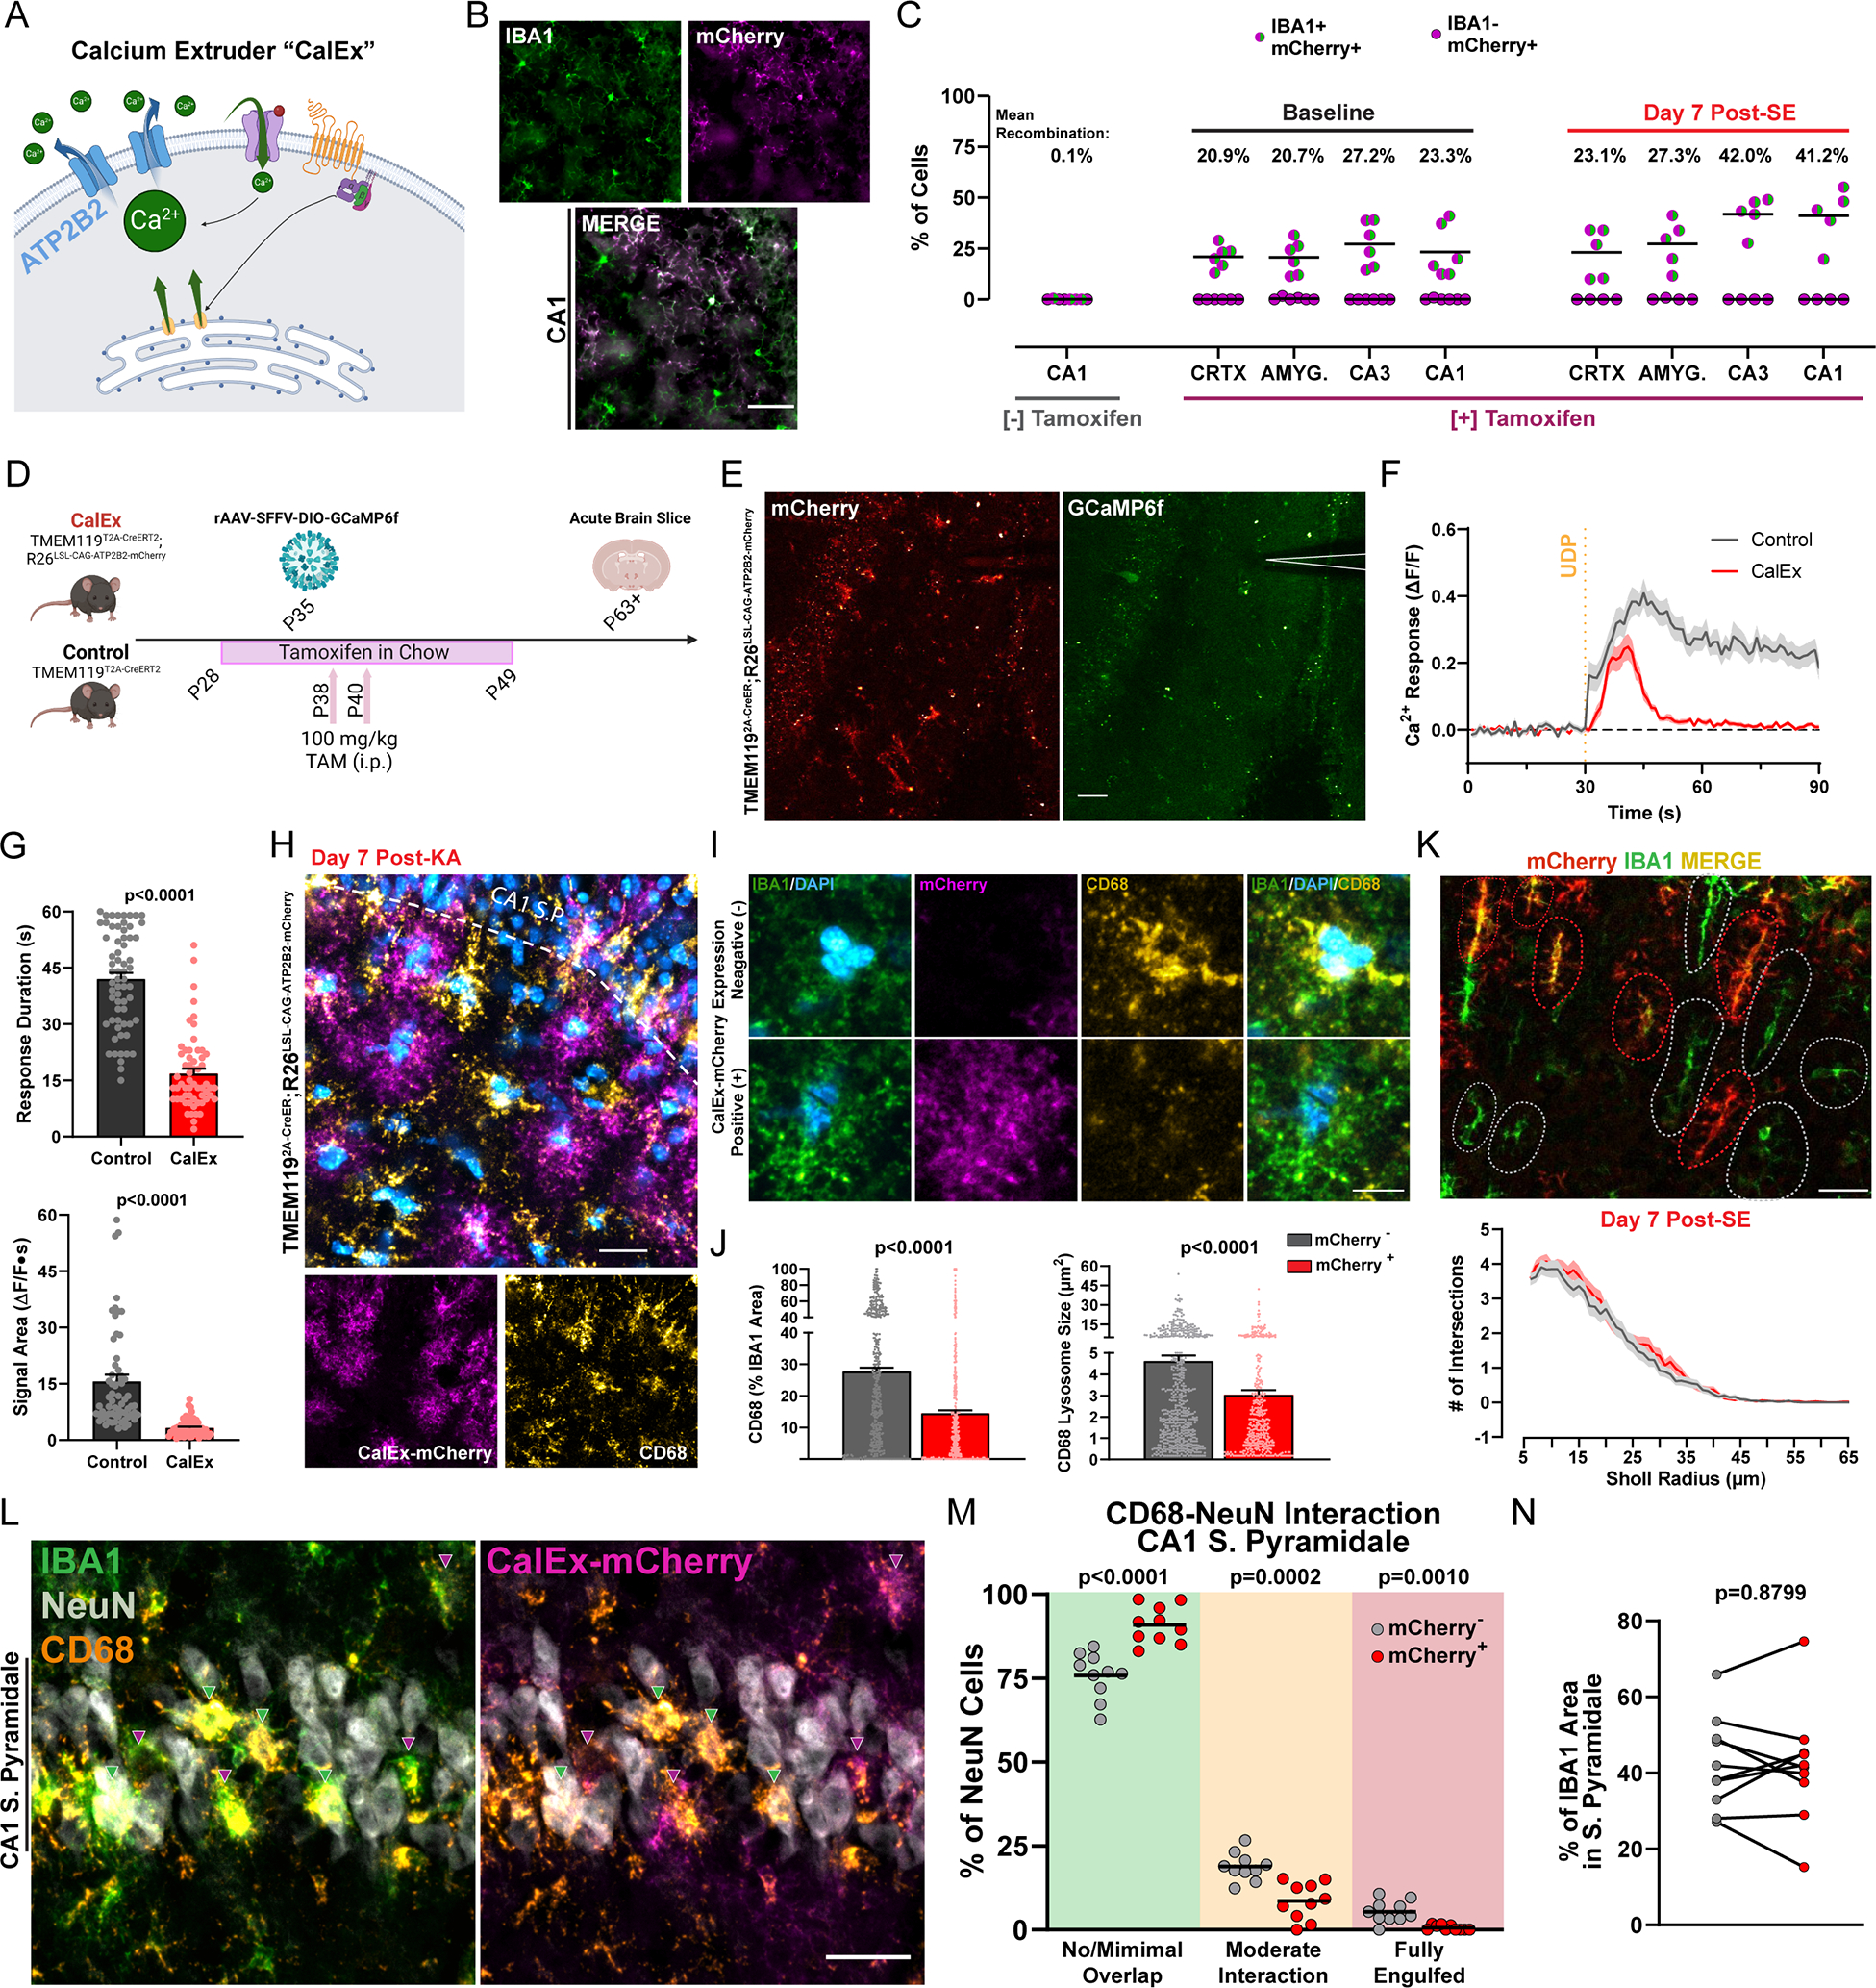
Microglial calcium signaling is rare in a baseline state but strongly engaged during early epilepsy development. The mechanism(s) governing microglial calcium signaling are not known. By developing an in vivo uridine diphosphate (UDP) fluorescent sensor, GRABUDP1.0, we discovered that UDP release is a conserved response to seizures and excitotoxicity across brain regions. UDP can signal through the microglial-enriched P2Y6 receptor to increase calcium activity during epileptogenesis. P2Y6 calcium activity is associated with lysosome biogenesis and enhanced production of NF-κB-related cytokines. In the hippocampus, knockout of the P2Y6 receptor prevents microglia from fully engulfing neurons. Attenuating microglial calcium signaling through calcium extruder ("CalEx") expression recapitulates multiple features of P2Y6 knockout, including reduced lysosome biogenesis and phagocytic interactions. Ultimately, P2Y6 knockout mice retain more CA3 neurons and better cognitive task performance during epileptogenesis. Our results demonstrate that P2Y6 signaling impacts multiple aspects of myeloid cell immune function during epileptogenesis.

Keywords: CalEx; GRAB sensor; P2Y6; UDP; calcium signaling; inflammation; microglia; phagocytosis; purine; seizures.


Conflict of interest statement

Declaration of interests Y. Li is a member of the Neuron advisory board.

Figures

Figure 1:
Figure 1:. UDP engages microglial calcium signaling through P2Y6 receptors, with enhanced sensitivity during epileptogenesis
(A) Image of an acute brain slice expressing GCaMP6s in microglia. Scale bar, 100 μm. (B) Microglial calcium responses to ATP or UDP application (whole-cell ROIs). Inset: response duration (N=3 mice; unpaired T-test). (C) Overall calcium responses to aCSF or purine application. Two-Way ANOVA with Dunnett’s post-hoc comparison to aCSF, or Sidak’s post-hoc test (UDP vs ATP; 4–6 slices from N=3–4 mice). (D) Calcium responses to UDP alone or in a paired trial with a P2Y6 antagonist (MRS-2578). (E) Effects of antagonists on UDP calcium responses (dot: paired trial; N=4). One-Way ANOVA with Dunnett’s post-hoc comparison to desensitization (orange horizontal line; see STAR Methods). (F-H) Microglial whole-cell calcium responses to 500 μM UDP application in cortex (F), CA1 (G), or CA3 (H). (2 slices per mouse, N=3–4). One-Way ANOVA with Dunnett’s post-hoc comparison to baseline (trial average data). (I) Top: Images of P2ry6 puncta near Aldh1l1, Rbfox3, or Tmem119 nuclei. Scale bar, 5 μm. Bottom: Quantification of P2ry6 puncta near different cell types (N=5 naïve C57 WT mice). The red line represents a negative control (false inclusion) threshold (see STAR Methods). (J) Representative in situ hybridization image from the CA3 region 7 days after KA-SE. Scale bar, 25 μm. (K) Top: P2ry6 mRNA near Tmem119+ nuclei in the CA3 across time points. Scale bar, 5 μm. Bottom: Quantification of P2ry6 puncta across time points. One-Way ANOVA with Dunnett’s post-hoc comparison to baseline for each region (N=5 naïve WT mice and N=4 WT mice day 3 and day 7). Bar or line graphs: mean ± SEM. Small dots: individual ROI (B, F-H); large circles: slice/tissue average (F-K).
Figure 2:
Figure 2:. Development of a fluorescent sensor for in vivo imaging of extracellular UDP
(A) Engineering the UDP biosensor. (B) Optimization of the UDP sensor through a three-step process, including insertion site optimization, linker truncation, and linker sequence optimization, yielding the UDP1.0 variant (see Figures S1A, S1B). (C) Images and corresponding ΔF/F trace of UDP1.0 fluorescence under basal conditions, following 10 μM UDP application, and following 20 U/mL apyrase grade VII (apyr.) treatment (HEK293T cells). Scale bar, 20 μm. (D) Summary of peak UDP1.0 ΔF/F amplitudes. One-Way ANOVA with Tukey’s post-hoc test (n=90 total cellular ROIs). (E) One-photon excitation (Ex) and emission (Em) spectra for UDP1.0 in the presence of 10 μM UDP (solid lines), or 5 U/mL apyrase (dashed lines). (F) Comparison of UDP responses in the presence of non-selective P2Y receptor antagonists, or other purine agonists, neurotransmitters, and saline. Peak ΔF/F responses were normalized to UDP. One-Way ANOVA with post-hoc UDP comparison. (G) UDP1.0 fluorescent response curves for purinergic ligands and associated EC50 values (see STAR Methods for fitting; n=3–6 wells; 300–500 cells/well). (H) Left, schematic of the complementation assay. Right, total luminescence emitted by cells co-transfected with LgBit-mGq alone (control), LgBit-mGq with cP2Y6-SmBit, or LgBit-mGq with UDP1.0-SmBit. One-Way ANOVA with Tukey’s post-hoc test (n=3 wells/group). (I) UDP1.0 fluorescence in HEK cells with 2 hr UDP incubation (100 μM). One-Way ANOVA with post-hoc comparison to UDP incubation start: P≥0.8934. Scale bar, 10 μm. (solid line: mean ± SEM; dashed line: one of three wells containing 300–500 cells). (J) Schematic illustration of the UDP1.0 acute brain slice characterization experiments. (K) UDP1.0 fluorescent responses to UDP or ATP (left) and example traces (right: overall ΔF/F mean ± SEM response from n=4–6 trials). (L) Summary UDP1.0 signal response areas for different purinergic signals in brain slice (mean ± SEM from 4–8 independent trials and slices from N=3–4 mice).
Figure 3:
Figure 3:. Enhanced UDP release occurs following status epilepticus
(A) In vivo 2-photon study timeline and image of UDP1.0 expression in the somatosensory cortex. Scale bar, 100μm. Example UDP event fluorescence and corresponding ΔF/F traces. Scale bar, 20μm. (B) Examples of Type 1 ‘sharp-peak’ and Type 2 UDP events (ΔF/F traces aligned to rise start time). (C) Modeling Type 1 and Type 2 rise kinetics (peak normalized) with transient or prolonged UDP application ex vivo (gray trace). (D) Example UDP sensor signals (top, ΔF/F) and sensor event size/location under the cranial window (bottom). The number of ΔF/F signals displayed (top) conveys frequency (box: mean ± S.E.M events per 30 min recording). Event size/location displays all events aggregated across a longitudinal cohort of N=3–5. (E) Duration of UDP release events (dot: a single event). (F) The cumulative area covered by UDP sensor events over a 30 min period (dot: one imaging region). (G) The cumulative UDP ΔF/F∙s signal recorded over a 30 min period (dot: one imaging region). (H) Overlay of UDP sensor events ex vivo in the CA3 region of hippocampus. Scale bar, 70μm. Event scale as in (D). (I) Quantification of cumulative UDP release area and UDP release event frequency per 30 min. One-Way ANOVA with Dunnett’s post-hoc comparison to baseline (dot: one CA3 region surveyed per slice; 2–3 slices and N=4 mice per time point). Data represent the mean ± SEM. D-G: Longitudinal study of 2 non-overlapping regions from N=3–5 mice. E-G: One-Way ANOVA with Fisher’s post-hoc testing vs. baseline for statistical comparison.
Figure 4:
Figure 4:. Microglial calcium elevations during epileptogenesis are P2Y6 dependent
(A) Experimental timeline and example field of view for in vivo, longitudinal calcium imaging of microglia. Scale bar, 40 μm (B) (Top) Examples of inactive, low, and high-level microglial process calcium signaling. Scale bar: 1-fold ΔF/F and 60s. (Bottom) Microglial process calcium activity distributions (ΔF/F∙s) at baseline and 3 days after KA-SE. (C) Heatmaps of microglial GCaMP6s calcium activity (ΔF/F) by genotype and time period (30 process ROIs chosen to match inactive/low/high activity distributions—left color bar). (D) Percentage of total microglia process ROIs exhibiting no, low, or high activity between genotypes. Two-way ANOVA with Sidak’s post-hoc test between activity levels (p-value compares high-level activity). (E) Overall calcium activity across two weeks of epileptogenesis. Two-way ANOVA with Sidak’s post-hoc test (dotted lines represent a longitudinal imaging region; dots represent group mean ± SEM). (F) Comparison of the aggregate KA dose needed to reach SE between genotypes. Mann-Whitney test (N=17 P2ry6+/+ mice and N=16 P2ry6−/− across 3 independent cohorts). (G) (Top) 2P images of microglia in acute brain slice CA1. (Bottom) Spontaneous calcium activity in CA1 microglia across epileptogenesis. Two-Way ANOVA with Sidak’s post-hoc test of slice averages (small dot: one process ROI; large circle: slice average; survey of 2 slices/mouse and N=3–4 mice/group). (H) As in (G), for microglial processes of the CA3 region. Scale bar, 50 μm. (I) In vivo average intensity images of microglia to indicate process motility. Scale bar, 15μm. (J) Percentage of processes that extend outward, remain stable, or retract during in vivo imaging. Two-way ANOVA with Sidak’s post-hoc test: no significant motility differences between genotypes (p=0.5505–0.9965 by motility type). Bars represent the mean ± SEM. In vivo (A-E): N=4 P2ry6+/+mice, N=6 P2ry6−/− mice with 2 non-overlapping regions surveyed per mouse.
Figure 5:
Figure 5:. P2Y6 activation regulates lysosome biogenesis and facilitates neuronal soma engulfment
(A) CD68 expression across limbic regions 3 days after KA-SE. Scale bar, 100 μm. (B) Quantification of CD68 area. One-way ANOVA with Dunnett’s post-hoc test by region (dots: one region; two regions from N=4–5 mice/group). (C) CD68 expression in CA3 and its localization to regions that are TMEM119+, TMEM119Low, or TMEM119-. Scale bar, 50 μm. (D) (Top) CD68 immunofluorescent area in CA3 colocalized to either TMEM119Low -or- + regions or TMEM119- regions. (Bottom) Quantification of TMEM119-localized CD68 area between genotypes. Student’s T-test (dot: one CA3 region from N=3–5 WT mice/group). (E) Percentage of hippocampal CD68+ cells that are microglia or infiltrating myeloid cells in flow cytometry (see Figure S7 for gating). (F) IBA1 staining in the CA3 region for Sholl analyses. Scale bar, 40μm. (G) (Left) CA3 microglia longest process analyses. Two-Way ANOVA effect of genotype: F(1, 1094)=0.5979, p=0.4395 (dot: one cell). (Right) Sholl plots with representative cell morphologies. Scale bar, 5 μm. N=3–5 mice/group and 10–40 cells/mouse. (H) Correlations between initial seizure severity and either CA3 microglial process length (top) or total CD68 area (bottom). Simple linear regression (dot: one mouse from day 3 and day 7 time points). (I) Histological classification of NeuN neuron (left: DAPI/NeuN signal; right: Imaris surface rendering) and CD68 phagolysosome interactions in CA3 from 3D confocal microscopy. Scale bar, 5μm. (J) The number of CA3 neurons having different CD68 coverage (survey of n=1500–1989 CA3 neurons from 10 CA3 subfields and N=5 mice/group). T-test (minimal and moderate) or Mann-Whitney test (fully engulfed; dot: one CA3 subfield). (K) (Left) A NeuN neuron reaching ‘full engulfment’ criteria is associated with TMEM119 staining. Scale bar, 10 μm. (Right) The proportion of fully-engulfed neurons associated with TMEM119 cells (10 CA3 subfields from N=5 mice).
Figure 6:
Figure 6:. Attenuating calcium signaling through CalEx phenocopies lysosome impairments in microglia
(A) Illustration of ATP2B2 calcium extruder (“CalEx”) function. (B) Images of CalEx-mCherry recombination against an IBA1 co-stain (TMEM1192A-CreER;R26LSL-CAG-ATP2B2-mCherry mice treated with tamoxifen). Scale bar, 30 μm. (C) Quantification of mean recombination by region (dot: one mouse; N=5–6 mice per group). (D) Outline of experimental steps to validate CalEx function in microglia. (E) Example of mCherry fluorescence and rAAV-SFFV-DIO-GCaMP6f calcium activity following 500 μM focal UDP application (acute “CalEx” brain slice). Scale bar, 40 μm. (F) Overall calcium response (ΔF/F) to UDP application (n=69 responding cells in Control tissue and n=59 responding cells in CalEx tissue; 2–4 slices from N=4–5 mice per group). (G) Quantification of 500 μM UDP calcium response duration, and signal area between Control and CalEx microglia. Student’s T-test (same dataset as F). (H) Representative image of CalEx-mCherry and CD68 expression in CA1 SR one week after KA-SE. Scale bar, 25 μm. (I) Closer evaluation of IBA1 and CD68 expression in a representative mCherry+ and mCherry cell. Scale bar, 7 μm. (J) Quantification of average lysosome size and IBA1-normalized CD68 area for mCherry+ and mCherry cells. Student’s T-test (dot: one cell; survey of n=412 mCherry+ microglia and n=568 mCherry- microglia in CA1 SR from N=5 mice/group). (K) IBA1 morphology in CA1 SR with red and gray outlines denoting mCherry+ and mCherry cells, respectively. Scale bar, 20 μm. Sholl plots one week after KA-SE (n=88 mCherry+ and n=103 mCherry cells from N=5 mice/group). (L) Images of the CA1 pyramidal band 7 days after KA-SE, highlighting interactions between neurons and either mCherry IBA1 cells (left; green arrows) or mCherry+ IBA1 cells (right; purple arrows) and their associated CD68 expression. Scale bar, 25 μm. (M) As in Figures 5I and 5J, qualification of NeuN-CD68 interactions in CA1 related to positive or negative mCherry expression. Student’s (minimal and moderate) or Welch’s (fully engulfed) T-test (Dot: one region; bilateral CA1 survey from N=5 mice). (N) Total IBA1 area within the CA1 pyramidal layer as a percentage of the entire field of view. Paired T-test (Dot: one region; same dataset as M). Bar or line graphs display the mean ± SEM.
Figure 7:
Figure 7:. Enhanced pro-inflammatory signaling is coordinated with phagocytosis in P2ry6+/+ microglia
(A) Outline of transcriptomics experiment and microglia isolation 3 days after KA-SE. (B) Top differentially expressed genes (DEGs) in microglia between WT-KO genotypes (log2FC>1.0 and BH-adjusted p<0.1). (C) Key Gene Ontology (GO) terms based upon the DEG set (see STAR Methods). (D) Protein-level evaluation of hippocampal and cortical microglia using high-parameter flow cytometry. (E) Mode-normalized histograms and intensity distributions for microglial P2Y12 and Cx3Cr1 expression. Two-Way ANOVA with Sidak’s post-hoc test (box plots: mean and IQR; whiskers: min to max). (F) UMAPs of TNFα, Pro IL-1β, and CD68 expression in hippocampal microglia (boxes highlight a distinct sub-population between genotypes (UMAPs: 20,100 microglia per genotype from cohort 2: N=4 WT, N=3 KO). (G) Frequency of TNFα, Pro IL-1β, and CD68 expression. One-Way ANOVA with Tukey’s post-hoc test (normalized to mean naïve frequency per cohort/batch; dot: one mouse). (H) As in F, UMAPs of IFNγ, STING, and IL-2 expression in hippocampal microglia. (I) As in G, frequency of IFNγ, STING, and IL-2 marker expression. (J) Pseudocolor plots displaying the NeuN gate, based upon a Fluorescence-Minus-One (FMO) control, with gating applied to hippocampal microglia. (K) Psuedocolor plot with gates to isolate microglial populations which are CD68Low, CD68High, and CD68High SSCHigh. (L) Evaluation of signal intensity differences between P2ry6+/+ hippocampal microglia subpopulations (CD68Low, CD68High, and CD68High;SSCHigh). One-Way ANOVA with Tukey’s post-hoc test (dot: one of three CD68 subpopulation categories from each mouse; dot shape denotes cohort; ****p<0.0001) (M) Representative immunofluorescent imaging of DAPI, IBA1, and IL-1β expression in CA1 by genotype. Scale bar, 25 μm. (N) Correlations between Pro IL-1β intensity and NeuN intensity inside of microglia. Simple linear regression (dot: one mouse). (O) Comparison of different CD68 population frequencies between genotypes in the hippocampus. Chi-squared test (data represent the mean ± SEM). Data aggregated from N=6 naïve mice (4 WT, 2 KO), N=8 P2ry6+/+ KA-SE mice, and N=7 P2ry6−/− KA-SE mice across two independent cohorts.
Figure 8:
Figure 8:. P2Y6 KO mice have improved CA3 neuronal survival and enhanced cognitive task performance.
(A) CA3 NeuN and DAPI staining from post-SE WT and KO tissue. Scale bar, 50 μm. (B) Intensity of the NeuN signal across the CA3 pyramidal band (line plot; see STAR Methods). (C) Quantification of NeuN cell density in the CA3 or CA1 pyramidal band. Two-way ANOVA with Sidak’s post-hoc test (dots: one region; bilateral survey from N=3–5 mice/group). (D) Timeline of Novel Object Recognition (NOR) task. Outline of the task procedure. (E) Representative trial performance in the novel phase during the naïve test. (Top) Distance plot overlaid with periods of novel or familiar object interaction. Scale bar, 1 min. (Bottom) Trace of mouse movement in the arena. (F) Discrimination index scores during the naïve test. Two-Way ANOVA with Sidak’s post-hoc test compares task performance between test phases by genotype (exact p-values). One-sample T-test compares novel performance against chance: 0.50 (purple text). (G) As in (E), representative trial performance 7 days after KA-SE. (H) As in (F), discrimination index 7 days after KA-SE. (I) Total distance moved by trial phase. Two-Way ANOVA with Sidak’s post-hoc test (dot: one mouse). NOR: One cohort of P2ry6+/+ and P2ry6−/− mice tested at baseline and day 7 post-SE (N=6 mice/group; N=6/6 surviving P2ry6+/+; N=5/6 surviving P2ry6−/− at day 7 post-SE).

Update of

References

    1. Eichhoff G, Busche MA, and Garaschuk O (2008). In vivo calcium imaging of the aging and diseased brain. Eur J Nucl Med Mol Imaging 35 Suppl 1, S99–106. 10.1007/s00259-007-0709-6. - DOI - PubMed
    1. Pozner A, Xu B, Palumbos S, Gee JM, Tvrdik P, and Capecchi MR (2015). Intracellular calcium dynamics in cortical microglia responding to focal laser injury in the PC::G5-tdT reporter mouse. Front Mol Neurosci 8, 12. 10.3389/fnmol.2015.00012. - DOI - PMC - PubMed
    1. Umpierre AD, Bystrom LL, Ying Y, Liu YU, Worrell G, and Wu LJ (2020). Microglial calcium signaling is attuned to neuronal activity in awake mice. Elife 9. 10.7554/eLife.56502. - DOI - PMC - PubMed
    1. Riester K, Brawek B, Savitska D, Frohlich N, Zirdum E, Mojtahedi N, Heneka MT, and Garaschuk O (2020). In vivo characterization of functional states of cortical microglia during peripheral inflammation. Brain Behav Immun 87, 243–255. 10.1016/j.bbi.2019.12.007. - DOI - PubMed
    1. Eichhoff G, Brawek B, and Garaschuk O (2011). Microglial calcium signal acts as a rapid sensor of single neuron damage in vivo. Biochim Biophys Acta 1813, 1014–1024. 10.1016/j.bbamcr.2010.10.018. - DOI - PubMed

LinkOut - more resources