. 2024 May:103:105102.
doi: 10.1016/j.ebiom.2024.105102. Epub 2024 Apr 12.

Spatial and single-cell colocalisation analysis reveals MDK-mediated immunosuppressive environment with regulatory T cells in colorectal carcinogenesis

Affiliations

Spatial and single-cell colocalisation analysis reveals MDK-mediated immunosuppressive environment with regulatory T cells in colorectal carcinogenesis

Masahiro Hashimoto et al. EBioMedicine. 2024 May.

Abstract

Background: Cell-cell interaction factors that facilitate the progression of adenoma to sporadic colorectal cancer (CRC) remain unclear, thereby hindering patient survival.

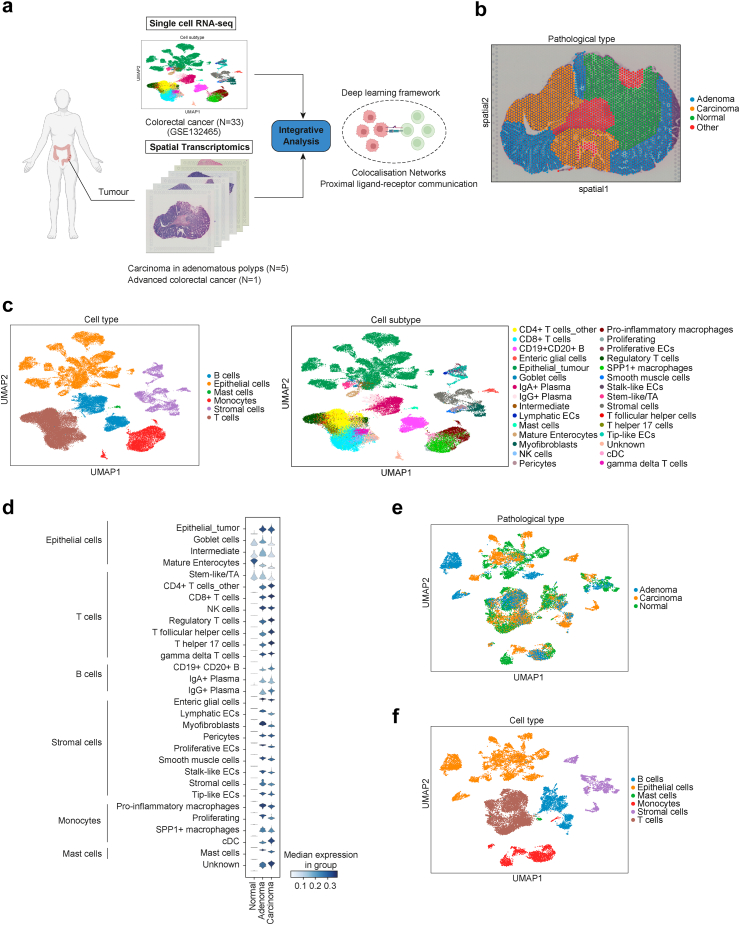
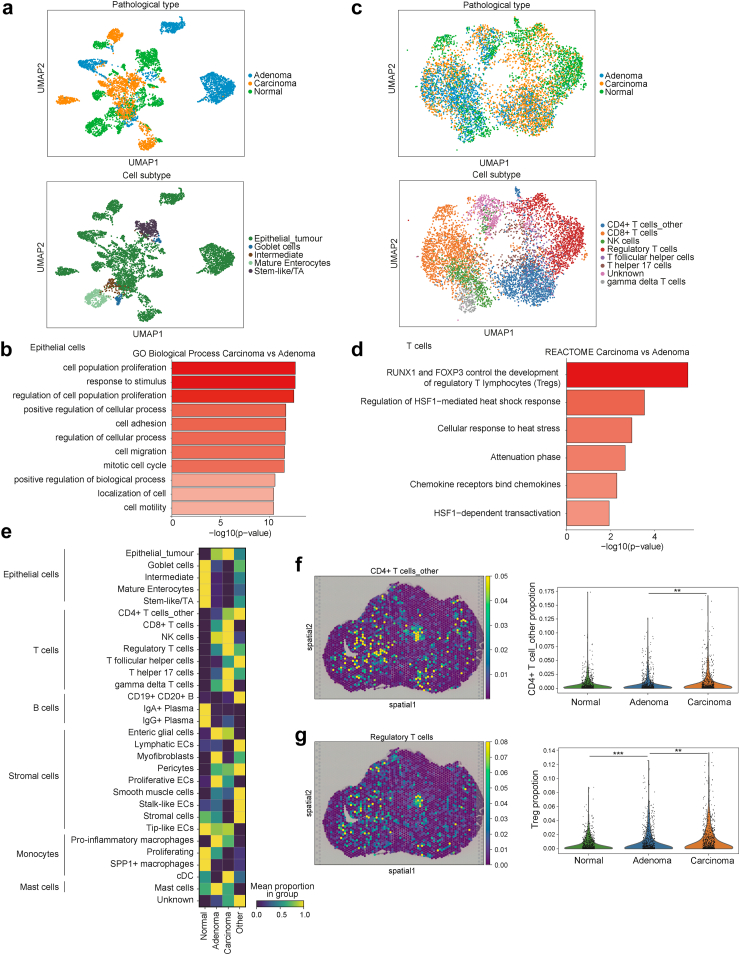
Methods: We performed spatial transcriptomics on five early CRC cases, which included adenoma and carcinoma, and one advanced CRC. To elucidate cell-cell interactions within the tumour microenvironment (TME), we investigated the colocalisation network at single-cell resolution using a deep generative model for colocalisation analysis, combined with a single-cell transcriptome, and assessed the clinical significance in CRC patients.

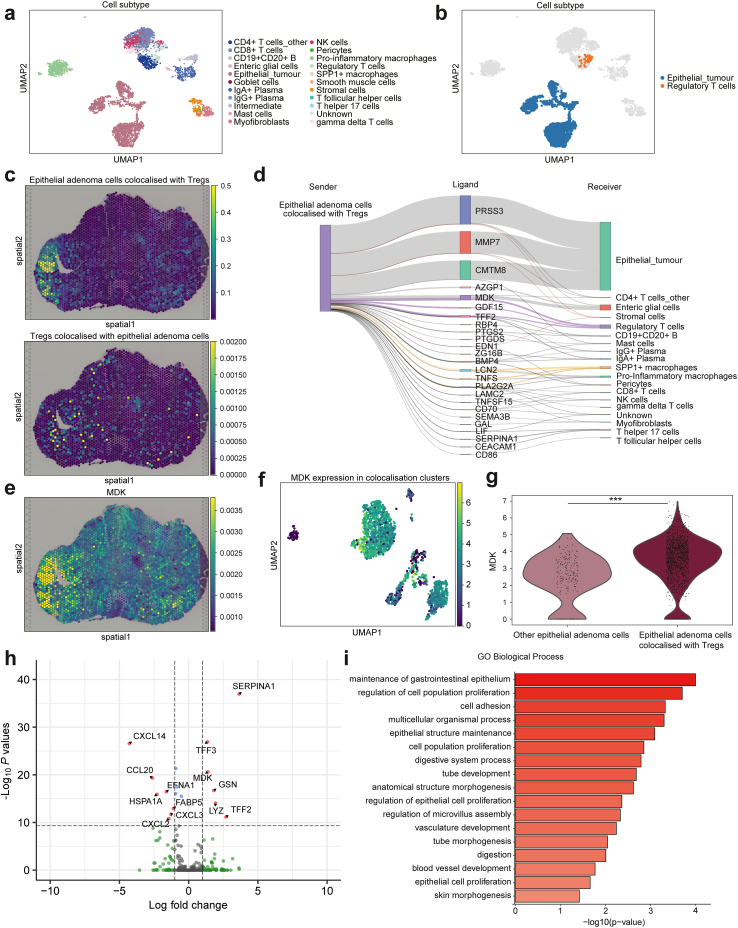
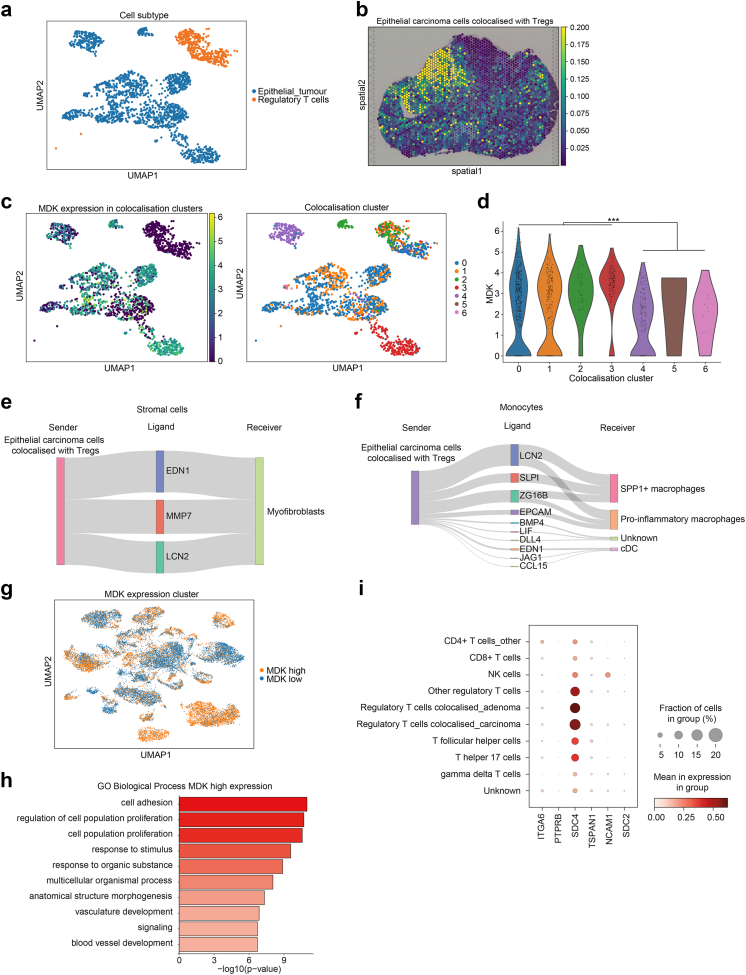
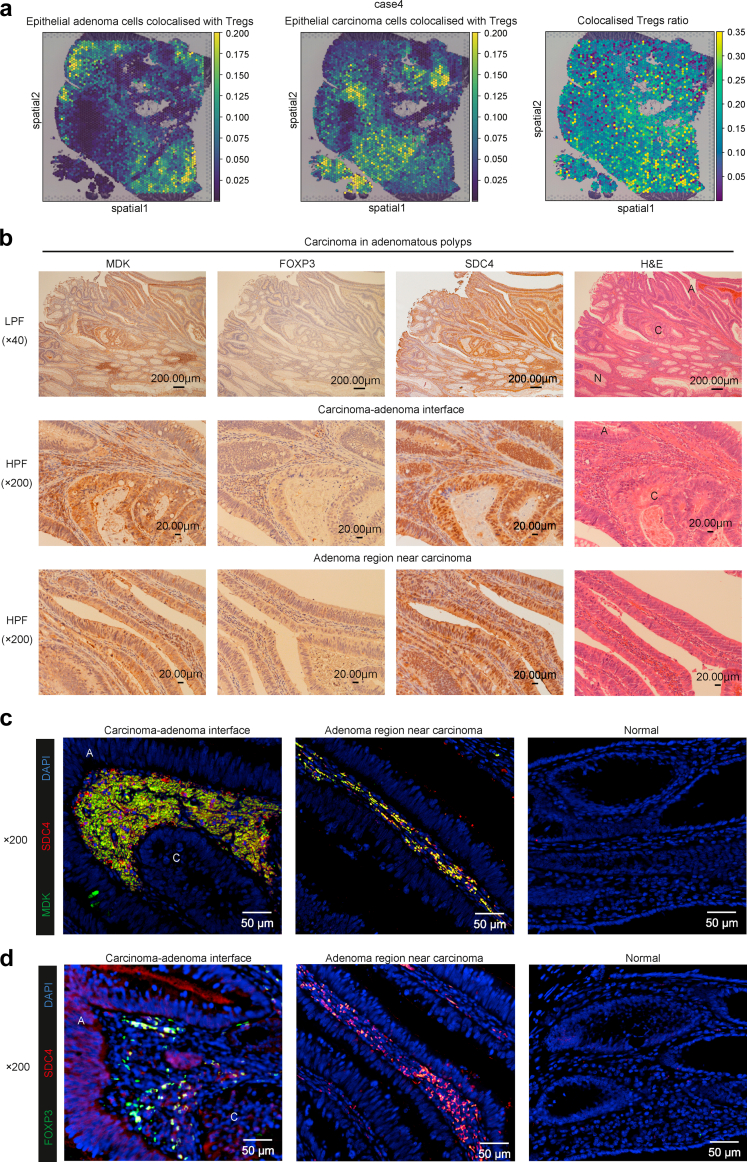
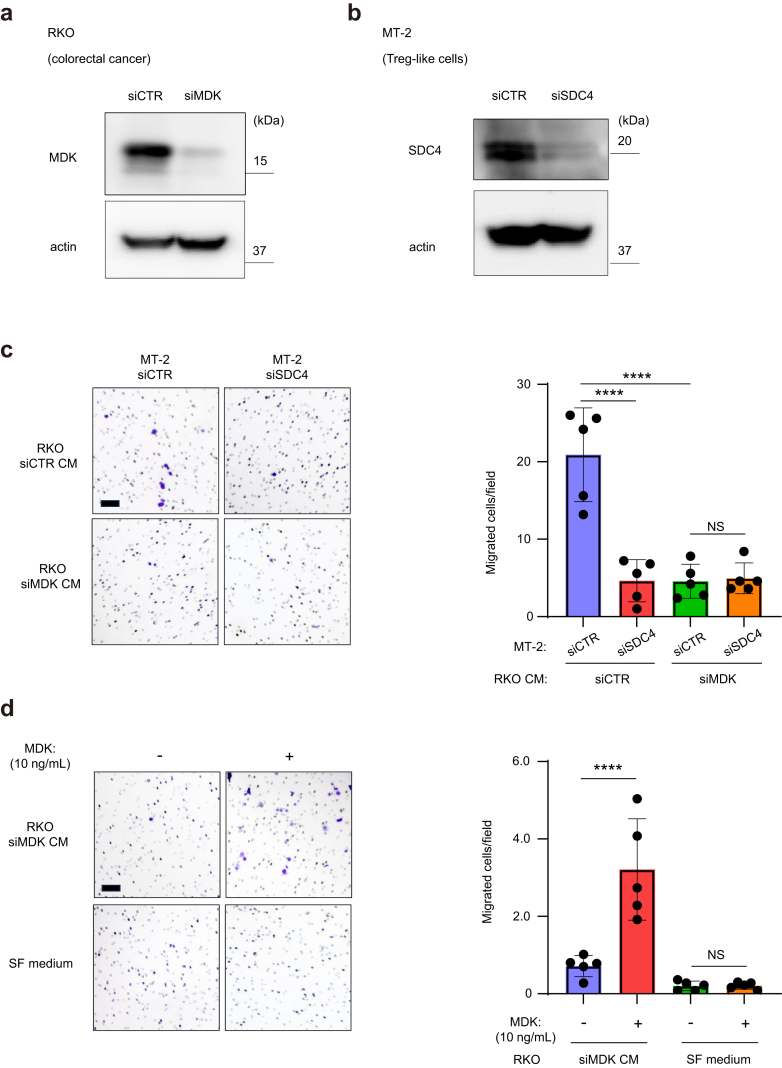
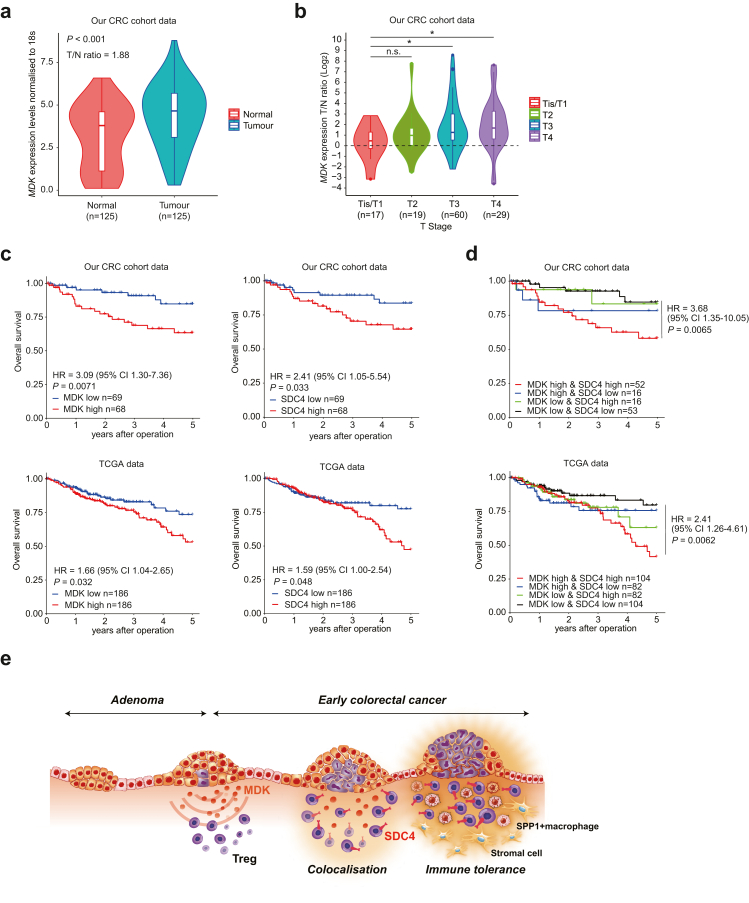
Findings: CRC cells colocalised with regulatory T cells (Tregs) at the adenoma-carcinoma interface. At early-stage carcinogenesis, cell-cell interaction inference between colocalised adenoma and cancer epithelial cells and Tregs based on the spatial distribution of single cells highlighted midkine (MDK) as a prominent signalling molecule sent from tumour epithelial cells to Tregs. Interaction between MDK-high CRC cells and SPP1+ macrophages and stromal cells proved to be the mechanism underlying immunosuppression in the TME. Additionally, we identified syndecan4 (SDC4) as a receptor for MDK associated with Treg colocalisation. Finally, clinical analysis using CRC datasets indicated that increased MDK/SDC4 levels correlated with poor overall survival in CRC patients.

Interpretation: MDK is involved in the immune tolerance shown by Tregs to tumour growth. MDK-mediated formation of the TME could be a potential target for early diagnosis and treatment of CRC.

Funding: Japan Society for the Promotion of Science (JSPS) Grant-in-Aid for Science Research; OITA Cancer Research Foundation; AMED under Grant Number; Japan Science and Technology Agency (JST); Takeda Science Foundation; The Princess Takamatsu Cancer Research Fund.

Keywords: Colorectal cancer; Immune tolerance; MDK; SDC4; Single-cell RNA sequencing; Spatial transcriptomics.


Conflict of interest statement

Declaration of interests The authors declare no competing interests.

Figures

Fig. 1
Fig. 1
Single-cell decomposition of scRNA-seq colorectal cancer (CRC) dataset and spatial mapping of single cells. (a) Schematic of library collection and integrative analysis of single-cell and spatial transcriptomics of CRC. (b) Spatial visualisation of clustering on the CRC sample slide. (c) Uniform manifold approximation and projection (UMAP) of all colorectal cancer cell types and subtypes. (d) Stacked violin plots of spatial assignment to each pathological diagnosis for 30 cell subtypes. (e and f) UMAP of specific tissue origins (e) and cell types (f) after the definition of cell origin filtering of the top-10% based on each pathological diagnosis.
Fig. 2
Fig. 2
Characteristics of epithelial and T cells and cell proportions in spatial distribution. (a) Uniform manifold approximation and projection (UMAP) of epithelial cells in spatial distribution after filtering. (b) Gene ontology (GO) analysis of biological process comparing carcinoma and adenoma epithelial cells. (c) UMAP of T cells in spatial distribution after filtering. (d) Reactome pathway analysis comparing carcinoma and adenoma T cells. (e) Heatmap of the mean proportion values per spatial pathological diagnosis of each cell subtype. (f and g) Spatial distribution following the reconstruction of spatial gene expression patterns and violin plots of proportions based on pathological diagnosis, in CD4+ T cells_other (f) and regulatory T cells (g); ∗∗, p < 0.01; ∗∗∗, p < 0.001; p values were determined using Welch's t-test.
Fig. 3
Fig. 3
Colocalisation analysis and cell–cell interaction of adenoma epithelial cells and regulatory T cells. (a) Uniform manifold approximation and projection (UMAP) of cell subtypes in adenoma cluster. (b) Colocalisation clusters between adenoma epithelial cells and regulatory T cells (Tregs) in UMAP representation across all adenoma cells. (c) Spatial distribution of colocalised adenoma epithelial cells (upper) and Tregs (lower). (d) Ligand activity between colocalised single cells from epithelial adenoma cells colocalised with Tregs to other cells. The widths of the lines correspond to the ligand activity scores. (e) Imputed MDK expression in spatial distribution. (f) MDK normalised expression in colocalised cell populations in UMAP representation. (g) Violin plot representing MDK normalised expression in colocalised adenoma epithelial cells and other epithelial adenoma cells. ∗∗∗p < 0.001. p values were determined using the Wilcoxon rank-sum test and Benjamini–Hochberg method. (h) Volcano plot representing the differentially expressed ligand genes between colocalised adenoma epithelial cells and other adenoma epithelial cells. p values were determined using the Wilcoxon rank-sum test and Benjamini–Hochberg method. (i) Gene ontology (GO) analysis of biological process comparing colocalised adenoma epithelial cells and other adenoma epithelial cells.
Fig. 4
Fig. 4
Colocalisation analysis in carcinoma epithelial cells and cellular distribution of ligand-receptor genes in single cells. (a) Colocalisation clusters between carcinoma epithelial cells and regulatory T cells (Tregs) in uniform manifold approximation and projection (UMAP) representation. (b) Spatial distribution of colocalised adenoma epithelial cells with Tregs. (c) MDK normalised expression and colocalisation cluster distribution in colocalised cell populations in UMAP representation. (d) Violin plot of MDK normalised expression levels by colocalisation clusters. ∗∗∗p < 0.001. p values were determined using the Wilcoxon rank-sum test and Benjamini–Hochberg method. (e and f) Ligand activity initiating from epithelial carcinoma cells colocalised with regulatory T cells (Tregs) to colocalised stromal cells (e) and monocyte cells (f) The widths of the lines correspond to the ligand activity scores in e and f. (g) UMAP distribution in comparison of epithelial cells with high and low MDK expression divided by median MDK expression levels. (h) comparative Gene ontology (GO) analysis of biological processes associated with high and low MDK expression in epithelial cells. (i) Dot plot of the expression and proportion of MDK receptor genes per cell subtype in T cells; the circle size represents the cell proportion.
Fig. 5
Fig. 5
Distribution of colocalised cells between epithelial cells and regulatory T cells and MDK, FOXP3, and SDC4 expression in carcinoma in adenomatous polyps. (a) Spatial distribution of epithelial cells colocalised with regulatory T cells (Tregs) and colocalised Tregs ratio in other carcinoma in adenomatous polyps, case 4. Colocalised Tregs ratio is calculated as the proportion of Tregs colocalised with epithelial tumour cells among all Tregs. (b) Immunostaining of MDK, FOXP3, and SDC4 in carcinoma in adenomatous polyps. Pathological diagnosis by H&E staining; N: normal tissue, A: adenoma tissue, C: carcinoma tissue. (c) Immunofluorescence images of MDK, SDC4, and DAPI expression in carcinoma in adenomatous polyps. (d) Immunofluorescence images of FOXP3, SDC4, and DAPI expression in carcinoma in adenomatous polyps. A: adenoma tissue; C: carcinoma tissue.
Fig. 6
Fig. 6
MDK and SDC4 promote the migration of Treg-like cells in colorectal cancer (CRC) cells. (a) Immunoblotting for MDK in control and MDK-knockdown CRC cells (RKO). (b) Immunoblotting for SDC4 in control and SDC4-knockdown Treg-like cells (MT-2). (c) Transwell migration assays of control and SDC4-knockdown MT-2 cells with conditioned medium of control and MDK-knockdown RKO cells. (d) Transwell migration assays of MT-2 cells with conditioned medium of MDK-knockdown RKO cells and serum-free medium containing 10 ng/ml of recombinant human MDK; NS, p > 0.05; ∗∗∗∗, p < 0.0001. p values were determined using one-way ANOVA, followed by Dunnett's multiple comparisons test. Scale bar, 100 μm.
Fig. 7
Fig. 7
Clinical significance of MDK and SDC4 expression in human colorectal cancer (CRC). (a) MDK mRNA expression in 125 CRC tissues and paired normal colon tissues in our CRC cohort dataset, assessed using RT-quantitative PCR; p values were determined using the Wilcoxon rank sum test. (b) Expression ratio of MDK in tumour and normal tissues by pathological T stage; NS, p > 0.05; ∗, p < 0.05. p values were determined using one-way ANOVA, followed by Dunnett's multiple comparisons test. (c) Overall survival rate in CRC patients according to MDK and SDC4 mRNA expression in tumour tissues in our CRC cohort data (top) and The Cancer Genomics Atlas (TCGA) data (bottom). (d) Overall survival rate in CRC patients by the combination of MDK and SDC4 mRNA expression in tumour tissues in our CRC cohort data (top) and TCGA data (bottom). Overall survival was estimated using the Kaplan–Meier method, and survival curves were compared using the log-rank test. CI: confidence interval; HR: hazard ratio. (e) Schematic of tumour MDK-mediated immunosuppressive environment in early CRC.

References

    1. Bray F., Ferlay J., Soerjomataram I., Siegel R.L., Torre L.A., Jemal A. Global cancer statistics 2018: GLOBOCAN estimates of incidence and mortality worldwide for 36 cancers in 185 countries. CA Cancer J Clin. 2018;68(6):394–424. - PubMed
    1. Lichtenstein P., Holm N.V., Verkasalo P.K., et al. Environmental and heritable factors in the causation of cancer--analyses of cohorts of twins from Sweden, Denmark, and Finland. N Engl J Med. 2000;343(2):78–85. - PubMed
    1. Leslie A., Carey F.A., Pratt N.R., Steele R.J. The colorectal adenoma-carcinoma sequence. Br J Surg. 2002;89(7):845–860. - PubMed
    1. Bond J.H. Clinical evidence for the adenoma-carcinoma sequence, and the management of patients with colorectal adenomas. Semin Gastrointest Dis. 2000;11:176–184. - PubMed
    1. Corley D.A., Jensen C.D., Marks A.R., et al. Adenoma detection rate and risk of colorectal cancer and death. N Engl J Med. 2014;370(14):1298–1306. - PMC - PubMed

MeSH terms