. 2024 Apr 13;15(1):3200.
doi: 10.1038/s41467-024-47315-3.

Inhibition of ACSS2-mediated histone crotonylation alleviates kidney fibrosis via IL-1β-dependent macrophage activation and tubular cell senescence

Affiliations

Inhibition of ACSS2-mediated histone crotonylation alleviates kidney fibrosis via IL-1β-dependent macrophage activation and tubular cell senescence

Lingzhi Li et al. Nat Commun. .

Abstract

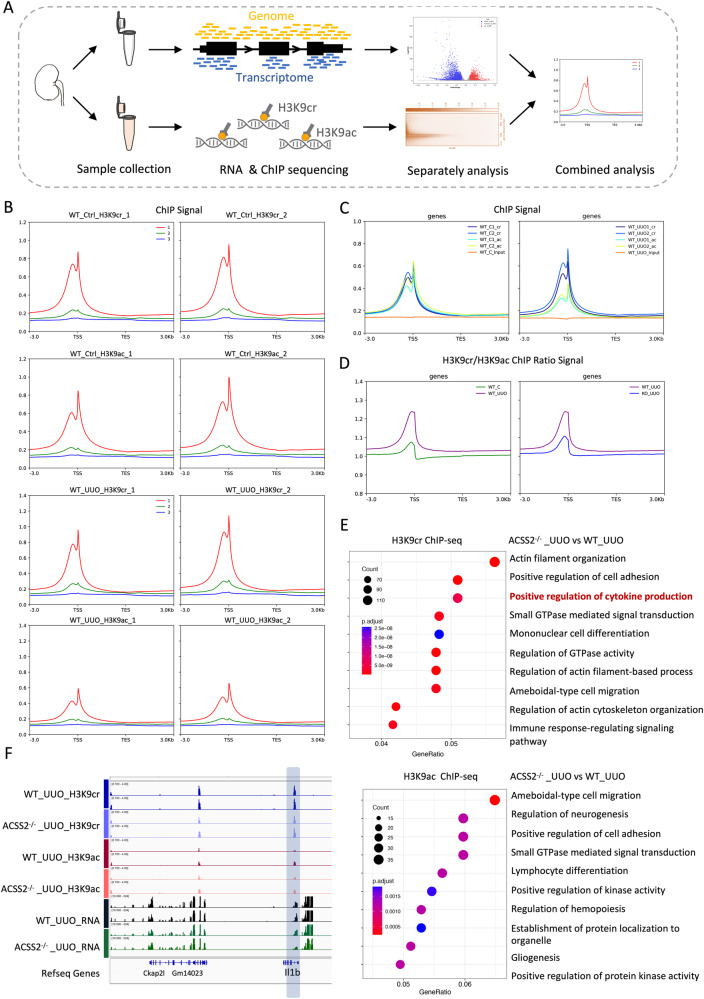
Histone lysine crotonylation (Kcr), as a posttranslational modification, is widespread as acetylation (Kac); however, its roles are largely unknown in kidney fibrosis. In this study, we report that histone Kcr of tubular epithelial cells is abnormally elevated in fibrotic kidneys. By screening these crotonylated/acetylated factors, a crotonyl-CoA-producing enzyme ACSS2 (acyl-CoA synthetase short chain family member 2) is found to remarkably increase histone 3 lysine 9 crotonylation (H3K9cr) level without influencing H3K9ac in kidneys and tubular epithelial cells. The integrated analysis of ChIP-seq and RNA-seq of fibrotic kidneys reveal that the hub proinflammatory cytokine IL-1β, which is regulated by H3K9cr, play crucial roles in fibrogenesis. Furthermore, genetic and pharmacologic inhibition of ACSS2 both suppress H3K9cr-mediated IL-1β expression, which thereby alleviate IL-1β-dependent macrophage activation and tubular cell senescence to delay renal fibrosis. Collectively, our findings uncover that H3K9cr exerts a critical, previously unrecognized role in kidney fibrosis, where ACSS2 represents an attractive drug target to slow fibrotic kidney disease progression.


Conflict of interest statement

The authors declare no competing interests.

Figures

Fig. 1
Fig. 1. The increased levels of crotonylation in human renal biopsies of CKD and fibrotic kidneys from mice.
A Representative IHC staining of pan-Kcr antibody in healthy control subjects and patients with chronic kidney diseases. Scale bar: upper panels: 50 μm; lower panels:20 μm. B Quantitative IHC analysis of pan-Kcr level in renal nuclear from control and patients with chronic kidney diseases using ImageJ 6.0 software; using Pearson correlation statistical analysis, two-sided statistical tests. (n = 6 for ANCA, n = 9 for DN, n = 3 for IgA, n = 3 for FSGS). C IF staining of H3K9cr (green) and DAPI (blue) in control and UUO kidneys. (n = 3 per group). Scale bar: 20 μm. D Flow chart of the process to collect histone. E Protein expression of H3K9cr, H3K9ac and H3 in fibrotic kidneys of UUO mice were determined by western blotting (n = 5 to 6 animals per group). IHC immunohistochemical, pan-Kcr pan anti-crotonyllysine, IF Immunofluorescence, FAN folic acid nephropathy, UUO unilateral ureteric obstruction, ANCA anti-neutrophil cytoplasmic antibodies, DN diabetic nephropathy, IgAN IgA nephropathy, FSGS focal segmental glomerulosclerosis. Triangle: representative positive staining of pan-Kcr. Statistical analysis by Pearson correlation.
Fig. 2
Fig. 2. Global deletion of ACSS2 suppressed H3K9cr level and alleviated kidney fibrosis in mice.
A Schematic overview of process for screening factors influencing H3K9cr in vitro and experimental design in ACSS2-/- mouse. B Protein level and quantitative analysis of H3K9cr, H3K9ac, and H3 in whole kidney lysates of control and UUO of WT and ACSS2-/- mice (n = 3 per group, Control vs. UUO: p = 0.032; UUO vs. ACSS2KO + UUO: p = 0.03). C Representative images of H&E staining in UUO of WT and ACSS2-/- mice (n = 6 per group). Scale bar: 200 μm. D FN1, COL6, α-SMA, and GAPDH immunoblotting in the whole kidney lysates of control and UUO of WT and ACSS2-/- mice (n = 3 per group). E mRNA levels of Fn1, Col1a1 and Acta2 in whole kidney lysates of WT and ACSS2-/- mice treated with UUO (n = 5 per group, Control vs. UUO: p < 0.001 for Fn1, p < 0.001 for Col1a, p < 0.001 for Acta2; UUO vs. ACSS2-/- + UUO: p < 0.001 for Fn1, p = 0.007 for Col1a, p < 0.001 for Acta2). FAN: folic acid nephropathy; UUO: unilateral ureteric obstruction; WT: wild type; ACSS2-/-: ACSS2 knockout; Ctrl: Control. Data shown are means ± SEM. Statistical analysis by one-way ANOVA with Tukey’s post hoc test. *p < 0.05, **p < 0.01 and ***p < 0.001.
Fig. 3
Fig. 3. TEC-specific deletion of ACSS2 suppressed H3K9cr level and alleviated fibrosis in mice.
A Representative IHC staining of ACSS2 in kidneys of control and mice treated with UUO or injected with FAN (n = 3 per group). Scale bar: upper panels: 50 μm; lower panels:20 μm. B Design strategy of TEC-specific deletion of ACSS2 (ACSS2tecKO) mice. C H3K9cr, H3K9ac and H3 immunoblotting and quantification of these immunoblots in the whole kidney lysates of control and UUO of WT and ACSS2tecKO mice (n = 3 per group, Control vs UUO: p = 0.0212;UUO vs ACSS2CKO + UUO: p = 0.0106). D Representative images of H&E and Masson staining in kidneys of UUO of WT and ACSS2tecKO mice (n = 3 per group). Scale bar: upper panels: 100 μm; lower panels: 50 μm. E FN1, COL1a1, COL6 and GAPDH immunoblotting in the whole kidney lysates of control and UUO of WT and ACSS2tecKO mice (n = 3 per group). F mRNA levels of Fn1, Col1a1, Acta2 or Col6 in whole kidney lysates of WT and ACSS2tecKO mice treated with UUO (n = 6 per group, Control vs. UUO: p < 0.0001 for Fn1, p < 0.0001 for Col1a, p < 0.0001 for Acta2; UUO vs. ACSS2CKO + UUO: p = 0.0055 for Fn1, p = 0.0011 for Col1a, p = 0.0456 for Acta2). UUO unilateral ureteric obstruction, WT wild type, IHC Immunohistochemical, ACSS2 CKO tubular epithelial cell-specific deletion of ACSS2. Triangle: representative positive staining of ACSS2. Data shown are means ± SEM. Statistical analysis by one-way ANOVA with Tukey’s post hoc test. *p < 0.05, **p < 0.01, ***p < 0.001 and ****p < 0.0001.
Fig. 4
Fig. 4. Integrated analysis of ChIP sequencing and RNA sequencing in kidneys of control and UUO from WT and ACSS2-/- mice.
A Outline of bioinformatic analysis strategy. B All genes were split into 3 equal groups based on their expression levels calculated from RNA-seq. Mean H3K9cr and H3K9ac ChIP signals are shown for each tertile of gene expression and shown as different colored lines (red line is the gene expressed highest, and blue line is the gene expressed lowest) in both control and UUO mice. C H3K9cr, H3K9ac, and input ChIP signals are shown in both control and UUO mice. TSS, transcriptional start site; TES, transcriptional termination site. D Mean H3K9cr to H3K9ac ChIP ratios in the control and UUO of WT and ACSS2-/- mice. E Comparable analysis from ChIP sequence between UUO of WT and ACSS2-/- mice using GO database, two-sided statistical tests. F Genome browser representation of RNA-seq reads and ChIP-seq reads for Il1b from UUO of control and ACSS2-/- mice. “Gene count” is the number of genes enriched in a GO (gene ontology) or KEGG (Kyoto Encyclopedia of Genes and Genomes) term. ‘Gene ratio’ is the percentage of total differential expression genes in the given GO/KEGG term. UUO unilateral ureteric obstruction, WT wild type, ACSS2-/-: ACSS2 knockout.
Fig. 5
Fig. 5. The changes of IL-1β expression under different condition.
A Schematic overview of process for screening changes of IL-1β both in vivo and in vitro. B Representative IHC staining of IL-1β in kidneys of control and mice treated with UUO or injected with FA (n = 3 per group). Scale bar: upper panels: 100 μm; lower panels:50 μm. C IL-1β concentration of serum and kidney in control mice and UUO of WT and ACSS2-/- mice tested by ELISA kit (n = 3 per group, Control vs UUO: p = 0.039; UUO vs. ACSS2-/- + UUO: p = 0.0042). D IL-1β immunoblotting and quantification of IL-1β immunoblots normalizing to GAPDH (n = 3 per group, Control vs. UUO: p < 0.001; UUO vs. ACSS2-/- + UUO: p < 0.001), as well as IL-1β mRNA levels (n = 5 per group, Control vs. UUO: p < 0.0001;UUO vs ACSS2-/- + UUO: p < 0.0001). in kidneys of control and UUO from WT and ACSS2-/- mice. E IL-1β immunoblotting and quantification of IL-1β immunoblots normalizing to GAPDH (n = 3 per group, Control vs. UUO: p = 0.0342; UUO vs. ACSS2CKO + UUO: p = 0.0315), as well as IL-1β mRNA levels (n = 6 per group, Control vs. UUO: p < 0.001; UUO vs ACSS2CKO + UUO: p < 0.001). in kidneys of control and UUO from WT and ACSS2tecKO mice. F IF colocalization staining of kidney H3k9cr (yellow), IL-1β (red), and DAPI (blue) in UUO of WT and ACSS2-/- mice (n = 3 per group). Scale bar: 25 μm. Ctrl control, UUO unilateral ureteric obstruction, WT wild type, ACSS2-/- ACSS2 knockout, ACSS2 CKO tubular epithelial cell-specific knock out of ACSS2, IHC immunohistochemical, IF immunofluorescence. Data shown are means ± SEM. Statistical analysis by one-way ANOVA with Tukey’s post hoc test. *p < 0.05, **p < 0.01, ***p < 0.001 and ****p < 0.0001.
Fig. 6
Fig. 6. H3K9cr-derived IL-1β triggered M1 macrophage polarization and tubular senescence, which could be neutralized by anti-IL-1β IgG.
A Schematic overview of process for researching effects of H3K9cr-derived IL-1β on macrophage and tubular cells. B Microscopic images depicted the changes of RAW264.7 cells morphology after stimulation from IL-1β (5 ng/ml) or cellular supernatants collected from HEK-293T cells transfected with ACSS2 plasmids. IL-1β antibody (5 µg/ml) added to neutralize supernatants or IL-1β inverted the morphological changes. Scale bar: 20 μm. C iNOS and IL-1β mRNA levels of RAW264.7 which was stimulated with IL-1β with or without IL-1β antibody neutralization (number of cell wells = 6 per group, control vs IL-1β: p < 0.0001 for iNOS, p < 0.0001 for il1b; IL-1β vs IL-1β+Anti-IL-1β Ab: p = 0.0406 for iNOS, p < 0.0001 for il1b). D iNOS and IL-1β mRNA levels of RAW264.7 which was stimulated with cellular supernatants from HEK-293T cells transfected with ACSS2 plasmids with or without IL-1β antibody neutralization (number of cell wells = 6 per group, control vs supernatants: p = 0.0076 for iNOS, p = 0.0228 for il1b; supernatants vs supernatants+Anti-IL-1β Ab: p = 0.0011 for iNOS, p < 0.0001 for il1b). E P53, IL-1β, Il6, and Mcp1 mRNA levels of TCMK-1 cells which was stimulated with IL-1β (5 µg/ml) with or without IL-1β antibody (5 µg/ml) (number of cell wells = 6 per group, control vs IL-1β: p = 0.0089 for p53, p = 0.0193 for il1b, p < 0.0001 for Mcp1, p < 0.0001 for il6; IL-1β vs IL-1β+Anti-IL-1β Ab: p = 0.0498 for p53, p = 0.0102 for il1b, p < 0.001 for Mcp1, p = 0.002 for il6). F P53, IL-1β, Il6 and Mcp1 mRNA levels of TCMK-1 cells stimulated with cellular supernatants from 293 T cells transfected with ACSS2 plasmids with or without IL-1β antibody neutralization (number of cell wells = 6 per group, control vs supernatants: p = 0.0191 for p53, p < 0.0001 for il1b, p < 0.0001 for Mcp1, p < 0.001 for il6; supernatants vs. supernatants+Anti-IL-1β Ab: p = 0.0068 for p53, p = 0.0367 for il1b, p = 0.0038 for Mcp1, p = 0.025 for il6). ACSS2 OE ACSS2 overexpression. Data shown are means ± SEM. Statistical analysis by one-way ANOVA with Tukey’s post hoc test. *p < 0.05, **p < 0.01, ***p < 0.001 and ****p < 0.0001.
Fig. 7
Fig. 7. Anti-IL-1β IgG inhibited cellular senescence, M1 macrophage markers and further alleviated kidney fibrosis in vivo.
A Treatment strategy of Anti-IL-1β IgG inhibitor for UUO mice. B Representative images of H&E and Masson staining in control and UUO mice treated with IL-1β antibody (10 mg/kg) (n = 3 per group).Scale bar: upper panels: 50 μm; lower panels:20 μm. C Fn1, Col1a1, Col6 and Acta2 mRNA levels in the whole kidney lysates of control and UUO mice treated with IL-1β antibody (10 mg/kg) (number of control and UUO group is 5; number of IL-1β and UUO + IL-1β group is 7, control vs UUO: p < 0.0001 for Col1a, p < 0.0001 for Fn1, p < 0.0001 for Col6, p < 0.0001 for Acta2; UUO vs UUO+Anti-IL-1β Ab: p < 0.001 for Col1a, p = 0.0048 for Fn1, p < 0.0001 for Col6, p < 0.0001 for Acta2). D COL6, α-SMA, and GAPDH immunoblotting in the whole kidney lysates of control and UUO mice treated with IL-1β antibody (10 mg/kg) (n = 3 per group). E SA-β-gal staining in control and UUO mice treated with IL-1β antibody (10 mg/kg) (n = 3 per group). Scale bar: upper panels: 20 μm; lower panels:50 μm. F IL-1β, IL6, P53, MCP1, and GAPDH immunoblotting in UUO mice neutralized with IL-1β antibody (n = 3 per group). G IL-1β, Cd86, Tnf-α, P53, Il6 and Mcp1 mRNA levels in the whole kidney lysates of control and UUO mice treated with IL-1β antibody (10 mg/kg) (number for control and UUO group is 5; number for IL-1β and UUO + IL-1β group is 7, control vs UUO: p < 0.0001 for il1b, p < 0.0001 for Cd86, p < 0.0001 for Tnf-α, p < 0.0001 for P53, p < 0.0001 for il6, p < 0.0001 for Mcp1; UUO vs UUO+Anti-IL-1β Ab: p = 0.0447 for il1b, p = 0.0404 for Cd86, p < 0.0001 for Tnf-α, p = 0.023 for P53, p = 0.0014 for il6, p = 0.007 for Mcp1,). UUO unilateral ureteric obstruction, WT wild type, Ctrl Control, Ab IL-1β neutralizing antibody. Data shown are means ± SEM. Statistical analysis by one-way ANOVA with Tukey’s post hoc test. *p < 0.05, **p < 0.01, ***p < 0.001 and ****p < 0.0001.
Fig. 8
Fig. 8. ACSS2 inhibitor suppressed H3K9cr-mediated IL-1β expression, cellular senescence, and M1 macrophage markers as well as alleviated kidney fibrosis in vivo.
A Treatment strategy of ACSS2 inhibitor for mice. B Protein level of H3K9cr, H3K9ac, and H3 and quantification of these immunoblots in whole kidney lysates of UUO mice treated with or without ACSS2 inhibitor (n = 3 per group, control vs. UUO: p = 0.0068, UUO vs. UUO + ACSS2 inhibitor: p = 0.0051). C Representative images of H&E (n = 6 per group, Scale bar: 100 μm), Sirus red (n = 3 per group, Scale bar: 100 μm), and IF staining α-SMA (green), COL6 (green) and DAPI (blue) in UUO mice treated with or without ACSS2 inhibitor (n = 3 per group, Scale bar: 20 μm). D Quantitative analysis of α-SMA and COL6 IF staining in UUO mice treated with or without ACSS2 inhibitor (n = 3 per group, control vs. UUO: p = 0.0014 for α-SMA, p = 0.0008 for COL6; UUO vs. UUO + ACSS2 inhibitor: p = 0.0254 for α-SMA, p = 0.0005 for COL6). E FN1, COL6, α-SMA and GAPDH immunoblotting in the whole kidney lysates of UUO mice treated with or without ACSS2 inhibitor (n = 3 per group). F mRNA levels of IL-1β in whole kidney lysates of UUO mice treated with or without ACSS2 inhibitor (the number for control and UUO group is 6, the number for ACSS2 inhibitor and UUO + ACSS2 inhibitor group is 4; control vs UUO: p = 0.0016, UUO vs UUO + ACSS2 inhibitor: p = 0.04494). G SA-β-gal staining of control, UUO fibrotic mice, and UUO mice treated with ACSS2 inhibitor (n = 3 per group). Scale bar: upper panels: 100 μm; lower panels:50 μm. H mRNA levels of Cd86, P53, Mcp1, Il6 and Tnf-α in whole kidney lysates of control, UUO fibrotic mice and UUO mice treated with ACSS2 inhibitor (number for control and UUO group is 6, number for ACSS2 inhibitor and UUO + ACSS2 inhibitor group is 4; control vs. UUO: p < 0.0001 for Cd86, p < 0.0001 for P53, p < 0.0001 for Mcp-1, p = 0.0005 for il6, p < 0.0001 for Tnf-α; UUO vs. UUO + ACSS2 inhibitor: p = 0.0136 for Cd86, p = 0.0004 for P53, p = 0.0043 for Mcp-1, p = 0.0056 for il6, p < 0.0001 for Tnf-α). Ctrl Control, UUO unilateral ureteric obstruction. Data shown are means ± SEM. Statistical analysis by one-way ANOVA with Tukey’s post hoc test. *p < 0.05, **p < 0.01, ***p < 0.001 and ****p < 0.0001.

References

    1. Eckardt KU, et al. Evolving importance of kidney disease: from subspecialty to global health burden. Lancet. 2013;382:158–169. doi: 10.1016/S0140-6736(13)60439-0. - DOI - PubMed
    1. Webster AC, Nagler EV, Morton RL, Masson P. Chronic kidney disease. Lancet. 2017;389:1238–1252. doi: 10.1016/S0140-6736(16)32064-5. - DOI - PubMed
    1. Huang R, Fu P, Ma L. Kidney fibrosis: from mechanisms to therapeutic medicines. Signal Transduct. Target Ther. 2023;8:129. doi: 10.1038/s41392-023-01379-7. - DOI - PMC - PubMed
    1. National Kidney F. KDOQI clinical practice guideline for diabetes and CKD: 2012 update. Am. J. Kidney Dis. 2012;60:850–886. doi: 10.1053/j.ajkd.2012.07.005. - DOI - PubMed
    1. Kouzarides T. Chromatin modifications and their function. Cell. 2007;128:693–705. doi: 10.1016/j.cell.2007.02.005. - DOI - PubMed