. 2024 Apr 23;43(4):114089.
doi: 10.1016/j.celrep.2024.114089. Epub 2024 Apr 13.

NKp44/HLA-DP-dependent regulation of CD8 effector T cells by NK cells

Affiliations

NKp44/HLA-DP-dependent regulation of CD8 effector T cells by NK cells

Benedetta Padoan et al. Cell Rep. .

Abstract

Although natural killer (NK) cells are recognized for their modulation of immune responses, the mechanisms by which human NK cells mediate immune regulation are unclear. Here, we report that expression of human leukocyte antigen (HLA)-DP, a ligand for the activating NK cell receptor NKp44, is significantly upregulated on CD8+ effector T cells, in particular in human cytomegalovirus (HCMV)+ individuals. HLA-DP+ CD8+ T cells expressing NKp44-binding HLA-DP antigens activate NKp44+ NK cells, while HLA-DP+ CD8+ T cells not expressing NKp44-binding HLA-DP antigens do not. In line with this, frequencies of HLA-DP+ CD8+ T cells are increased in individuals not encoding for NKp44-binding HLA-DP haplotypes, and contain hyper-expanded CD8+ T cell clones, compared to individuals expressing NKp44-binding HLA-DP molecules. These findings identify a molecular interaction facilitating the HLA-DP haplotype-specific editing of HLA-DP+ CD8+ T cell effector populations by NKp44+ NK cells and preventing the generation of hyper-expanded T cell clones, which have been suggested to have increased potential for autoimmunity.

Keywords: CD8 cells; CP: Immunology; HCMV; HLA-DP; NK cells; NKp44.


Conflict of interest statement

Declaration of interests The authors declare no competing interests.

Figures
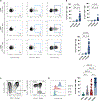
Figure 1.
Figure 1.. HLA-DP is expressed ex vivo on CD8+ T cells
(A) Representative flow cytometric plots showing the applied gating strategy used to identify HLA-II molecules (HLA-DQ, HLA-DR, HLA-DP) in viable CD3+, CD3+ CD4+, and CD3+ CD8+ T cells. (B). Median percentage (± interquartile range [IQR]) of HLA-DQ, HLA-DR, and HLA-DP on T cells (CD3+, CD3+ CD4+, and CD3+ CD8+ T cells). Shown are n = 24 samples, and each dot represents one biological replicate. Statistical significance was determined using the two-tailed Friedman test with post hoc Dunn’s correction. **p = 0.0016 and ****p < 0.0001. (C) (Left) Representative flow cytometric plot of CD45RA and CCR7 expression on CD8+ T cells used to define naive (CD45RA+ CCR7+) and memory T cells. (Right) The memory subset was further analyzed using KLRG1 and CD127 expression, defining MPEC (CD127+ KLRG1), DPEC (CD127+ KLRG1+), and EC/EEC (CD127 KLRG1−/+) CD8+ T cell populations. (D) (Left) Representative histogram and (right) median percentage (±IQR) of HLA-DP expression on gated naive, MPEC, DPEC, and EC/EEC CD8+ T cells. Shown are n = 24 samples, and each dot represents one biological replicate. Statistical significance was determined using the two-tailed Friedman test with post hoc Dunn’s correction. **p = 0.0071 and ****p < 0.0001.
Figure 2.
Figure 2.. HLA-DP mRNA is transcribed in CD8+ T cells
(A) Uniform manifold approximation and projection (UMAP) of merged scRNA-seq profiles of sorted CD8+ T cells. The different clusters are grouped in subsets based on manual annotation. Two subsets were too sparse for analysis and were excluded (12–13). n = 12.946 cells are plotted from n = 3 combined samples. (B) Cluster heatmap highlighting differentially expressed genes (DEGs) signatures for manually annotated subsets. (C) UMAP representation of HLA-II α-chain transcript average expression (HLA-DQA1, HLA-DRA, HLA-DPA1). (D) UMAP representation (left) and representative flow cytometric plot (right) of median percentage (±IQR) of CD57, CX3CR1, TIGIT, T-bet, and Eomes. Shown are n = 17 samples, and each dot represents one biological replicate. Statistical significance was determined using two-tailed Wilcoxon matched-pairs signed-rank test. ****p < 0.0001.
Figure 3.
Figure 3.. HLA-DP is upregulated in HCMV-seropositive individuals
(A) (Left) Representative flow cytometric plots showing the applied gating strategy; (right) median percentage (±IQR) of HLA-DP+ CD8+ T cells from HCMV-seronegative and -seropositive individuals. Shown are n = 19 different samples (HCMVneg = 7; HCMVpos = 12), and each dot represents one biological replicate. Statistical significance was determined using Mann-Whitney test. ***p = 0.0003. (B) Median percentage (±IQR) of HLA-DP+ CD8+ T cells. Shown are n = 6 different samples from three different time points. One sample from Pre TX was collected 1 week post-transplantation (TX). Statistical significance was determined using two-tailed Friedman test with post hoc Dunn’s correction. *p = 0.03. (C) Percentage of HLA-DP+ CD8+ T cells within gated naive, MPEC, DPEC, and EC/EEC CD8+ T cells from HCMV-seronegative and -seropositive individuals. Shown are n = 19 different samples (HCMVneg = 7; HCMVpos = 12), and each dot represents one biological replicate. Gray lines connect the same biological replicate. Statistical significance was determined using Mann-Whitney test. *p = 0.01 and **p = 0.002. See also Figure S3A. (D) (Left) Representative flow cytometric plot showing the applied gating strategy used to identify HLA-A*02:01-NLVPMVATV tetramer−/+ CD8+ T cells. Only individuals with >150 events within the NLV+ gate were considered for subsequent analysis. (Middle) Representative flow cytometric plot showing the applied gating strategy used to identify HLA-DP−/+ HLA-A*02:01–NLVPMVATV tetramer+ CD8+ T cells. (Right) Median percentage (±IQR) of HLA-DP and HLA-DP+ HLA-A*02:01-NLVPMVATV tetramer+ CD8+ T cells. Shown are results from n = 4 individuals, and each dot represents one biological replicate. Statistical significance was determined using Wilcoxon matched-pairs signed-rank test.
Figure 4.
Figure 4.. NKp44 binds HLA-DP+ CD8+ T cells in a haplotype-dependent process
(A) (Left) Representative flow cytometric plot showing NKp44-Fc construct binding to HLA-DP−/+ CD8+ T cells. (Right) Median percentage (±IQR) of NKp44-Fc binding to CD8+ HLA-DP−/+ T cells. Dots represent four donors in technical duplicates (n = 8). Statistical significance was determined using Wilcoxon matched-pairs signed-rank test. **p = 0.008. (B) (Left) Representative flow cytometric plots showing the applied gating strategy used to identify CD107a+ CD56bright NK cells after co-incubation with autologous CD8+ T cells from individuals with NKp44 non-binding (NB) and -binding (B) HLA-DP antigens. (Right) Median (±IQR) of normalized CD107a expression of CD56bright NK cells based on negative control NK cells only. NB dots represent three technical replicates from 2 individuals (n = 6). B dots represent three technical replicates from 3 individuals and one replicate from one individual (n = 10). Statistical significance was determined using Mann-Whitney test. *p = 0.02. (C) (Left) Representative flow cytometric plots showing the applied gating strategy to identify TNF+ CD56bright NK cells after co-incubation with autologous CD8+ T cells from individuals with NKp44 NB and -B HLA-DP antigens. (Right) Median (±IQR) of normalized TNF expression of CD56bright NK cells based on negative control NK cells only. NB dots represent three technical replicates from 2 individuals (n = 6). B dots represent three technical replicates from 3 individuals and one replicate from one individual (n = 10). Statistical significance was determined using Mann-Whitney test. *p = 0.03. (D) Plot shows fold change in degranulation (CD107a expression) of CD56bright NK cells after coincubation with autologous CD8+ T cells from individuals with NKp44-B HLA-DP antigens in the presence of an isotype or anti-NKp44 blocking antibody. Dots represent 4 donors (one of them twice) in technical duplicates (n = 10). Statistical significance was determined using Wilcoxon matched-pairs signed-rank test. **p = 0.006. (E) Plot shows the median of NK cell-mediated cytotoxicity after co-incubation with autologous CD8+ T cells from individuals with NKp44-B HLA-DP antigens. Data are presented as relative CD8+ T cell lysis calculated by dividing the lactate dehydrogenase (LDH) release of NK cell and CD8+ T cell cocultures with spontaneous LDH release of CD8+ T cells cultured alone without NK cells. Dots represent data from 4 donors in technical quadruplicates from the same experiment (n = 16). Statistical significance was determined using Wilcoxon matched-pairs signed-rank test. *p = 0.02.
Figure 5.
Figure 5.. CD8+ T cells hyper-expand in individuals with HLA-DP haplotypes not recognized by NKp44
(A) Median percentage (±IQR) of HLA-DP+ CD8+ T cells from individuals with two NKp44-NB (n = 4) compared to two NKp44-B (n = 6) HLA-DP haplotypes. Statistical significance was determined using Mann-Whitney test. **p = 0.0095. Each dot represents one biological replicate. (B) Heatmap displaying percentages of CD8+ HLA-DP+ T cells with hyper-expanded TCR Vβ chains from individuals with two NKp44 NB (n = 4) compared to two NKp44-B (n = 5) HLA-DP haplotypes. Threshold for hyper-expansion = 10%. Statistical significance was determined using Fisher’s exact test. *p = 0.0476 (n = 9). Each line divides one biological replicate. (C) Median (±IQR) of clone fraction percentage of the top 10 expanded clones from CD8+ naive, CD127+, and CD127 T cells of individuals with two NKp44 NB (n = 2) compared to two NKp44-B (n = 5) HLA-DP haplotypes. Statistical significance was determined using Mann-Whitney test. CD127+ *p = 0.0296; CD127 *p = 0.0421.

References

    1. Moretta A, Bottino C, Mingari MC, Biassoni R, and Moretta L (2002). What is a natural killer cell? Nat. Immunol. 3, 6–8. 10.1038/ni0102-6. - DOI - PubMed
    1. Vivier E, Tomasello E, Baratin M, Walzer T, and Ugolini S (2008). Functions of natural killer cells. Nat. Immunol. 9, 503–510. 10.1038/ni1582. - DOI - PubMed
    1. Jost S, and Altfeld M (2013). Control of Human Viral Infections by Natural Killer Cells. Annu. Rev. Immunol. 31, 163–194. 10.1146/annurev-immunol-032712-100001. - DOI - PubMed
    1. Waggoner SN, Cornberg M, Selin LK, and Welsh RM (2011). Natural killer cells act as rheostats modulating antiviral T cells. Nature 481, 394–398. 10.1038/nature10624. - DOI - PMC - PubMed
    1. Waggoner SN, Daniels KA, and Welsh RM (2014). Therapeutic Depletion of Natural Killer Cells Controls Persistent Infection. J. Virol. 88, 1953–1960. 10.1128/JVI.03002-13. - DOI - PMC - PubMed

Publication types

MeSH terms

Substances

LinkOut - more resources