. 2024 Jun;216(2):108092.
doi: 10.1016/j.jsb.2024.108092. Epub 2024 Apr 13.

An electrostatic cluster guides Aβ40 fibril formation in sporadic and Dutch-type cerebral amyloid angiopathy

Affiliations

An electrostatic cluster guides Aβ40 fibril formation in sporadic and Dutch-type cerebral amyloid angiopathy

Ziao Fu et al. J Struct Biol. 2024 Jun.

Abstract

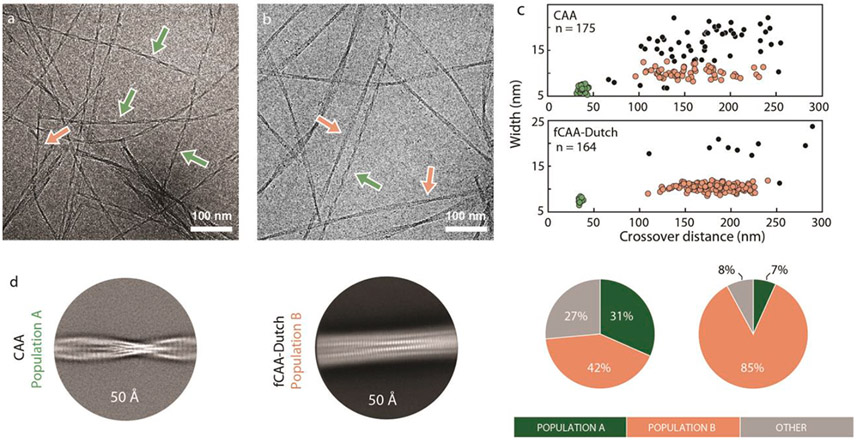
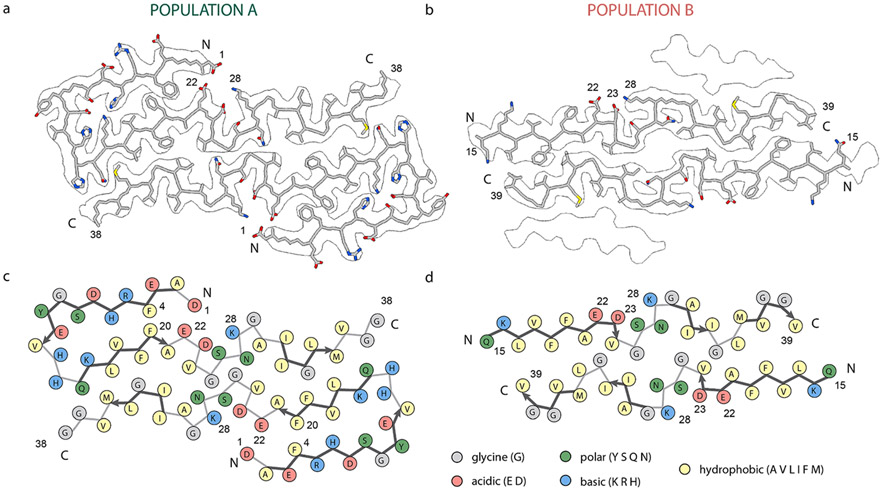
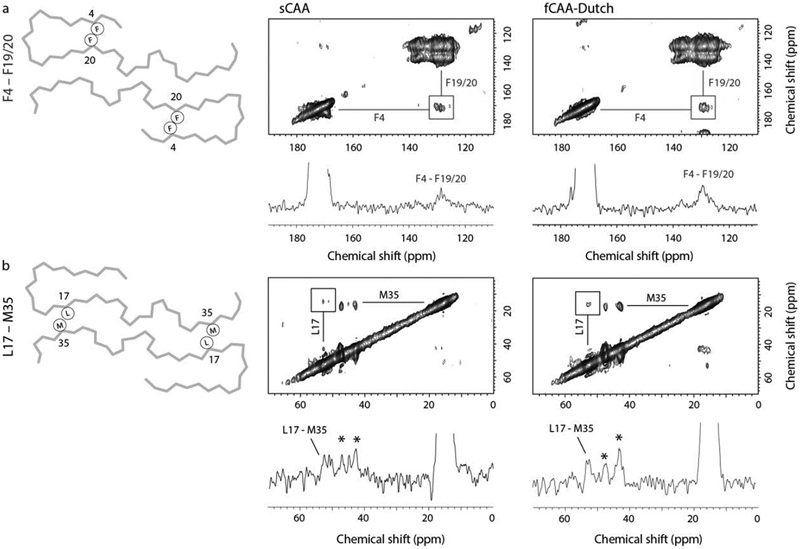
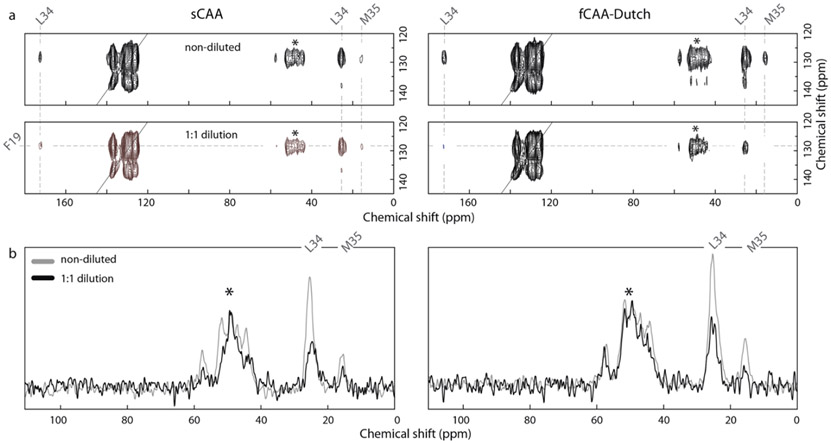
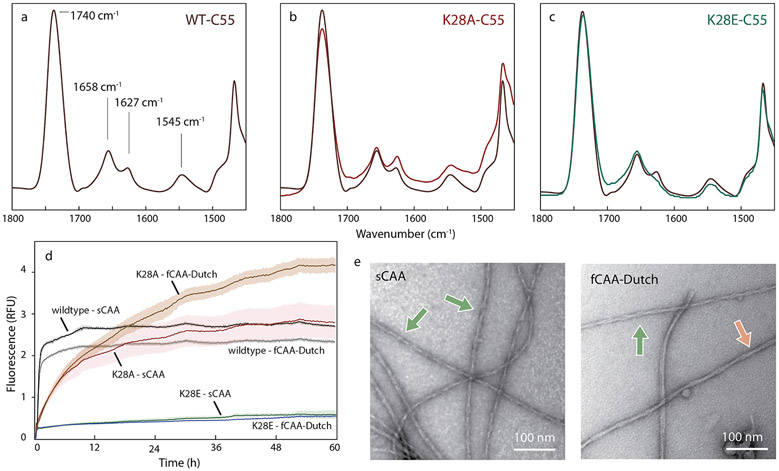
Cerebral amyloid angiopathy (CAA) is associated with the accumulation of fibrillar Aβ peptides upon and within the cerebral vasculature, which leads to loss of vascular integrity and contributes to disease progression in Alzheimer's disease (AD). We investigate the structure of human-derived Aβ40 fibrils obtained from patients diagnosed with sporadic or familial Dutch-type (E22Q) CAA. Using cryo-EM, two primary structures are identified containing elements that have not been observed in in vitro Aβ40 fibril structures. One population has an ordered N-terminal fold comprised of two β-strands stabilized by electrostatic interactions involving D1, E22, D23 and K28. This charged cluster is disrupted in the second population, which exhibits a disordered N-terminus and is favored in fibrils derived from the familial Dutch-type CAA patient. These results illustrate differences between human-derived CAA and AD fibrils, and how familial CAA mutations can guide fibril formation.

Keywords: Alzheimer's disease; Amyloid-β peptide; Cerebral amyloid angiopathy; Cryo-EM; Solid-state NMR; Vascular fibrils.


Conflict of interest statement

Declaration of competing interest The authors declare the following financial interests/personal relationships which may be considered as potential competing interests: William E. Van Nostrand, Steven O. Smith reports financial support was provided by National Institutes of Health. Co-author S.C. serves on the editoral board of the Journal of Structural Biology If there are other authors, they declare that they have no known competing financial interests or personal relationships that could have appeared to influence the work reported in this paper.

Figures

Fig. 1.
Fig. 1.
Two populations of Aβ fibrils in sporadic and familial Dutch vascular amyloid. Representative cryo-EM micrographs from Aβ fibrils derived from the (a) sCAA and (b) fCAA-Dutch patients. Arrows highlight examples of different fibril populations. (c) Morphology plots for each patient along with the distributions of each population within the cryo-EM micrographs. Each dot represents the average crossover-distance and width of a single fibril with colors corresponding to the arrows and different populations in panel (a). Two primary fibril clusters are observed: a highly twisted homogeneous population A (green), abundant in the sCAA case, and a more heterogeneous and less-twisted population B (red), predominant in the fCAA-Dutch case. We note that the second population primarily exhibits variability in crossover distance but not in width, suggesting that the number of peptides in each cross-β unit is maintained along the fibril but the conformation may vary. The highly twisted fibril populations in both cases resulted in cryo-EM volumes with similar backbone traces. (d) 2D class averages from helical reconstruction reflect the difference in fibril morphology found in samples derived from sCAA and fCAA patients. (left) The highly twisted fibrils abundant in the sample seeded from the sCAA patient (in green in panel c) – named population A – have an average crossover distance of ≈37 nm. (right) The major fibril morphology in the sample seeded from the fCAA patient (red in panel c) exhibit a greater and more variable crossover distance.
Fig. 2.
Fig. 2.
Ciyo-EM Aβ40 structures from vascular amyloid of CAA patients. (a) Structure of population A fibrils. Nearly the entire Aβ40 monomer fits within the 2.9 Å cryo-EM density with well-defined positions for uncharged side chains. Population A is composed of two protofilaments with an ordered N-terminal section and intermolecular hydrophobic interactions, with a β-strand from residues Q15 to A21. Reconstruction did not result in defined densities for the last two amino acids, V39 and V40. (b) Structure of population B fibrils within the outline of the cryo-EM density. Population B is composed of four layers. The 3.1 Å cryo-EM density identified a backbone fold with three β-strands composing each protofilament. The N-terminal region was not modeled due to a lack of resolvable density. (c) Schematic representation of population A with each residue colored according to its electrostatic property, as indicated in the legend. The two hydrophobic segments L17–A21 and A30–V36 interact in both structures but in an arrangement not found in many in vitro structures, suggesting a different mechanism of fibril formation. Multiple charged residue pairs are present in population A, both solvent-exposed and inside the fibril core. (d) Schematic representation of population B with each residue colored according to its electrostatic property as indicated in the legend. Similar to population A, hydrophobic segments L17–A21 and A30–V36 form intermolecular interactions. In this structure, charged residues do not form numerous interactions to stabilize the conformation.
Fig. 3.
Fig. 3.
Probing brain-derived Aβ40 fibrils for population A with solid-state NMR. Two-dimensional 13C DARR NMR measurements of fibrils derived from sCAA and fCAA-Dutch patients. The fibrils were produced via templated growth of brain amyloid using specifically 13C-labeled Aβ40 to probe inter-residue contacts modeled in the cryo-EM structures. (a) F4-F20 interaction. A scheme of the backbone trace of population A (left) highlighting the close intramolecular contact of F4 and F20. Region of the 2D DARR NMR spectrum (right) exhibiting cross peaks between 1-13C F4 and ring-13C-F20 (or F19). The 1D row extracted from the 2D spectrum passes through the diagonal resonance of 1-13C F4 and highlights the cross peak between 1-13C F4 and ring-13C-F20 (or F19). The 13C labeling scheme chosen for these measurements generally provides well-resolved resonances such that cross-peaks can be assigned to specific residue contacts. One exception is that the F19 and F20 13C labels overlap but are predicted to interact with either G33 or F4, respectively. The presence of the F4-F19/20 cross peak (square) is consistent with the close distance between F4 and F20 in the cryo-EM structure in both the sCAA and fCAA-Dutch patient samples. We also observe a cross peak between F19 and G33 (not shown), which is consistent with the population A structure. Note that the cross peak intensities in DARR NMR spectra are often not symmetric (see Ohashi and Takegoshi (2006)). (b) L17-M35 interaction. A scheme of the backbone trace of population A (left) highlights the close intermolecular contact of L17 and M35, while the 2D DARR NMR spectrum (right) exhibits cross peaks between 2-13C L17 and 5-13C M35. The 1D row extracted from the 2D spectrum passes through the diagonal resonance of 5-13C M35 and highlights the cross peak between 5-13C M35 and 2-13C L17. Cross peaks (asterisks) are also observed between 5-13C M35 and 2-13C G33, residues that are close together in the Aβ sequence. However, on the basis of the two structures presented here, these cross peaks may arise from the β-hairpins populating the outer densities in population B (see below). The population A structure indicates a register shift with respect to a previously published similar structure, leading to a flip of the C-terminal segment. This shift results in a close proximity between L17 and M35 consistent with the presence of observed cross-peaks in the DARR NMR spectra of the sCAA and fCAA-Dutch patient fibrils.
Fig. 4.
Fig. 4.
Probing brain-derived Aβ40 fibrils for population B with solid-state NMR. Two-dimensional 13C DARR NMR measurements of fibrils derived from sCAA and fCAA patients to probe the contact between F19 and L34. The population B fibril structure is distinct from most in vitro fibrils by the linear shape of the inner Aβ peptides. This structure results in close proximity of F19 and L34 at the intermolecular interface. (a) Representative 2D 13C DARR NMR spectra are shown for the sCAA and fCAA-Dutch patient samples after the third round of seeding (G3). (top) Region of the 2D NMR spectrum showing the diagonal resonance of ring-13C–Phe19 and crosspeaks to U-13C–Leu34 reflecting close Phe19-Leu34 packing in both sCAA and fCAA-Dutch fibrils. (bottom) 1:1 isotope dilution indicate a marked intensity decrease of the ring-13C–Phel9 – U-13C–Leu34 crosspeaks in both patient samples. (b) Row through the diagonal ring-13C–Phe19 resonance showing cross peaks to Leu34. In order to assess whether the contacts are intra- or inter-molecular a parallel experiment was undertaken with 13C-labeled Aβ peptide diluted 50% with unlabeled Aβ peptide. Both samples exhibit a reduction in cross peak intensity consistent with inter-molecular interactions. Asterisks indicate MAS rotational side-bands.
Fig. 5.
Fig. 5.
An electrostatic cluster mediates central interactions for both structures. Probing the D1-E22-D23-K28 cluster in C55 and brain-derived Aβ40 fibrils, (a–c) FTIR spectra of (a) wild-type C55, (b) K28A C55 and (c) K28E C55 reconstituted into DMPC:DMPG bilayers. The acyl chain C=0 vibration of the lipids is observed at ~ 1740 cm−1. The amide I region is between 1600 and 1700 cm−1 and the amide II region is between 1500–1560 cm−1. The band at ~1658 cm, corresponds to the α-helix, and the band at ~1627–1630 cm−1 corresponds to the N-terminal β-sheet. The K28A mutation increases the ~1630 cm−1 band relative to the 1658 cm−1 band, while the K28E mutation results in a decrease. (d) Templated growth upon G3 brain-derived fibrils was assessed by thioflavin T fluorescence using wild-type Aβ40, and the K28A and K28E mutants. For comparison, positive controls are shown (black and grey traces). The study was performed in triplicate and the results averaged, with noise representing standard deviation. The Aβ40 monomer containing the K28A mutation resulted in template growth for both brain-derived samples, but the initial fluorescence increase is slower than the positive control. The Aβ40 monomer containing the K28E mutation was not able to add to the brain-derived fibrils. (e) Representative negative stain TEM micrographs for the K28A Aβ40 mutant that successfully templated, as shown in (d), upon the sCAA (top) and fCAA-Dutch (bottom) patient samples. We observe fibrils in all cases, with helical characteristics similar to population A (green arrow) or population B (red arrow).
Fig. 6.
Fig. 6.
D1-E22-D23-K28 cluster in populations A and B. (a) Top view of the D1-E22-D23-K28 cluster in population A (left) and population B (right). In population A, charged residue pairs are brought into close proximity by the N-terminal fold, resulting in electrostatic interactions that stabilize and tether the N-terminus in position. Contrary to population A, the linear conformation of the inner layers in population B does not allow many electrostatic interactions. However, the D23–K28 salt bridge remains and is now able to be fully involved. (b) Ribbon view of population A highlights the out-of-plane displacement of a monomer in red up to 10 Å. (c) (left) Cartoon representation of population A with three individual monomers highlighting interactions between monomers (n), (n + 1), and (n + 2). Residues of interest are highlighted (colors represent different monomers). The N-terminus of monomer (n) (green) is displaced above the monomer plane and interacts with K28 two monomers above (n + 2). Similarly, D23 interacts with K28 on the monomer (n + 1). (right) In contrast, the same residues of the electrostatic cluster are interacting in an intermolecular fashion in population B, leading to the absence of stagger and inter-molecular stabilizing interactions.

Similar articles

Cited by

References

    1. Alvarez X, Miguel-Hidalgo J, Fernandez-Novoa L, Cacabelos R, 1997. Intrahippocampal injections of the beta-amyloid 1–28 fragment induces behavioral deficits in rats. Methods Find. Exp. Clin. Pharmacol 19, 471–479. - PubMed
    1. Arndt JW, Qian F, Smith BA, Quan C, Kilambi KP, Bush MW, Walz T, Pepinsky RB, Bussière T, Hamann S, Cameron TO, Weinreb PH, 2018. Structural and kinetic basis for the selectivity of aducanumab for aggregated forms of amyloid-β. Sci. Rep 8, 6412. 10.1038/s41598-018-24501-0. - DOI - PMC - PubMed
    1. Bakrania P, Hall G, Bouter Y, Bouter C, Beindorff N, Cowan R, Davies S, Price J, Mpamhanga C, Love E, Matthews D, Carr MD, Bayer TA, 2022. Discovery of a novel pseudo β-hairpin structure of N-truncated amyloid-β for use as a vaccine against Alzheimer’s disease. Mol. Psychiatry 27, 840–848. 10.1038/S41380-021-01385-7. - DOI - PubMed
    1. Bohrmann B, Baumann K, Benz J, Gerber F, Huber W, Knoflach F, Messer J, Oroszlan K, Rauchenberger R, Richter WF, Rothe C, Urban M, Bardroff M, Winter M, Nordstedt C, Loetscher H, 2012. Gantenerumab: a novel human anti-Aβ antibody demonstrates sustained cerebral amyloid-β binding and elicits cell-mediated removal of human amyloid-β. J. Alzheimer’s Disease 28, 49–69. 10.3233/JAD-2011-110977. - DOI - PubMed
    1. Brinkmalm G, Hong W, Wang Z, Liu W, O’Malley TT, Sun X, Frosch MP, Selkoe DJ, Portelius E, Zetterberg H, 2019. Identification of neurotoxic cross-linked amyloid β dimers in the Alzheimer’s brain. Brain 142, 1441–1457. - PMC - PubMed

MeSH terms

LinkOut - more resources