. 2024;14(4):387-392.
doi: 10.1038/s41558-024-01946-y. Epub 2024 Feb 27.

Flexible foraging behaviour increases predator vulnerability to climate change

Affiliations

Flexible foraging behaviour increases predator vulnerability to climate change

Benoit Gauzens et al. Nat Clim Chang. 2024.

Abstract

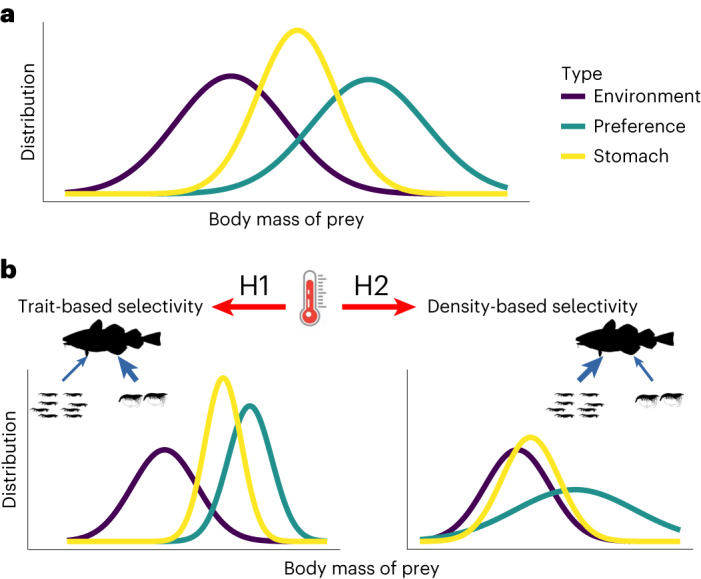
Higher temperatures are expected to reduce species coexistence by increasing energetic demands. However, flexible foraging behaviour could balance this effect by allowing predators to target specific prey species to maximize their energy intake, according to principles of optimal foraging theory. Here we test these assumptions using a large dataset comprising 2,487 stomach contents from six fish species with different feeding strategies, sampled across environments with varying prey availability over 12 years in Kiel Bay (Baltic Sea). Our results show that foraging shifts from trait- to density-dependent prey selectivity in warmer and more productive environments. This behavioural change leads to lower consumption efficiency at higher temperature as fish select more abundant but less energetically rewarding prey, thereby undermining species persistence and biodiversity. By integrating this behaviour into dynamic food web models, our study reveals that flexible foraging leads to lower species coexistence and biodiversity in communities under global warming.

Keywords: Biodiversity; Ecological networks; Food webs; Theoretical ecology.


Conflict of interest statement

Competing interestsThe authors declare no competing interests.

Figures

Fig. 1
Fig. 1. Conceptual representation of temperature impacts on the preference distribution.
a, The preference distribution of prey body masses (turquoise) is estimated from the environmental (distribution of prey body masses in the environment, purple) and realized (distribution of prey body masses in consumers’ stomachs, yellow) body mass distributions. It represents how different prey body masses are selected by the consumers. b, Based on our two hypotheses, temperature increase can lead to one of the following hypotheses. H1 (left): consumers preferentially select for larger species (trait-based selectivity), which can create an imbalance in the trophic fluxes (blue arrows); some species are preferentially selected even when their abundance is low, increasing their extinction risks and initiating large dynamical oscillations in species densities. H2 (right): temperature increase leads consumers to have their diet more driven by encounter rates (density-based selectivity), which creates a stronger control of species with high biomass in comparison with less abundant, smaller ones, favouring coexistence of resource species and thus community species richness.
Fig. 2
Fig. 2. Response of the median prey body mass of the preference distribution.
a,b, Effect of predator body mass (a) and temperature and resource availability (b). Points represent log-transformed data across all resource availability levels, and lines represent model predictions. Regression lines represent model predictions on the median of the preferred distribution when all other covariates are considered. The shaded areas show the 95% confidence interval on the predicted values. Low and high resource availability values correspond to the two modes of the bimodal distribution of resource availability values (presented in Supplementary Information IV).
Fig. 3
Fig. 3. Effect of resource availability on the effect size of temperature on the median body mass of the preference distribution.
The solid black line represents the effect size of the temperature effect calculated from the original model coefficients, and the grey area shows the associated uncertainty (95% confidence interval). The vertical dashed line represents the resource availability threshold above which the temperature effect becomes significant (effect of 0 outside of the 95% confidence interval).
Fig. 4
Fig. 4. Number of consumer species extinctions predicted by the model at different temperatures (out of an initial richness of 30 consumers).
Points represent the number of observed extinctions for each simulation. The blue line represents the model prediction on the average number of extinctions without the response of species’ foraging behaviour to local temperature and resource availability conditions considered, while the red line shows average predictions of extinctions when allowing for this flexibility. The shaded areas show the 95% confidence interval on the predicted values. Predictions were estimated using a GAM with a binomial link function.
Extended Data Fig. 1
Extended Data Fig. 1. Response of the standard deviation of the preference distribution.
Effect of resource availability on the effect size of the temperature effect on the standard deviation of body mass of the preference distribution. The solid black line represents the effect size calculated from the original model coefficients along the gradient of resource availability and the grey area associated uncertainty (95% confidence interval). The vertical dashed line represents the resource availability value above which temperature effect becomes significant (0 outside of the 95% confidence interval).

References

    1. Dell AI, Pawar S, Savage VM. Systematic variation in the temperature dependence of physiological and ecological traits. Proc. Natl Acad. Sci. USA. 2011;108:10591–10596. doi: 10.1073/pnas.1015178108. - DOI - PMC - PubMed
    1. Free CM, et al. Impacts of historical warming on marine fisheries production. Science. 2019;363:979–983. doi: 10.1126/science.aau1758. - DOI - PubMed
    1. Lenoir J, et al. Species better track climate warming in the oceans than on land. Nat. Ecol. Evol. 2020;4:1044–1059. doi: 10.1038/s41559-020-1198-2. - DOI - PubMed
    1. Brose U, et al. Predator traits determine food-web architecture across ecosystems. Nat. Ecol. Evol. 2019;3:919–927. doi: 10.1038/s41559-019-0899-x. - DOI - PubMed
    1. Petchey OL, Brose U, Rall BC. Predicting the effects of temperature on food web connectance. Philos. Trans. R. Soc. B. 2010;365:2081–2091. doi: 10.1098/rstb.2010.0011. - DOI - PMC - PubMed