[Preprint]. 2024 Apr 3:2024.04.02.587608.
doi: 10.1101/2024.04.02.587608.

IRF8-driven reprogramming of the immune microenvironment enhances anti-tumor adaptive immunity and reduces immunosuppression in murine glioblastoma

Affiliations

IRF8-driven reprogramming of the immune microenvironment enhances anti-tumor adaptive immunity and reduces immunosuppression in murine glioblastoma

Megan Montoya et al. bioRxiv. .

Update in

Abstract

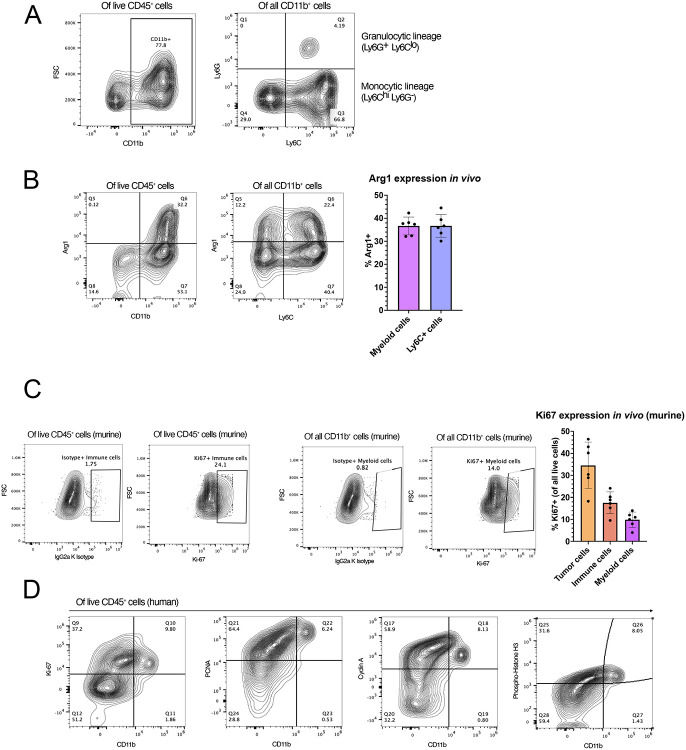
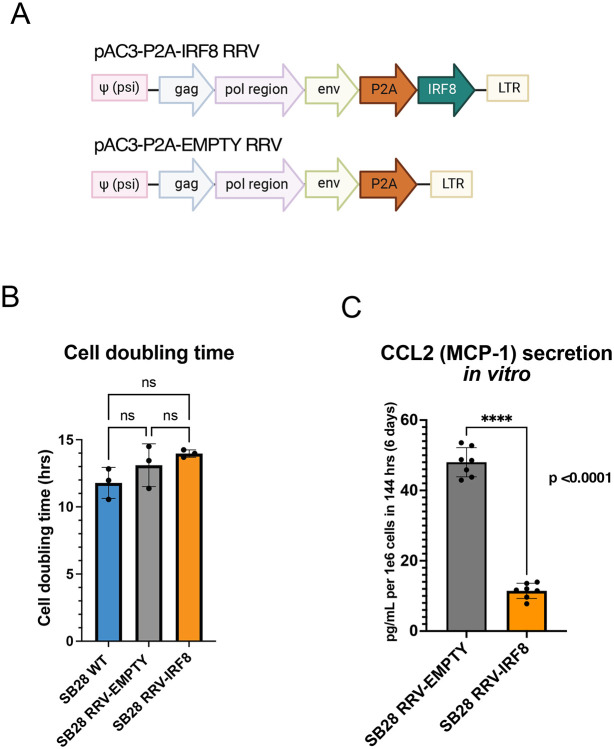
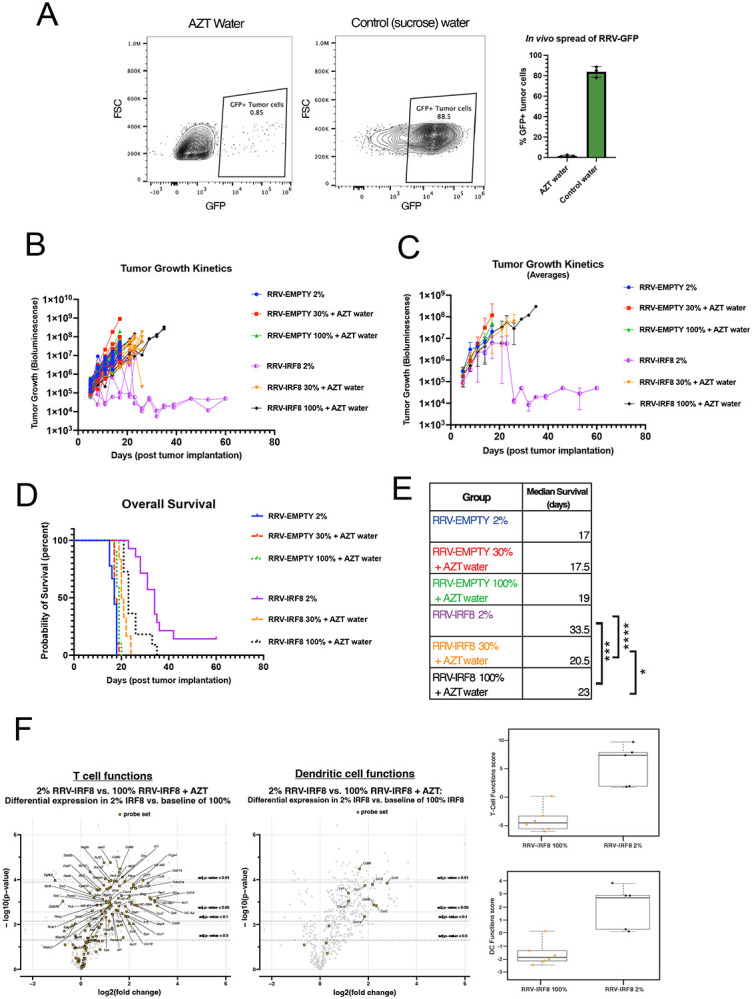
Background: Glioblastoma (GBM) has a highly immunosuppressive tumor immune microenvironment (TIME), largely mediated by myeloid-derived suppressor cells (MDSCs). Here, we utilized a retroviral replicating vector (RRV) to deliver Interferon Regulatory Factor 8 (IRF8), a master regulator of type 1 conventional dendritic cell (cDC1) development, in a syngeneic murine GBM model. We hypothesized that RRV-mediated delivery of IRF8 could "reprogram" intratumoral MDSCs into antigen-presenting cells (APCs) and thereby restore T-cell responses.

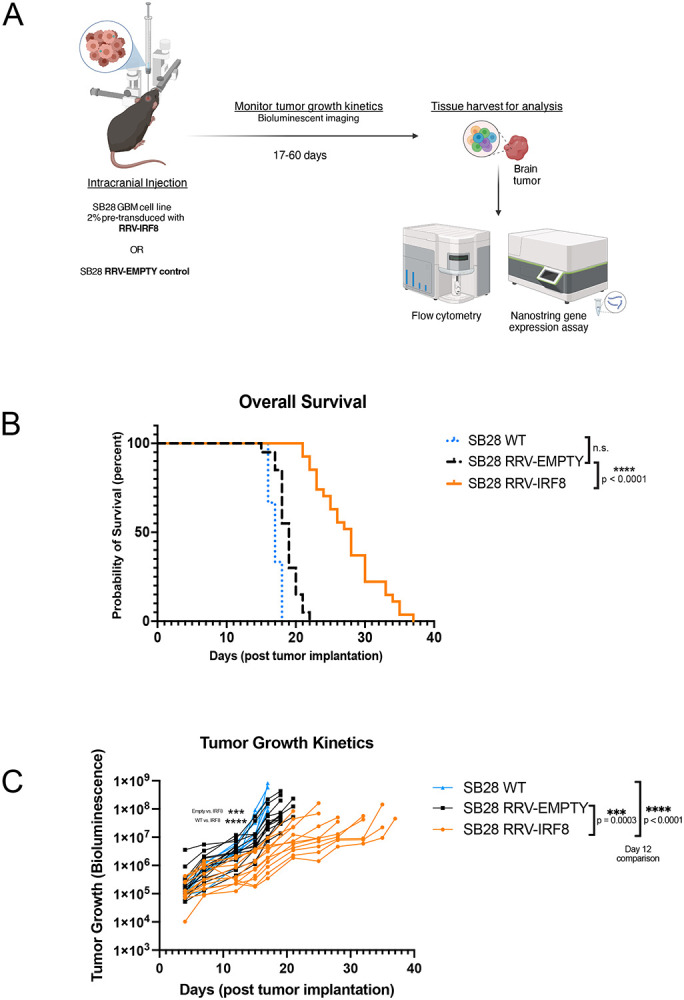
Methods: Effects of RRV-IRF8 on survival and tumor growth kinetics were examined in the SB28 murine GBM model. Immunophenotype was analyzed by flow cytometry and gene expression assays. We assayed functional immunosuppression and antigen presentation by ex vivo T-cell-myeloid co-culture.

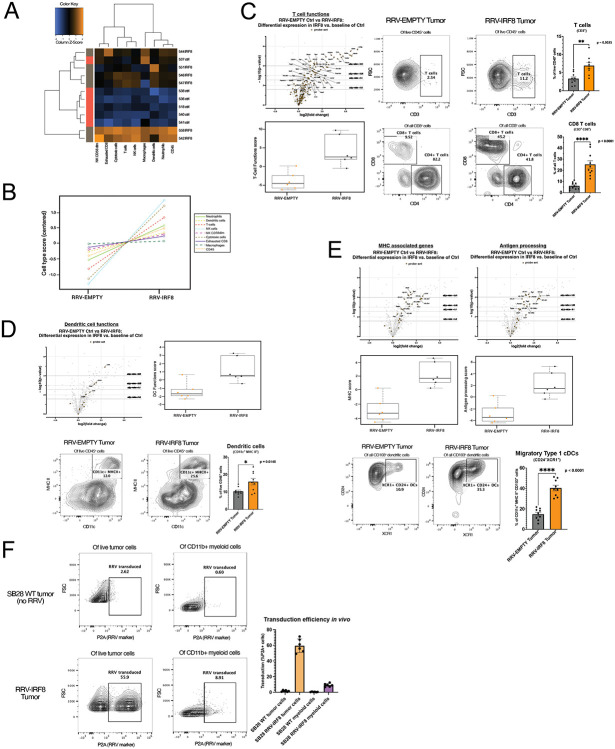
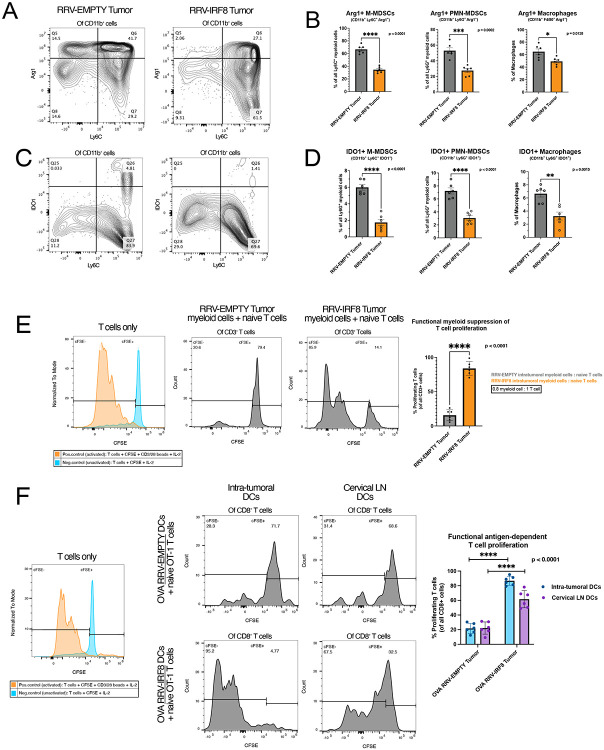
Results: Mice with RRV-IRF8 pre-transduced intracerebral tumors had significantly longer survival and slower tumor growth compared to controls. RRV-IRF8 treated tumors exhibited significant enrichment of cDC1s and CD8+ T-cells. Additionally, myeloid cells derived from RRV-IRF8 tumors showed decreased expression of the immunosuppressive markers Arg1 and IDO1 and demonstrated reduced suppression of naïve T-cell proliferation in ex vivo co-culture, compared to controls. Furthermore, DCs from RRV-IRF8 tumors showed increased antigen presentation compared to those from control tumors. In vivo treatment with azidothymidine (AZT), a viral replication inhibitor, showed that IRF8 transduction in both tumor and non-tumor cells is necessary for survival benefit, associated with a reprogrammed, cDC1- and CD8 T-cell-enriched TIME.

Conclusions: Our results indicate that reprogramming of glioma-infiltrating myeloid cells by in vivo expression of IRF8 may reduce immunosuppression and enhance antigen presentation, achieving improved tumor control.

Keywords: Glioblastoma; IRF8; Immunosuppression; MDSC; RRV-mediated gene therapy.


Conflict of interest statement

Conflict of Interest: NK is Chief Scientific Officer at 4D Molecular Therapeutics

Figures

Figure 1.
Figure 1.. Human and murine glioblastoma contain proliferating myeloid cell populations.
(A) Characterization of SB28 intra-tumoral myeloid cell populations. Tumors were harvested on day 18 post-tumor inoculation and analyzed by flow cytometry. The left panel shows live myeloid cells (CD45+ CD11b+); the right panel shows M-MDSCs (CD45+ CD11b+ Ly6Chi Ly6G−) and PMN-MDSCs (CD45+ CD11b+ Ly6G+ Ly6Clo). (B) Flow cytometric analysis of Arg1 expression in all myeloid cells (CD45+ CD11b+) and M-MDSCs (CD45+ CD11b+ Ly6C+). Bars represent mean of 6 biological replicates. (C) Expression of intracellular Ki67 expression in immune (CD45+) and myeloid (CD45+ CD11b+) cells. IgG2a K isotype was used to define gates. Bar graph (right) represents in vivo expression of Ki67 in tumor, immune, and myeloid cells. Bars show the mean of 6 biological replicate samples. (D) Expression of proliferation markers Ki67, PCNA, Cyclin A, and Phosphorylated Histone H3 in human primary GBM samples. Flow cytometry plots are pre-gated for live CD45+ immune cells.
Figure 2.
Figure 2.. RRV-IRF8 transduction of SB28 murine glioblastoma in vitro.
(A) Vector maps of RRV-IRF8 and RRV-EMPTY control. Both vectors contain the P2A self-cleaving peptide linking the transgene cassette to the viral genome. The P2A sequence is also used as a marker for vector transduction following intracellular detection and flow cytometric analysis. (B) Cell doubling times of SB28 WT (non-transduced), SB28 RRV-EMPTY, and SB28 RRV-IRF8. Cell were counted at 24- and 48-hours post-seeding. Doubling times were averaged among six technical replicate wells. (C) MCP-1/CCL-2 secretion in SB28 RRV-EMPTY versus SB28 RRV-IRF8 cells in vitro. Cells were cultured for 6 days before conditioned media collection; media was filtered to exclude debris and cell components.
Figure 3.
Figure 3.. Transduction with IRF8 in vivo suppresses the growth of intracerebral SB28 tumors.
(A) Schematic of in vivo studies. SB28 cells pre-transduced at 2% with either RRV-EMPTY or RRV-IRF8 were implanted intracerebrally. Tumor growth kinetics were monitored using bioluminescence (BLI) twice per week until study completion. Tissues were harvested and dissociated into single cells for analysis. (B) Kaplan-Meier curves showing survival; SB28 WT, SB28 RRV-EMPTY, and SB28 RRV-IRF8, (C) BLI imaging data corresponding with tumor growth kinetics. P-values assessed on day 12 post-tumor inoculation.
Figure 4.
Figure 4.. IRF8 transduction enhances the number of glioblastoma-infiltrating T-cells and type 1 conventional dendritic cells.
(A) Heatmap of differential expression of immune cell types between RRV-EMPTY (red bars, n=6 biological replicates), and RRV-IRF8 groups (grey bars, n=6 biological replicates). Total RNA was isolated from day 18 tumors. (B) Immune cell type changes between groups. Each cell type is associated with a set of genes; differential expression of gene sets is correlated with cell type abundance. Cell type profiling algorithm was previously described by Danaher et al (PMID: 28239471). (C) Left panel, volcano and box-and-whisker plots derived from the expression of T-cell genes (Supp. Table 2). In volcano plots, circular dots represent all differentially expressed genes; T-cell genes are represented with squares. Dashed horizontal lines correspond with adjusted p-value cut-offs. Right, representative flow plots of pan T-cells (CD45+ CD3+) and CD4 (CD45+ CD3+ CD4+) or CD8 (CD45+ CD3+ CD8+) T-cells. Bars represent the mean of 9 biological replicates. (D) Volcano and box-and-whisker plots derived from the expression of DC genes (Supp. Table 3). Representative flow plots of the pan-DC population (CD45+ CD11c+ MHC II+). Bars represent the mean of 9 biological replicates. (E) Volcano and box-and-whisker plots derived from the expression of MHC-associated or antigen-processing genes (Supp. Table 4). Bottom panels show flow cytometric analyses of CD103+ DCs derived from day 18 tumors. Live cells were gated on CD45+ CD11b− CD11c+ MHC II+ and CD103. The cDC1 populations were further refined by selecting CD24+ XCR1+, markers for terminally differentiated cDC1s capable of antigen cross-presentation. Bars represent the mean of 9 biological replicates. (F) Representative flow plots of in vivo RRV transduction using P2A as the marker for transduced cells. Top panels are SB28 WT (no RRV; non-transduced) tumors; the bottom panels are RRV-IRF8 tumors. Bars represent mean of 6 biological replicates.
Figure 5.
Figure 5.. Infection of non-tumor cells by RRV-IRF8 is necessary for survival benefit and slowed tumor growth.
(A) Mice were given 0.4mg/mL AZT + 2% sucrose water or 2% sucrose water-only control, with drug administration beginning two days prior to tumor inoculation and continuing until study endpoint (day 17 post-tumor inoculation). Representative flow plots of GFP+ tumor cells in mice receiving AZT or control water. Bars represent the mean of 3 biological replicates. (B) BLI tumor growth kinetics plots. 6 groups; n=10 mice per group. BLI performed twice weekly until study endpoint. BLI concluded at day 60 for 2 long-term surviving animals. (C) Average BLI tumor growth kinetics. (D) Kaplan-Meier curves showing survival. (E) Median survival for all groups and significance comparisons for RRV-IRF8 2% vs. 100%, RRV-IRF8 2% vs 30%, and RRV-IRF8 30% vs 100%. (F) Volcano plots and box-and-whisker plots show differential expression of T-cell function- and DC function-related genes between RRV-IRF8 100% + AZT (n=6 biological replicates) and RRV-IRF8 2% groups (n=5 biological replicates).
Figure 6.
Figure 6.. IRF8 transduction reduces immunosuppressive myeloid cells and enhances antigen presentation.
(A) Representative flow plots of Arg1 expression in Ly6C+ cells, all plots pre-gated on live CD45+ CD11b+ cells. (B) Bars show Arg1 expression in M-MDSCs, PMN-MDSCs, and Macrophages, representing the mean of 6 biological replicates. (C) Representative flow plots of IDO expression in Ly6C+ cells, all plots pre-gated on live CCD45+ CD11b+ cells. (D) Bars show IDO expression in M-MDSCs, PMN-MDSCs, and F4/80+ macrophages, representing the mean of 6 biological replicates. (E) Left, positive and negative controls for T-cell activation; gates set on negative control peak. T-cell/myeloid cell co-culture at 0.8 effector: 1 target ratio. Intratumoral myeloid cells were isolated from day 18 RRV-EMPTY or RRV-IRF8 tumors. Naïve T-cells were isolated from age-matched non-tumor bearing mice. Representative flow plots show T-cell proliferation (CFSE peaks) after 4 days of co-culture. Bars represent the mean of 6 biological replicates (n=3 technical replicates for each). (F) Left, positive and negative controls for T-cell activation. OT-1 T-cell/DC co-culture: CD11c+ DCs were isolated from SB28 OVA RRV-EMPTY or RRV-IRF8 tumors and cervical lymph nodes. Representative flow plots show T-cell proliferation (CFSE peaks) after 4 days of co-culture. Bars represent the mean of 6 biological replicates (n=2 technical replicates for each biological replicate).

References

    1. Mohammed S, Dinesan M, Ajayakumar T. Survival and quality of life analysis in glioblastoma multiforme with adjuvant chemoradiotherapy: a retrospective study. Rep Pract Oncol Radiother. 2022;27(6):1026–1036. doi: 10.5603/RPOR.a2022.0113 - DOI - PMC - PubMed
    1. Schaff LR, Mellinghoff IK. Glioblastoma and Other Primary Brain Malignancies in Adults: A Review. JAMA. 2023;329(7):574–587. doi: 10.1001/jama.2023.0023 - DOI - PMC - PubMed
    1. Chuntova P, Chow F, Watchmaker PB, et al. Unique challenges for glioblastoma immunotherapy-discussions across neuro-oncology and non-neuro-oncology experts in cancer immunology. Meeting Report from the 2019 SNO Immuno-Oncology Think Tank. Neuro-Oncol. 2021;23(3):356–375. doi: 10.1093/neuonc/noaa277 - DOI - PMC - PubMed
    1. Alban TJ, Alvarado AG, Sorensen MD, et al. Global immune fingerprinting in glioblastoma patient peripheral blood reveals immune-suppression signatures associated with prognosis. JCI Insight. 3(21):e122264. doi: 10.1172/jci.insight.122264 - DOI - PMC - PubMed
    1. Sharma P, Aaroe A, Liang J, Puduvalli VK. Tumor microenvironment in glioblastoma: Current and emerging concepts. Neuro-Oncol Adv. 2023;5(1):vdad009. doi: 10.1093/noajnl/vdad009 - DOI - PMC - PubMed

Publication types