[Preprint]. 2024 Apr 3:2024.04.02.587832.
doi: 10.1101/2024.04.02.587832.

Optineurin-facilitated axonal mitochondria delivery promotes neuroprotection and axon regeneration

Affiliations

Optineurin-facilitated axonal mitochondria delivery promotes neuroprotection and axon regeneration

Dong Liu et al. bioRxiv. .

Update in

Abstract

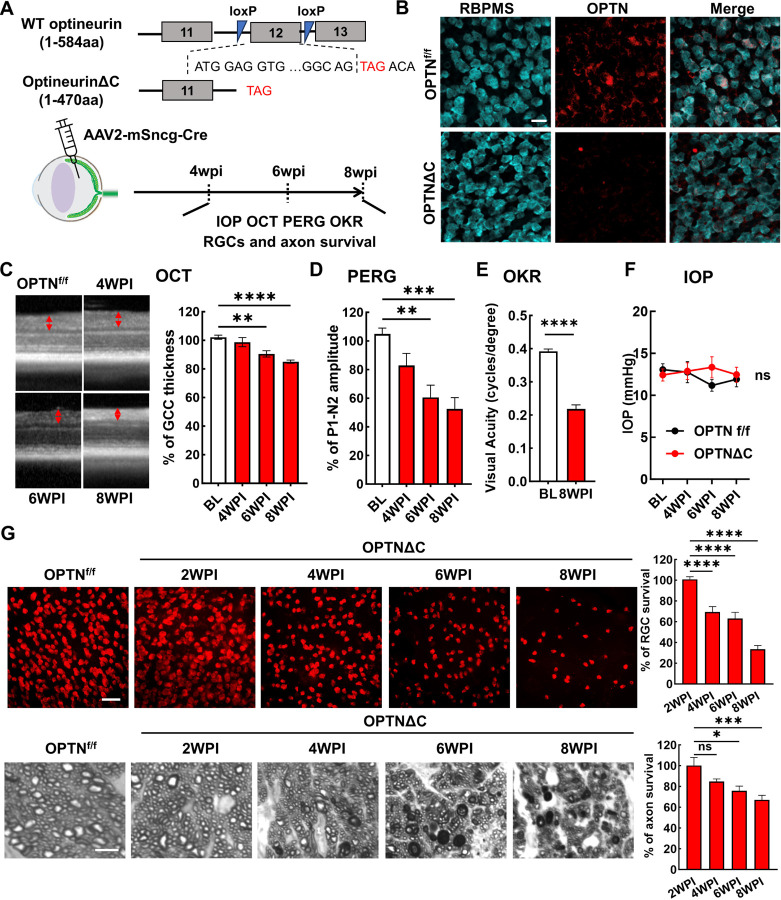
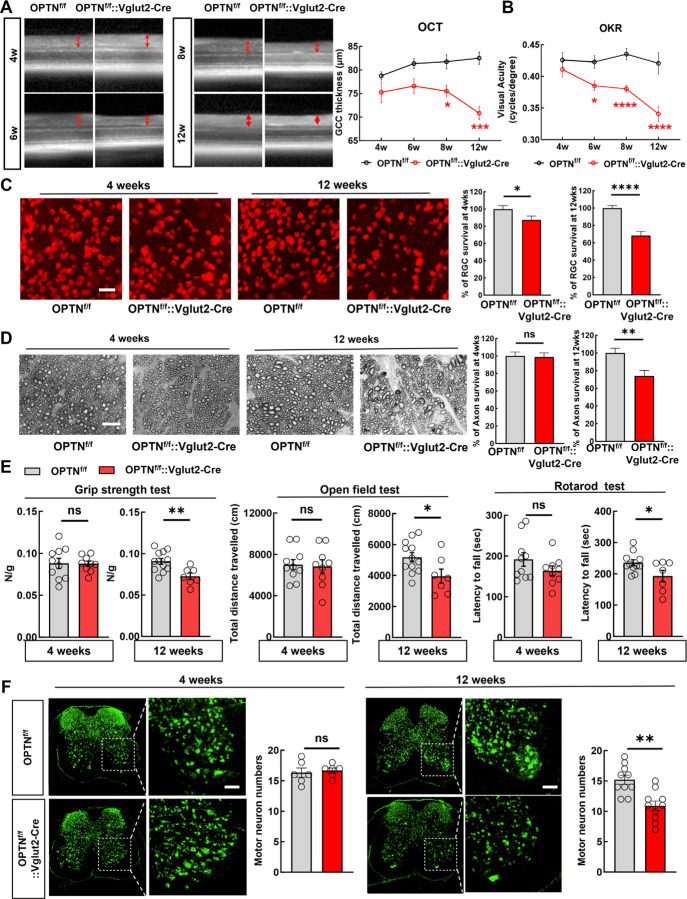
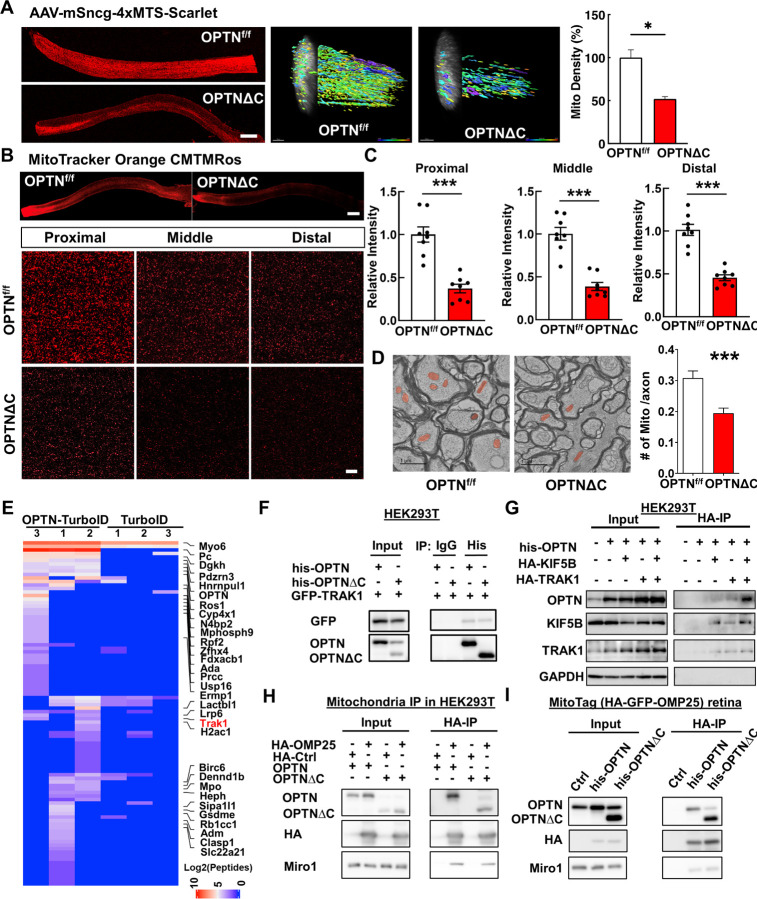
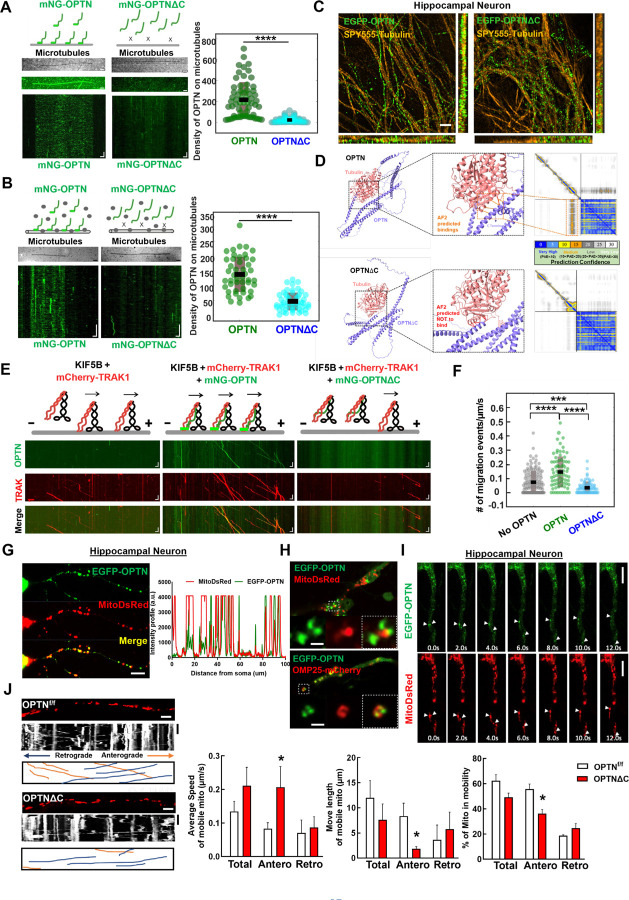
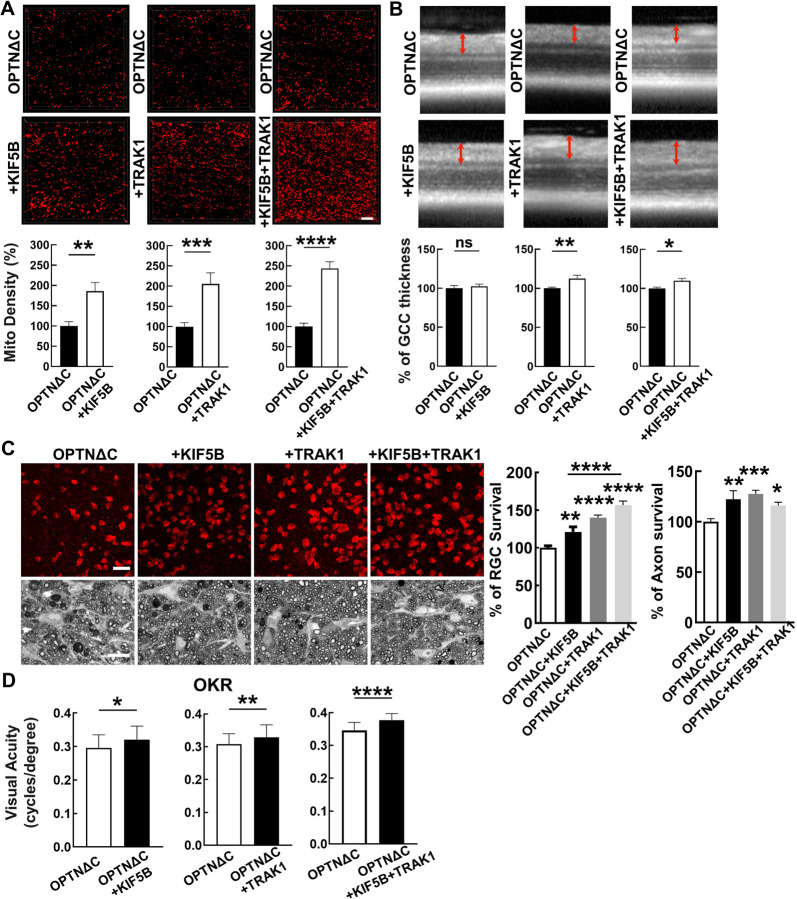
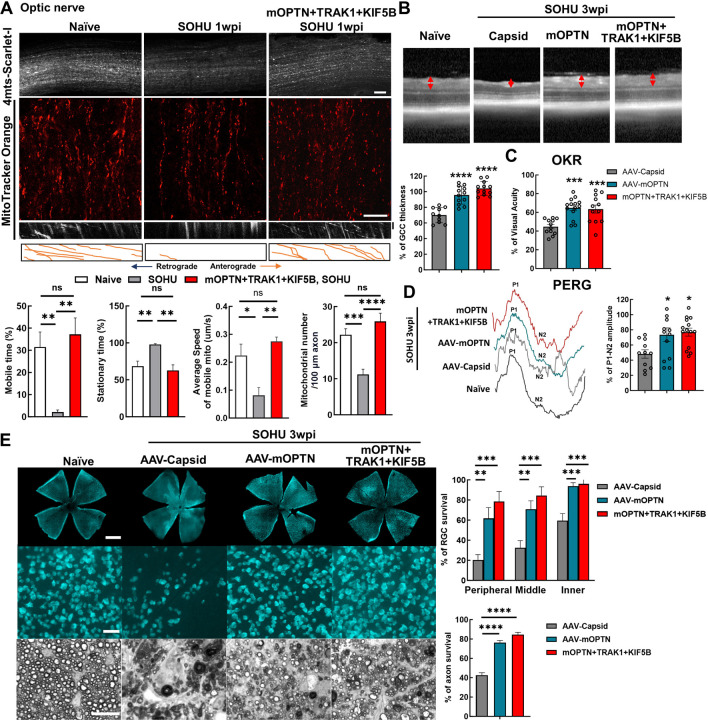
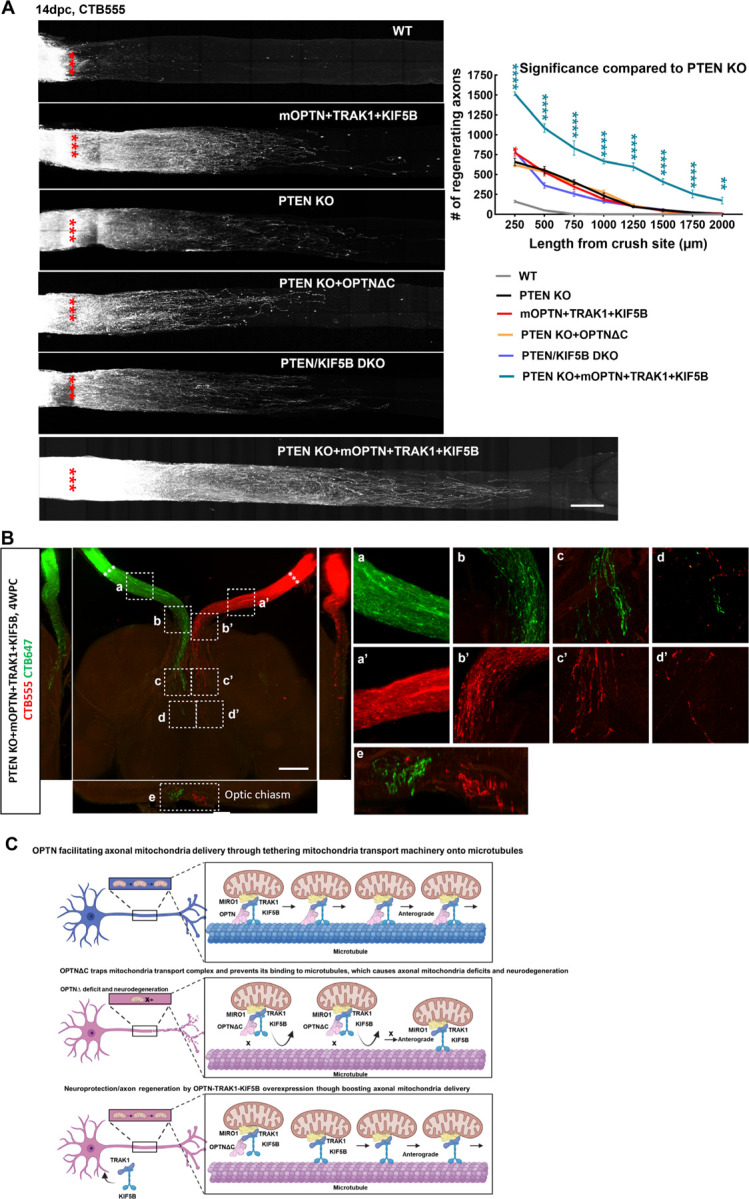
Optineurin (OPTN) mutations are linked to amyotrophic lateral sclerosis (ALS) and normal tension glaucoma (NTG), but a relevant animal model is lacking, and the molecular mechanisms underlying neurodegeneration are unknown. We found that OPTN C-terminus truncation (OPTN∆C) causes late-onset neurodegeneration of retinal ganglion cells (RGCs), optic nerve (ON), and spinal cord motor neurons, preceded by a striking decrease of axonal mitochondria. Surprisingly, we discover that OPTN directly interacts with both microtubules and the mitochondrial transport complex TRAK1/KIF5B, stabilizing them for proper anterograde axonal mitochondrial transport, in a C-terminus dependent manner. Encouragingly, overexpressing OPTN/TRAK1/KIF5B reverses not only OPTN truncation-induced, but also ocular hypertension-induced neurodegeneration, and promotes striking ON regeneration. Therefore, in addition to generating new animal models for NTG and ALS, our results establish OPTN as a novel facilitator of the microtubule-dependent mitochondrial transport necessary for adequate axonal mitochondria delivery, and its loss as the likely molecular mechanism of neurodegeneration.


Conflict of interest statement

Competing interests A provisional patent application (application number 63530216) has been filed by Stanford Office of Technology Licensing for novel neural repair strategies identified in this manuscript. The authors have declared that no conflict of interest exists.

Figures

Figure 1.
Figure 1.. RGC-specific OPTN C-terminus truncation leads to progressive RGC and ON degeneration.
A, Exon 12 of the endogenous OPTN gene is flanked by loxP sites in the OPTNf/f mouse line; excision by Cre produces a C-terminus truncated OPTN protein (OPTNΔC). AAV2-mSncg-Cre was intravitreally injected to truncate OPTN specifically in RGCs. In vivo measurements of OCT, PERG, OKR, and IOP and histological quantification of surviving RGC somata and axons were performed at 4–8 weeks post injection (4-8wpi). B, Representative images of retinal wholemounts labeled with RGC marker RBPMS and C-terminus OPTN antibodies. Scale bar, 20 μm. C, Representative in vivo OCT images of mouse retinas at baseline before AAV-Cre injection, and at 4-8wpi. GCC: ganglion cell complex, including RNFL, GCL and IPL layers; indicated as double end arrows. Quantification is represented as percentage of GCC thickness in the OPTNΔC eyes compared to the contralateral control (CL) eyes. n = 10–12 mice. D, Quantification of P1-N2 amplitude of PERG at different time points, represented as a percentage of OPTNΔC eyes compared to the CL eyes. n = 7–14 mice. E, Visual acuity of OPTNΔC eyes and CL eyes measured by OKR at 8wpi. n = 7 mice. F, IOP of OPTNΔC eyes and CL eyes. n = 11 mice. G, Upper panel, representative confocal images of retinal wholemounts showing surviving RBPMS-positive RGCs at different time points, Scale bar, 50 µm. Lower panel, light microscope images of semi-thin transverse sections of ON with PPD staining at different time points. Scale bar, 5 µm. Quantification of surviving RGC somata in peripheral retinas and surviving axons in ONs, represented as percentage of OPTNΔC eyes compared to the CL eyes. n = 5–12 mice. All the quantification data are presented as means ± s.e.m, *: p<0.05, **: p<0.01, ***: p<0.001, ****: p<0.0001, ns: no significance. C, D, G with one-way ANOVA with Dunnett’s multiple comparisons test; E with paired Student’s t-test; F with two-way ANOVA.
Figure 2.
Figure 2.. Vglut2-Cre mediated OPTNΔC causes RGC and spinal cord motor neuron degeneration and ALS-like locomotor deficits.
A, Left, representative in vivo OCT images of retinas from 4-week-old (4w) to 12w OPTNf/f naïve mice and OPTNf/f::Vglut2-Cre mice. Right, quantification of GCC thickness in OPTNf/f naïve and OPTNf/f::Vglut2-Cre mouse eyes. n = 2–7 mice. B, Visual acuity measured by OKR in 4w and 12w OPTNf/f naïve and OPTNf/f::Vglut2-Cre mouse eyes. n = 3–8 mice. Data are presented as means ± s.e.m, *: p<0.05, ***: p<0.001, ****: p<0.0001, Two-way ANOVA with Sidak’s multiple comparisons test. C, Left, representative confocal images of retina wholemounts showing surviving RBPMS-positive (red) RGCs at 4w and 12w. Scale bars, 20 μm; Right, quantification of surviving RGC somata, represented as percentage of OPTNf/f::Vglut2-Cre eyes compared with OPTNf/f eyes. D, Left, light microscopic images of semi-thin transverse sections of ONs with PPD staining at 4w and 12w. Scale bars, 10 μm. Right, quantification of surviving axons in ONs at 4w and 12w, represented as percentage of OPTNf/f::Vglut2-Cre eyes compared with OPTNf/f eyes. n = 8–15 mice. E, Behavioral tests of locomotion, including four-paw grip strength, distance traveled in open field test, and latency to fall in rotarod test, were performed in 4- (male = 4, female =5) and 12-weeks old (male = 6, female=1) OPTNf/f:: Vglut2-Cre mice and compared to same-age naïve OPTNf/f mice (4 weeks male = 6, female = 4; 12 weeks male = 7 or 6, female = 5). F, Immunofluorescent labeling of neurons with NeuN (green) in lumbar segments 1–3 spinal cord sections of the OPTNf/f ::Vglut2-Cre mice and same-age naïve OPTNf/f mice. The motor neurons in the ventral horns were quantified as NeuN+ and larger than 500 μm2. Scale bars, 100 μm. Quantification of motor neuron survival at 4- or 12-weeks-old are shown to the right. n = 5–12 mice. All the quantification data are presented as means ± s.e.m, *: p<0.05, **: p<0.01, ****: p<0.0001, ns: no significance, C-F with unpaired t-test.
Figure 3.
Figure 3.. Dramatic decrease of axonal mitochondria in OPTN∆C-ONs precedes neurodegeneration; OPTN directly interacts with the TRAK1-KIF5B-mitochondria transport complex.
A, Left, representative images of ON longitudinal sections 2 weeks after intravitreal injection of AAV-4xMTS-Scarlet or AAV-Cre + AAV-4xMTS-Scarlet in OPTNf/f mice. Scale bar, 200 μm. Middle, 3-dimensional (3D) reconstruction of axon mitochondria in ONs showing mitochondrial density. Mitochondrial sphericity is shown in the color bar. Right, quantification of mitochondrial density, represented as a percentage of OPTNΔC eyes compared to the CL eyes. n = 5 mice. B, Representative images of ON wholemount labeled by MitoTracker Orange CMTMRos 2 weeks after intravitreal injection of AAV-Cre. Scale bar, 200 μm. Higher magnification images of ON segments with labeled mitochondria are shown at the bottom. C, Quantification of mitochondrial density of proximal, middle and distal ON wholemounts, represented as a percentage of OPTNΔC eyes compared to the CL eyes. n = 5 mice. D, Representative TEM images of ON cross-sections (10,000 x) 2 weeks after intravitreal injection of AAV-Cre. Mitochondria are labeled in pseudo color red. Quantification of the mitochondria numbers per axon in ONs. n = 4 mice. All the quantification data are presented as means ± s.e.m, *: p<0.05, ***: p<0.001, paired Student’s t-test. E, Heatmap of enriched OPTN-interacting proteins in RGCs identified by in vivo TurboID and compared by OPTN-TurboID vs TurboID alone. F, Co-IP analysis of HEK293T cells with corresponding overexpression. α-his antibodies were used to IP OPTN and corresponding antibodies for recognizing individual proteins. G, Co-IP analysis of HEK293T cells with corresponding overexpression. α-HA magnetic beads were used for IP KIF5B or TRAK1 and corresponding antibodies of individual proteins for recognition. H, Co-IP analysis of HEK293T cells with corresponding overexpression. α-HA magnetic beads were used for IP HA-GFP-OMP25-labeled mitochondria and corresponding antibodies of individual proteins for recognition. I, Co-IP analysis of MitoTag mouse retinas with corresponding overexpression. α-HA magnetic beads were used for IP HA-GFP-OMP25-labeled mitochondria and corresponding antibodies of individual proteins for recognition.
Figure 4.
Figure 4.. OPTN tethers KIF5B-TRAK1 complex to microtubules in a C-terminus dependent manner for adequate axonal mitochondria delivery.
A, In vitro reconstitution assay: OPTN on immobilized microtubules. Left (top to bottom): Schematic representing interaction of OPTN/OPTNΔC with microtubules, IRM image of microtubules, maximum intensity projection, and kymograph of 20 nM mNG-OPTN or 0.1 µM mNG-OPTNΔC. Horizontal scale bar = 2.1 μm, vertical scale bar, 4 seconds. Right, quantification of density of OPTN/OPTNΔC on microtubules. n = 3 experiments. ****: p <0.0001, t-test. B, Lysates of mNG-OPTN or mNG-OPTNΔC overexpressing cells on immobilized microtubules. Left (top to bottom): Schematic representing interaction of cell lysates expressing OPTN/OPTNΔC with microtubules, IRM image of microtubules, and kymograph of mNG-OPTN or mNG-OPTNΔC. Horizontal scale bar, 2.0 μm, Vertical scale bar, 10 seconds. n = 3 experiments. Right, quantification of density of OPTN/OPTNΔC on microtubules. n = 3 experiments, ****: p <0.0001, t-test. C, SIM super-resolution images of cultured mouse E15 hippocampus neuron transfected with EGFP-OPTN or EGFP-OPTN∆C, and stained for microtubules with SPY555-tubulin. Scale bars, 2 μm. D, The AlphaFold2 predicated interaction between OPTN or OPTN∆C and Tubulin alpha-1A. The prediction confidence is visualized as heatmap of Predicted Aligned Error (PAE) plots. The x-axis and y-axis of the plot represent the sequence of amino acids in the two proteins. Each dot is color-coded in PAE in the grid, corresponding to the pair of amino acids in both proteins. E, In vitro reconstitution motility assay of immobilized microtubules. (top to bottom) Schematic representation of KIF5B-TRAK1 transportation complex with or without OPTN or OPTNΔC on microtubules, kymograph of mNG-OPTN or mNG-OPTNΔC and mCherry-TRAK1 walking to plus end of microtubules in the presence of unlabeled KIF5B. Horizontal scale bar, 2 μm; vertical scale bar, 10 seconds. F, Frequency of migration events (/μm/s) of complexes of KIF5B-TRAK1 (n = 133), KIF5B-TRAK1-OPTN (n = 73), KIF5B-TRAK1-OPTNΔC (n = 71), n = 3 experiments. ****: p < 10-7, ***: p =0.0002, t-test. G, Representative confocal images of cultured hippocampal neuron axons co-transfected with meGFP-OPTN with MitoDsRed to show the colocalization of OPTN and mitochondria in axons. The intensity profile analysis is shown in the right panel. Scale bar, 20 μm. H, Representative confocal images of cultured hippocampal neuron axons co-transfected with meGFP-OPTN with MitoDsRed or OMP25-mCherry. Higher magnification images of mitochondria are shown in the right lower panels. Scale bar, 5 μm. I, Time-lapse images of cultured hippocampal neuron axons co-transfected with meGFP-OPTN with MitoDsRed. White arrow heads indicate the colocalized meGFP-OPTN and mitochondria that are moving together in axons. Scale bar, 20 μm. J, Mitochondrial movement (anterograde movement: orange, retrograde movement: blue) in OPTNf/f or OPTNΔC hippocampal neuron axons transfected with MitoDsRed. The first frame (time = 0s) of live imaging series is shown with the kymograph. Quantifications of average speed of mobile mitochondria, move length of mobile mitochondria and percentage of mitochondria in mobility are shown to the right. n = 12–15 mitochondria from 3 axons per group. Horizontal scale bar, 10 μm, Vertical sale bar, 1 minute. Quantification data are presented as means ± s.e.m, *: p<0.05 with t-test.
Figure 5.
Figure 5.. Overexpression of KIF5B and/or TRAK1 rescues the axonal mitochondria deficit and neurodegeneration induced by OPTNΔC.
A, Representative images of MitoTracker-labeled ON longitudinal sections. Scale bar, 10 μm. Quantification of Mito Density, represented as a percentage of treated OPTNΔC eyes compared to the CL non-treated OPTNΔC eyes 2 weeks after intravitreal injection of AAV-Cre. n = 4–5 mice. Data are presented as means ± s.e.m, **: p<0.01, ***: p<0.001, ****: p<0.0001, paired Student’s t-test. B, Representative in vivo OCT images of mouse retinas at 8wpi. Quantification is represented as percentage of GCC thickness in the treated OPTNΔC eyes compared to the CL non-treated OPTNΔC eyes. n = 7–10 mice. Data are presented as means ± s.e.m, ns, no significance; *: p<0.05, **: p<0.01, paired Student’s t-test. C, Upper panel, representative confocal images of retinal wholemounts showing surviving RBPMS-positive RGCs at 8wpi. Scale bar, 20 µm. Lower panel, light microscope images of semi-thin transverse sections of ON with PPD staining at 8wpi. Scale bar, 10 µm. Quantification of surviving RGC somata in peripheral retinas and surviving axons in ONs, represented as percentage of treated OPTNΔC eyes compared to the CL non-treated OPTNΔC eyes. n = 8–12 mice. Data are presented as means ± s.e.m, *: p<0.05, **: p<0.01, ***: p<0.001, ****: p<0.0001, one-way ANOVA with Tukey’s multiple comparisons test. D, Visual acuity of treated and CL non-treated OPTNΔC eyes measured by OKR at 8wpi. n = 8–16 mice. Data are presented as means ± s.e.m, *: p<0.05, **: p<0.01, ****: p<0.0001, paired t-test.
Figure 6.
Figure 6.. Ocular hypertension decreases ON mitochondrial transportation; OPTN/TRAK1/KIF5B reverses glaucomatous ON mitochondrial deficits and neurodegeneration in SOHU glaucoma model.
A, (top to bottom) Representative confocal images of ON wholemounts from naïve mice, SOHU mice at 1wpi and SOHU mice at 1wpi with mOPTN+TRAK1+KIF5B overexpression and AAV-4MTS-Scarlet labeling, Scale bars, 50 μm; representative ON wholemount images of the three groups with MitoTracker Orange labeling, Scale bars, 20 μm; kymograph and traces of MitoTracker labelled mitochondria movement along ON axons in the three groups. Vertical scale bar, 1 minute; quantification of each mitochondria’s time in motion and time stationary, average speed of each mobile mitochondrion and total mitochondria number in the axon. n = 17–30 mitochondria from 3 axons per group. Data are presented as means ± s.e.m, *: p<0.05, **: p<0.01, ***: p<0.001, ****: p<0.0001, ns, no significance, with Student’s t-test. B, Representative in vivo OCT images of SOHU mouse retinas at 3wpi. Quantification is represented as percentage of GCC thickness of glaucomatous eyes compared to the contralateral control eyes. n = 10–12 mice. C, Visual acuity measured by OKR at 3wpi, represented as percentage of glaucomatous eyes compared to the contralateral control eyes. n = 12–14 mice. D, Left: representative waveforms of PERG of SOHU mice at 3wpi. Right: quantification of P1-N2 amplitude of PERG at 3wpi, represented as percentage of glaucomatous eyes compared to the contralateral control eyes. n = 11–15 mice. E, Left, (top to bottom) representative confocal images of retina wholemounts showing surviving RBPMS-positive (cyan) RGCs at 3wpi. Scale bars, 50 μm; light microscopic images of semi-thin transverse sections of ON with PPD staining at 3wpi. Scale bars, 10 μm. Right, Quantification of surviving RGC somata and axons at 3wpi, represented as percentage of glaucomatous eyes compared with the sham contralateral control eyes. n = 10 mice. (B-E) All the data are presented as means ± s.e.m, *: p<0.05, **: p<0.01, ***: p<0.001, ****: p<0.0001, one-way ANOWA with Turkey’s multiple comparison tests, compared to AAV-Capsid treated control group.
Figure 7.
Figure 7.. The OPTN/KIF5B/TRAK1 complex promotes striking ON regeneration after ONC.
A, Left, confocal images of ON wholemounts after optical clearance showing maximum intensity projection of regenerating axons labeled with CTB-Alexa 555 at 14dpc. Scale bar, 250 μm. ***: crush site. Right, quantification of regenerating axons at different distances distal to the lesion site. n = 4–9. Data are presented as means ± s.e.m, *: p<0.05, **: p<0.01, ****: p<0.0001, two-way ANOVA with Dunnett’s multiple comparisons test, compared to PTEN KO group. B, Light-sheet fluorescent images (bottom view, sagittal view and coronal view) of regenerating axons in ONs, optic chiasm, and optic tract in PTEN KO mice with mOPTN+TRAK1+KIF5B overexpression at 4 weeks post ONC (4wpc). Regenerating axons were labeled with CTB-Alexa 555 and CTB-Alexa 647 in both eyes separately. Higher magnification images of framed regions (a-e, a’-e’) are shown to the right. Scale bar, 500μm. C, Models of OPTN physiological role in axonal mitochondria transport, dysfunctional OPTN∆C in jeopardizing axonal mitochondria distribution and inducing neurodegeneration, and neuroprotection and axon regeneration of OPTN-TRAK1-KIF5B by increasing axonal mitochondria delivery.

References

    1. Coleman M.P. & Perry V.H. Axon pathology in neurological disease: a neglected therapeutic target. Trends Neurosci 25, 532–537 (2002). - PubMed
    1. Raff M.C., Whitmore A.V. & Finn J.T. Axonal self-destruction and neurodegeneration. Science 296, 868–871 (2002). - PubMed
    1. Fischer L.R., et al. Amyotrophic lateral sclerosis is a distal axonopathy: evidence in mice and man. Exp Neurol 185, 232–240 (2004). - PubMed
    1. Nickells R.W., Howell G.R., Soto I. & John S.W. Under pressure: cellular and molecular responses during glaucoma, a common neurodegeneration with axonopathy. Annu Rev Neurosci 35, 153–179 (2012). - PubMed
    1. Anderson D.R., Drance S.M., Schulzer M. & Collaborative Normal-Tension Glaucoma Study, G. Natural history of normal-tension glaucoma. Ophthalmology 108, 247–253 (2001). - PubMed

Publication types