[Preprint]. 2024 May 2:2024.04.02.587596.
doi: 10.1101/2024.04.02.587596.

Airway injury induces alveolar epithelial and mesenchymal responses mediated by macrophages

Affiliations

Airway injury induces alveolar epithelial and mesenchymal responses mediated by macrophages

Irene G Wong et al. bioRxiv. .

Abstract

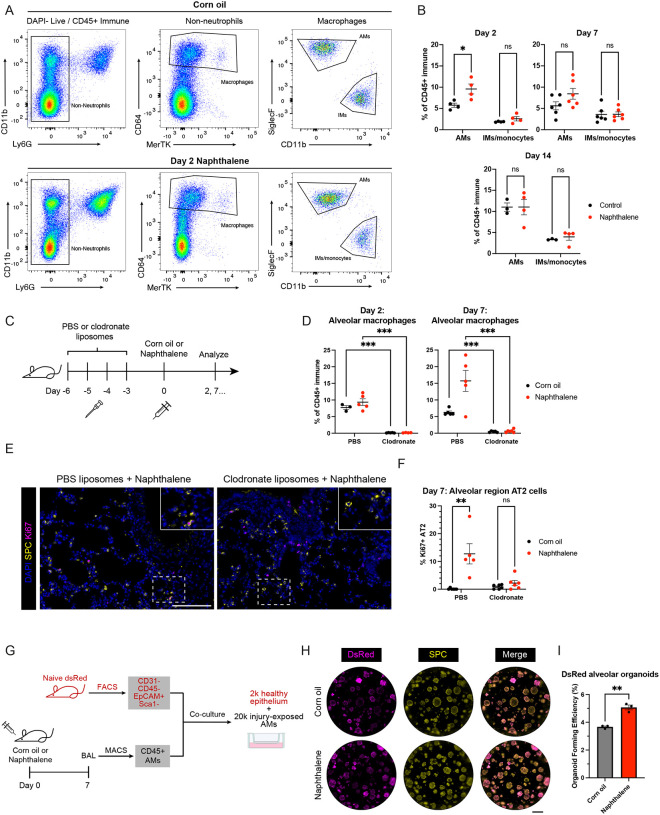
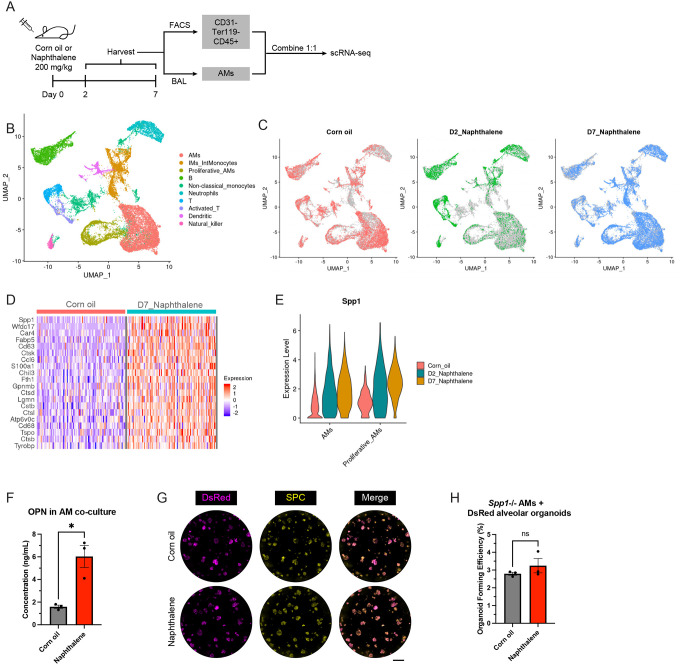
Acute injury in the airways or the lung activates local progenitors and stimulates changes in cell-cell interactions to restore homeostasis, but it is not appreciated how more distant niches are impacted. We utilized mouse models of airway-specific epithelial injury to examine secondary tissue-wide alveolar, immune, and mesenchymal responses. Single-cell transcriptomics and in vivo validation revealed transient, tissue-wide proliferation of alveolar type 2 (AT2) progenitor cells after club cell-specific ablation. The AT2 cell proliferative response was reliant on alveolar macrophages (AMs) via upregulation of Spp1 which encodes the secreted factor Osteopontin. A previously uncharacterized mesenchymal population we termed Mesenchymal Airway/Adventitial Niche Cell 2 (MANC2) also exhibited dynamic changes in abundance and a pro-fibrotic transcriptional signature after club cell ablation in an AM-dependent manner. Overall, these results demonstrate that acute airway damage can trigger distal lung responses including altered cell-cell interactions that may contribute to potential vulnerabilities for further dysregulation and disease.


Conflict of interest statement

Competing Interests C.F.K. had a sponsored research agreement with Celgene/BMS Corporation during part of the period of these studies, yet the work in that agreement did not overlap with this study. C.F.K. and A.L.M. are founders of Cellforma. I.G.W. and all other authors declare no competing interests.

Figures

Figure 1:
Figure 1:. Transient proliferation of AT2 cells after naphthalene airway injury.
A. Schematic of isolating lung epithelial cells from corn oil control mice or naphthalene-treated mice for scRNA-seq. B. IF of corn oil control or naphthalene-treated mouse lungs. Blue = DAPI, Yellow = SPC, Magenta = Acetylated tubulin, White = CCSP. Scale bar = 100 μm. C. Merged UMAP plot of epithelial cells from (A). N = 3 mice per condition. Corn oil N = 10247 cells; Day 2 naphthalene N = 6886 cells; Day 7 Naphthalene N = 16857 cells. Abbreviations: Diff Club = Differentiating Club. D. Split of the UMAP plot from (C) based on condition. E. Proliferation score of merged lung epithelium scRNA-seq as shown in Figure 1B. F. Subset of alveolar epithelial cells from (C). G. Cluster fractions of (F). Boxes highly Proliferative AT2 cells. H. IF images of corn oil control mice and naphthalene-treated mice sacrificed at indicated timepoints. Blue = DAPI, Yellow = SPC, Magenta = Ki67, White = CCSP. AW = airway. Scale bar = 100 μm. I. Quantification of proliferative AT2 cells (Ki67+/SPC+) normalized to total AT2 cells at the indicated timepoints after naphthalene injury. Analysis was confined to fields that included an airway or terminal bronchiole. Data are represented as mean ± SEM. Corn oil N = 11 mice, Day 2 N = 4 mice, Day 7 N = 7 mice, Day 10 N = 6 mice. Day 14 N = 3 mice. Student’s T-test: * = p < 0.05; *** = p < 0.001. **** = p < 0.0001. Absence of asterisk = no significance compared to control. J. Quantification of proliferative AT2 cells (Ki67+/SPC+) normalized to total AT2 cells at the indicated timepoints after naphthalene injury. Analysis was confined to fields of alveolar space. Data are represented as mean ± SEM. Corn oil N = 9 mice, Day 2 N = 4 mice, Day 7 N = 7 mice, Day 10 N = 6 mice. Day 14 N = 3 mice. Student’s T-test: * = p < 0.05; *** = p < 0.001. **** = p < 0.0001. Absence of asterisk = no significance compared to control. See also Figure S1, Supplementary Tables 1–4.
Figure 2:
Figure 2:. Transient proliferation of AT2 cells after genetic club cell ablation.
A. Schematic of induction and injury of CCSP-CreER+/−; Rosa26-LSL-YFP/iDTR mice. PBS or DTA were administered via intratracheal injection. B. IF images of mouse lungs at the indicated timepoints after genetic club cell ablation. Blue = DAPI, Yellow = SPC, Magenta = CCSP, Green = YFP. Scale bar = 100 μm. C. Quantification of CCSP+ club cell loss in airways of CCSP-CreER+/−; Rosa26-LSL-YFP/iDTR mice after no intratracheal administration, PBS, or DTA administration at the indicated timepoints. Data are represented as mean ± SEM. N = 3–4 mice per condition, per timepoint. Student’s T-test: *** = p < 0.001; ns = no significance. D. IF images of PBS control mice and DTA-treated mice sacrificed at day 7 after injury. Blue = DAPI, Yellow = SPC, Magenta = Ki67, White = CCSP. AW = airway. Scale bar = 100 μm. E. Quantification of proliferative AT2 cells (Ki67+/SPC+) normalized to total AT2 cells at the indicated timepoints after genetic club cell injury. Analysis was confined to fields of alveolar space. Data are represented as mean ± SEM. N = 3–5 mice per condition, per timepoint. Student’s T-test: * = p < 0.05; ** = p < 0.01; ns = no significance. F. Schematic of isolating alveolar-enriched Sca1− lung epithelial cells from corn oil control or naphthalene-treated mice. G. IF of alveolar organoid co-cultures grown from Sca1− lung epithelium as diagrammed in (A). Blue = DAPI, Yellow = SPC, Magenta = RAGE. Scale bar = 1 mm. H. Quantification of organoid forming efficiency of Sca1− alveolar organoids shown in (B). Data are represented as mean ± SEM. N = 5 mice per condition, per timepoint. Student’s T-test: ns = no significance. See also Figure S2.
Figure 3:
Figure 3:. Alveolar macrophages mediate AT2 cell proliferation after airway injury.
A. Flow cytometry strategy used to quantify macrophages from corn oil control or naphthalene-injured animals. CD11b+/Ly6G+ neutrophils were excluded from the CD45+ immune parental population before measuring the abundance of CD64+ total macrophages and delineating SiglecF+/CD11b− alveolar macrophages (AMs) from SiglecF−/CD11b+ interstitial macrophages (IMs). Monocytes may also appear in injury states within the SiglecF−/CD11b+ population, hence the additional annotation for naphthalene-treated animals. B. Flow cytometry quantification of AMs and IMs/monocytes at the indicated timepoints after control or injury. Data are represented as mean ± SEM. N = 3–6 mice per condition, per timepoint. Student’s T-test: * = p < 0.05; ns = no significance. C. Schematic of liposome administration in mice prior to control or naphthalene injury. PBS control or clodronate liposome was administered daily via intratracheal injection. D. Flow cytometry quantification of SiglecF+/CD11b− AMs in liposome pre-treated animals with and without naphthalene injury, following the same gating strategy as show in (A). Data are represented as mean ± SEM. N = 3–6 mice per condition, per timepoint. Student’s T-test: ** = p < 0.01; *** = p < 0.001. E. IF of mice that received liposome pre-treatment prior to control or naphthalene injury, sacrificed at day 7 post-injury. Blue = DAPI, Yellow = SPC, Magenta = Ki67. Scale bar = 100 μm. F. Quantification of proliferative AT2 cells (Ki67+/SPC+) normalized to total AT2 cells at day 7 (D7) after liposome pre-treatment and naphthalene injury. Analysis was confined to fields of alveolar space, as indicated. Data are represented as mean ± SEM. N = 5–6 mice per condition. Student’s T-test: ** = p < 0.01; ns = no significance. G. Schematic of isolating AMs from BAL fluid using CD45−positive selection with MACS. These AMs were combined with Sca1− alveolar-enriched epithelium from naïve DsRed animals. H. IF of AM and alveolar epithelial organoid co-cultures. AMs were harvested from corn oil- or naphthalene-treated mice as shown in (H). Magenta = DsRed, Yellow = SPC. Scale bar = 1 mm. I. Quantification of organoid forming efficiency of alveolar organoids shown in (I). Data are represented as mean ± SEM. N = 3 mice per condition. Student’s T-test: ** = p < 0.001. See also Figure S3.
Figure 4:
Figure 4:. Alveolar macrophages upregulate Spp1 during airway repair.
A. Schematic of isolating AMs (via BAL) and remaining CD45+ immune cells from mice treated with corn oil control or naphthalene for scRNA-seq. B. Merged UMAP plot of immune cells from (D). N = 3 mice per condition. Corn oil N = 7640 cells; Day 2 naphthalene N = 4102 cells; Day 7 Naphthalene N = 11888 cells. C. Split of the UMAP plot from (B) based on condition. D. Top 20 DEGs upregulated by AMs at day 7 after naphthalene injury, some of which are potential signaling molecules. E. Expression of Spp1 in scRNA-seq data. F. Concentration of Osteopontin (OPN) in media of AM and alveolar organoid co-cultures from Figure 3H–J. Media was harvested at day 3 of co-culture prior to the first media change. Data are represented as mean ± SEM. Student’s T-test: * = p < 0.05. G. IF of Spp1−/− AM and alveolar epithelial organoid co-cultures. AMs were harvested from corn oil- or naphthalene-treated Spp1−/− mice, following a similar isolation strategy shown in Fig. 3G. Magenta = DsRed, Yellow = SPC. Scale bar = 1 mm. H. Quantification of organoid forming efficiency of alveolar organoids shown in (H). Data are represented as mean ± SEM. N = 3 mice per condition. Student’s T-test: ns = not significant. See also Figure S4 and Supplementary Table S5.
Figure 5:
Figure 5:. MANC2 lung mesenchyme responses to airway injury are dependent on alveolar macrophages.
A. Merged UMAP plot of mesenchymal cells isolated from corn oil control and day 2 and 7 naphthalene-treated mice. FACS strategy to isolate mesenchyme is shown in Fig. S1B. Abbreviations: alvFibroblast = Alveolar Fibrobolast, MANC1 = Mesenchymal alveolar niche cell 1, MANC2 = Mesenchymal alveolar/airway niche cell 2, aSMC = Airway smooth muscle cell, vSMC = Vascular smooth muscle cell. N = 3 mice per condition. Corn oil N = 11589 cells; Day 2 naphthalene N = 6551 cells; Day 7 Naphthalene N = 14639 cells. B. Split of the UMAP plot from (A) based on condition. C. Cluster fractions of (A). Boxes highlight MANC2 cells. D. Pdgfra expression in the merged mesenchyme from control and naphthalene-treated animals. E. Subset and reclustering of MANC1 and MANC2 cells from (A). F. Scoring of the MANC2 signature across the MANC subset, using the top 50 markers of MANC2 cells that distinguish them from the other cell clusters in (E). G. Gene expression of MANC1 markers in the MANC subset from (E). H. Gene expression of MANC2 markers in the MANC subset from (E). I. IF of Aqp1+ MANC2 cells in lineage-labelled PdgfraCreERT2+/−;R26-tdTomato/+ mice that were uninjured (corn oil) or treated with naphthalene. Blue = DAPI, Yellow = Aqp1; Magenta = Pdgfra Tomato lineage label. Scale bar = 50 μm. J. Flow cytometry strategy used to examine Sca1−/CD34+ MANC2 cells. K. Flow cytometry quantification using the gating strategy shown in (J) of Sca1−/CD34+ MANC2 cells after naphthalene injury. Animals were sacrificed at the indicated timepoints. Corn oil controls were normalized to 1 (dotted line), and Sca1−/CD34+ mesenchyme abundance in injured animals was normalized to the respective controls at each timepoint. Data are represented as mean ± SEM. Student’s T-test: * = p < 0.05; ns = no significance. L. Flow cytometry quantification using the gating strategy shown in (J) of Sca1−/CD34+ MANC2 lung mesenchymal cells in mice pre-treated with PBS control or clodronate liposomes, followed by corn oil control or naphthalene injury. Mice were sacrificed at day 7 after the naphthalene injury. PBS liposome-corn oil controls were normalized to 1 (dotted line), and Sca1−/CD34+ mesenchyme abundance across the remaining conditions were normalized to the PBS liposome-corn oil control. Data are represented as mean ± SEM. Student’s T-test: ** = p < 0.01; ns = no significance. See also Figure S5 and Supplementary Table S7.

References

    1. Butler J.P., Loring S.H., Patz S., Tsuda A., Yablonskiy D.A., and Mentzer S.J. (2012). Evidence for adult lung growth in humans. N. Engl. J. Med. 367, 244–247. - PMC - PubMed
    1. Mentzer S.J. (2018). The puzzling mechanism of compensatory lung growth. Stem Cell Investig 5, 8. - PMC - PubMed
    1. Sun F., and Poss K.D. (2023). Inter-organ communication during tissue regeneration. Development 150. 10.1242/dev.202166. - DOI - PMC - PubMed
    1. Rodgers J.T., King K.Y., Brett J.O., Cromie M.J., Charville G.W., Maguire K.K., Brunson C., Mastey N., Liu L., Tsai C.-R., et al. (2014). mTORC1 controls the adaptive transition of quiescent stem cells from G0 to G(Alert). Nature 510, 393–396. - PMC - PubMed
    1. Johnson K., Bateman J., DiTommaso T., Wong A.Y., and Whited J.L. (2018). Systemic cell cycle activation is induced following complex tissue injury in axolotl. Dev. Biol. 433, 461–472. - PMC - PubMed

Publication types