[Preprint]. 2024 Apr 2:2023.06.10.544439.
doi: 10.1101/2023.06.10.544439.

Mag-Net: Rapid enrichment of membrane-bound particles enables high coverage quantitative analysis of the plasma proteome

Affiliations

Mag-Net: Rapid enrichment of membrane-bound particles enables high coverage quantitative analysis of the plasma proteome

Christine C Wu et al. bioRxiv. .

Abstract

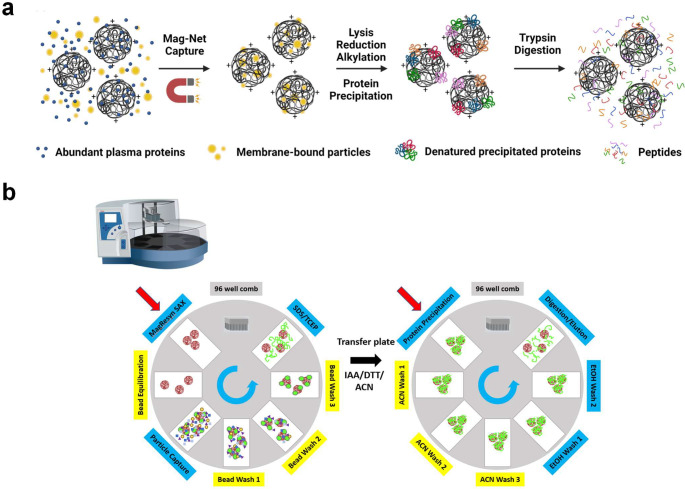
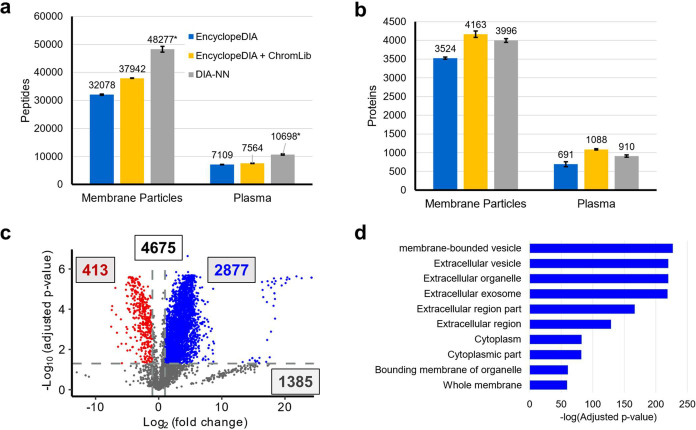
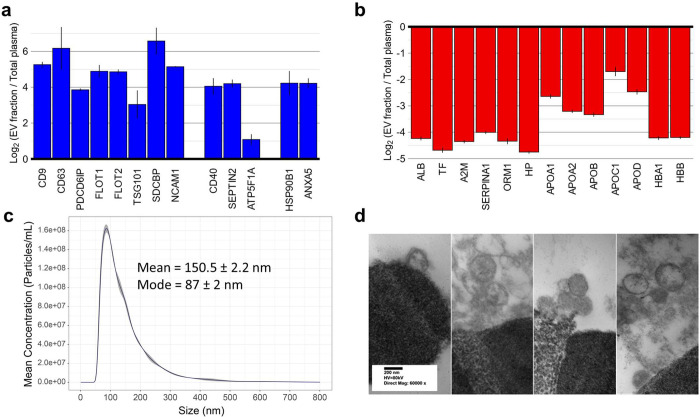
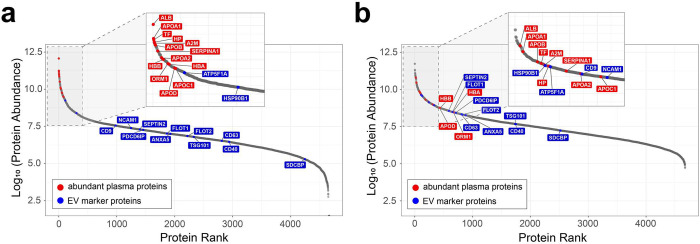
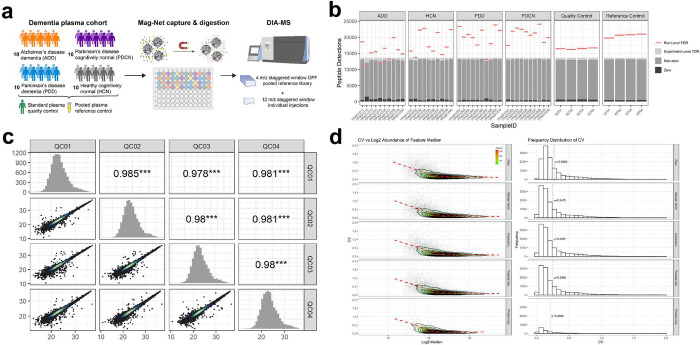
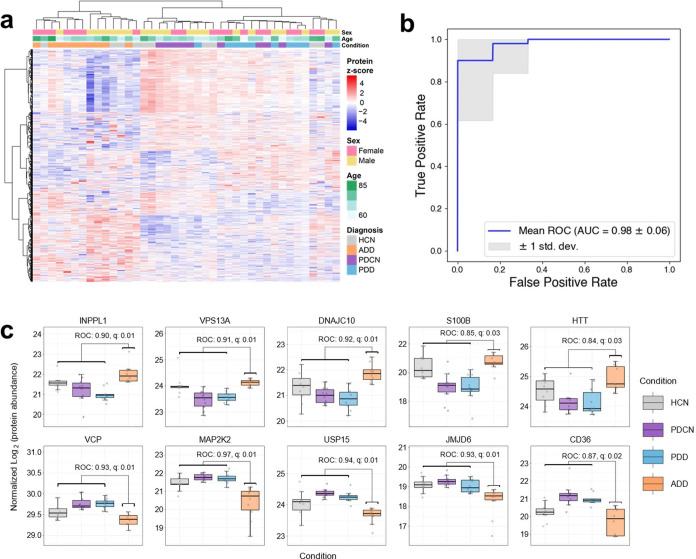
Membrane-bound particles in plasma are composed of exosomes, microvesicles, and apoptotic bodies and represent ~1-2% of the total protein composition. Proteomic interrogation of this subset of plasma proteins augments the representation of tissue-specific proteins, representing a "liquid biopsy," while enabling the detection of proteins that would otherwise be beyond the dynamic range of liquid chromatography-tandem mass spectrometry of unfractionated plasma. We have developed an enrichment strategy (Mag-Net) using hyper-porous strong-anion exchange magnetic microparticles to sieve membrane-bound particles from plasma. The Mag-Net method is robust, reproducible, inexpensive, and requires <100 μL plasma input. Coupled to a quantitative data-independent mass spectrometry analytical strategy, we demonstrate that we can collect results for >37,000 peptides from >4,000 plasma proteins with high precision. Using this analytical pipeline on a small cohort of patients with neurodegenerative disease and healthy age-matched controls, we discovered 204 proteins that differentiate (q-value < 0.05) patients with Alzheimer's disease dementia (ADD) from those without ADD. Our method also discovered 310 proteins that were different between Parkinson's disease and those with either ADD or healthy cognitively normal individuals. Using machine learning we were able to distinguish between ADD and not ADD with a mean ROC AUC = 0.98 ± 0.06.


Conflict of interest statement

COMPETING FINANCIAL INTERESTS Ireshyn Govender, Stoyan Stoychev and Justin Jordaan are employed by ReSyn Biosciences, proprietors of MagReSyn® technology. The MacCoss Lab at the University of Washington has a sponsored research agreement with Thermo Fisher Scientific, the manufacturer of the mass spectrometry instrumentation used in this research. Additionally, Michael MacCoss is a paid consultant for Thermo Fisher Scientific.

Figures

Figure 1.
Figure 1.. Mag-Net affinity capture workflow.
a) SAX magnetic beads are incubated with plasma to sieve and bind negatively charged membrane-bound particles. The beads are immobilized with a magnet and abundant plasma proteins are gently washed away. The membrane particles are lysed on the beads and proteins are reduced and alkylated, precipitated back onto the beads, and then digested with trypsin. Peptides are collected and analyzed using nLC-MS/MS. b) The Kingfisher robot method to automate the Mag-Net workflow.
Figure 2.
Figure 2.. DIA-MS/MS analysis of the peptides from enriched membrane particles and unfractionated plasma.
a) The number of peptides detected from three preparations of the same plasma sample at a 1% FDR with three different analysis strategies. The different analysis strategies were the use of EncyclopeDIA with a Prosit library (blue), EncyclopeDIA with a chromatogram library generated from gas phase fractionation (yellow), and DIA-NN in library free mode. EncyclopeDIA reports peptides detected and DIA-NN reports peptide precursors. The Mag-Net protocol detected a minimum of 451% more peptides than using the same analysis with unfractionated plasma. b) Proteins detected at a 1% FDR with the three different analysis strategies. The use of EncyclopeDIA with an on-column chromatogram library returned the most peptides and proteins and, thus, was used for all further analysis. c) Differential analysis of proteins between the enriched membrane particles (blue) and the same unfractionated plasma sample (red). d) The 2877 proteins that were enriched in the Mag-Net protocol were used to assess the enrichment of Jensen COMPARTMENTS using the Enrichr tool. * DIA-NN reports peptide precursors whereas EncyclopeDIA reports peptides. This makes the comparison of peptide detections between tools challenging.
Figure 3.
Figure 3.. Characterization of Mag-Net enriched membrane particles.
a) Fold enrichment of protein groups compared to total plasma. b) Fold depletion of protein groups compared to total plasma c) Nanosight particle count d) micrographs of captured membrane particles on bead surfaces using transmission electron microscopy.
Figure 4.
Figure 4.. Dynamic range of the plasma proteome.
The peptide signal was measured using the average of triplicate measurements performed using PAC total plasma digestion (A) and the Mag-Net extracellular vesicle capture method (B). If a peptide was not detected in a specific LC-MS run, the data from the runs where it was detected was used to provide boundaries to compute a background subtracted area where the peptide would be located if it were present. The peptide areas were normalized by equalizing the total ion current (TIC) between runs and the protein abundance calculated by summing the peptides mapping to a parsimonious protein group. The EV marker proteins are shown in blue and the classic abundant plasma proteins in red. The signal plotted for the protein abundance in the total plasma sample spans ~10 logs. Despite the classic plasma proteins being depleted by ~95% following Mag-Net, those proteins are still some of the most abundant proteins in sample.
Figure 5.
Figure 5.. Summary of the matrix matched calibration curve data.
A) Schematic of the volumetric mixing of human plasma with chicken plasma for 7 of the dilution points. The percentage represents the percent volume of human plasma where the remainder represents chicken plasma. The mixed plasma samples were enriched and digested using the Mag-Net protocol. Following peak detection with EncyclopeDIA, peptides conserved between human and chicken were removed. The peptide background subtracted peak areas were determined using Skyline and the ratio of the peptide area relative to the area from the 100% undiluted human sample. B) The measured Log2 area ratios versus the expected % human plasma.
Figure 6.
Figure 6.. Application of Mag-Net for the assessment of markers of ADD, related diseases, and controls.
a) We used a carefully selected cohort of plasma samples from 40 individuals (10 with ADD, 10 with PDD, 10 with PDCN, and 10 who were HCN). The individual samples in addition to two different controls were prepared using Mag-Net. The two pooled plasma sample were prepared four separated times and peptides quantified by data independent acquisition. One sample was used as a quality control for the quantitative measurements and the second was prepared as a reference control. b) The number of peptides detected when the FDR was controlled on the per run level (red lines) and on the entire experiment level (light grey). The dark grey represents the number of peptides with a non-zero quantity. c) The log2 peptide abundances measured between 4 separate preparations and measurement of the same quality control sample. The lowest Pearson correlation coefficient between pairs was 0.978. d) Effect of different data processing steps on the coefficient of variation of different peptide and protein quantities. The top row shows the RAW peptide intensities, followed by the data with median normalization, the effect of imputation, peptide grouping and protein grouping on the last row.
Figure 7.
Figure 7.. Measurement of proteins that provide separation between disease cohorts.
a) Heatmap of 1093 proteins that had an ROC > 0.7 from any of the six pairwise analyses described in the text. b) A receiver operator characteristic (ROC) curve that illustrates our ability to correctly separate people with ADD from other groups (i.e. PDD, PDCN, and HCN) using a hard-margin SVM with linear kernel. The plot shows the mean and standard deviation of 10 iterations of five-fold stratified cross validation with different random splits. c) Illustration of selected protein coding genes that are either increased (INPPL1, VPS13A, DNAJC10, S100B, and HTT) or decreased (VCP, MAP2K2, USP15, JMJD6, and CD36) in ADD plasma when compared with the other three disease groups.

References

    1. Bruderer R. et al. Analysis of 1508 Plasma Samples by Capillary-Flow Data-Independent Acquisition Profiles Proteomics of Weight Loss and Maintenance ‘[S]. Molecular & Cellular Proteomics 18, 1242–1254 (2019). - PMC - PubMed
    1. Liu Y. et al. Quantitative variability of 342 plasma proteins in a human twin population. Mol. Syst. Biol. 11, 786 (2015). - PMC - PubMed
    1. Geyer P. E., Holdt L. M., Teupser D. & Mann M. Revisiting biomarker discovery by plasma proteomics. Molecular Systems Biology 13, 942 (2017). - PMC - PubMed
    1. Niu L. et al. Plasma proteome profiling discovers novel proteins associated with non-alcoholic fatty liver disease. Mol Syst Biol 15, e8793 (2019). - PMC - PubMed
    1. Anderson N. L. & Anderson N. G. The Human Plasma Proteome: History, Character, and Diagnostic Prospects*. Molecular & Cellular Proteomics 1, 845–867 (2002). - PubMed

Publication types

LinkOut - more resources